NYKAA :Likely Double Bottom Pattern BreakoutNYKAA
Trading at 277 and in daily chart has given Golden Cross over of DEMA (10DEMA Vs 20/50/100DEMA)
Witnessed Volume break out
Has formed Double bottom pattern -Indicates a possible break out after a period of consolidation.
Holding above its neckline breakout point at 280 on closing basis/sustained level likely to test 300-330+(For educational purpose only)
Double Top or Bottom

Double bottom created in Dmart 1) On support dmart have formed double bottom pattern
2) falling wedge pattern makes more confirmation that buyers are taking control now
3) In negative market stock didn't breakdown
4) In short term stock may reach 4300 levels with strict sl R:R is good

$VOLTAS — watchout Double Bottom Breakout
Voltas formed a clear Double Bottom pattern, signaling a potential trend reversal.
Price broke above the neckline, confirming bullish strength and shift in momentum.
Post-breakout, the stock showed strong follow-through buying.
The pattern-measured target is 1444 .
The move validates the structure and highlights demand emerging from lower levels.
Going ahead, price action near this zone will be important to watch for consolidation or continuation.

CAD/JPY – 15 Min CADJPY is currently auctioning into a well-defined premium array, approaching clustered buy-side liquidity resting just beneath the 114.00 psychological handle. The recent impulsive expansion exhibits the characteristics of a liquidity engineering move, suggesting the objective may be stop collection rather than authentic bullish continuation.
Price is interacting with a refined bearish order block, aligned with the upper boundary of the active dealing range. The lack of efficient acceptance beyond this region implies potential institutional distribution, positioning the market for a rotational move back toward value.
Market Structure Assessment
Gradual expansion into equal highs signals buy-side liquidity buildup
Current test of premium favors distribution over accumulation
Any rejection here would likely confirm a lower timeframe market structure shift (MSS)
Downside delivery could accelerate as price seeks internal inefficiencies
Order flow at this elevation suggests vulnerability to a liquidity-driven retracement.
Current Dealing Range Logic
With price trading at the upper extreme of the range, the market sits firmly in premium territory, where risk-reward increasingly favors short positioning.
The highlighted zone should be interpreted as a distribution / mitigation area, not evidence of bullish acceptance. Unless price can reprice higher with displacement, this region remains tactically favorable for fade setups.
Scenario Framework
Primary Thesis | Rotation Toward Discount
Initial draw on liquidity rests near 113.55, the first internal support
A break lower exposes the fair value gap (FVG) around 113.20, aligning with equilibrium
Failure to stabilize there increases probability of continuation into 113.10, where deeper sell-side liquidity may reside
The projected move would represent a classic premium-to-discount rebalancing
Risk / Invalidation
Sustained acceptance above 114.05 would invalidate the distribution thesis
Such price behavior would signal successful buy-side continuation and a shift in order flow toward bullish expansion
📌 Bias: Short while price operates in premium after a probable buy-side sweep
📌 Context: Liquidity buildup → premium test → distribution potential
📌 Market Condition: Range-bound environment with elevated probability of rotational mean reversion

Power Grid (D): Aggressive Bullish (Guidance-Backed Breakout)(Timeframe: Daily | Scale: Linear)
The stock has staged a violent recovery from its long-term support zone of ₹250. This is not just a technical bounce; it is a Fundamental Re-rating driven by the Capex hike and strong Q3 numbers.
🚀 1. The Fundamental Catalyst (The "Why")
The technical breakout is fueled by three major factors:
> Capex Upgrade: The management raised its FY26 capital expenditure guidance to ₹32,000 Crore (up from ₹28,000 Cr). Higher capex implies higher future asset capitalization, which directly boosts regulated returns (RoE).
> Q3 Earnings: The company reported an 8% YoY jump in Net Profit (₹4,185 Cr) and declared a second interim dividend of ₹3.25/share .
> Sector Tailwind: The Power sector is rallying post-Budget expectations, and Power Grid is the primary beneficiary of transmission grid expansion.
📈 2. The Chart Structure (The Double Bottom)
> The Support: The ₹251 – ₹254 level.
- Significance: The stock took support here in Feb-Mar 2025 and again in Jan 2026. This formation creates a classic "Double Bottom" on the weekly/daily charts.
📊 3. Volume & Indicators
> Volume Ignition: The 37 Million volume is an "Institutional Stamp." It confirms that "Smart Money" is entering to ride the upgraded growth guidance.
> RSI: Rising in all timeframes. The Daily RSI is about to break above 60 with such volume indicates the start of a new "Markup Phase."
Conclusion
Look out for the price action in the coming days

Double Top Pattern🧭 Overview
A Double Top is a bearish reversal pattern that indicates a potential end to an uptrend and a shift toward a downward phase. It forms an “M”-shaped structure on the chart, marked by two consecutive peaks at nearly the same level, separated by a moderate pullback known as the neckline. The pattern is confirmed when price decisively breaks and closes below the neckline, signaling weakening buying strength and a change in market control.
------------------------------------------------------------
🔑 Key Components of a Double Top Pattern
1️⃣ First Peak
Price rallies strongly to a high, marking the end of an extended upward move. A pullback follows, indicating the first sign of resistance.
2️⃣ Trough / Neckline
After the first peak, price retraces to a support area and stabilizes. This level forms the neckline, which acts as a key decision zone.
3️⃣ Second Peak
Price attempts to rise again toward the previous high but fails to break above it. This failure reflects weakening buying momentum and growing selling pressure.
4️⃣ Breakdown (Confirmation)
The pattern is confirmed when price breaks and closes below the neckline, signaling a shift in trend direction.
------------------------------------------------------------
📊 Chart Explanation
Two prominent peaks form near the same price level, highlighting strong resistance.
The pullback between the peaks creates a clear neckline support.
The second peak shows reduced strength compared to the first.
A decisive breakdown below the neckline confirms the reversal and opens the path toward lower levels.
------------------------------------------------------------
📝 Summary
• Double Top forms after a strong uptrend.
• Failure at the second peak indicates buyer exhaustion.
• Neckline acts as a key confirmation level.
• Breakdown below the neckline validates the reversal structure.
------------------------------------------------------------
⚠️ Disclaimer
📘 For educational purposes only
🙅 Not SEBI registered
❌ Not a buy/sell recommendation
🧠 Shared purely for learning and pattern understanding
📊 Not Financial Advice

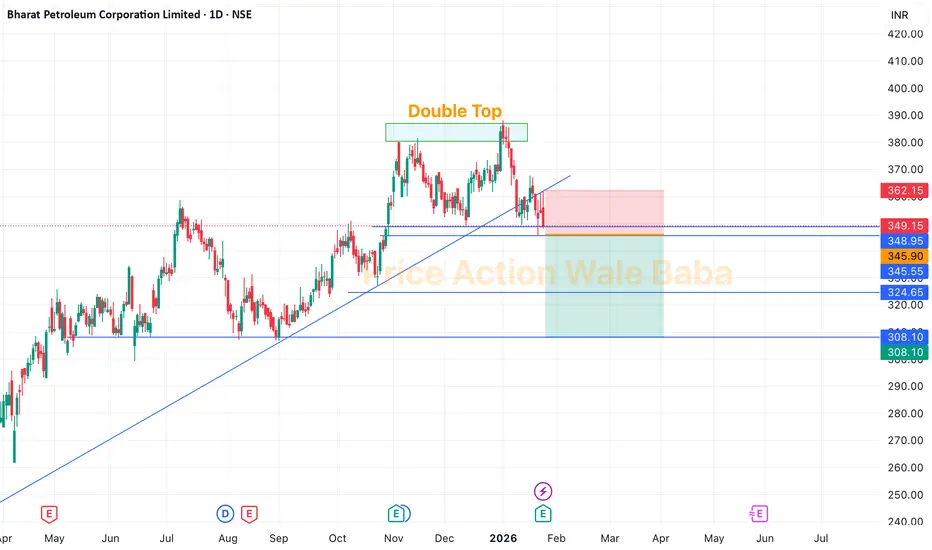
BPCL - Double TopBPCL is forming a Double Top which is has neckline of 345.
Delivery Based Selling Strategy:
Sell below 345,
Keep SL on high of 23rd Jan candle, which is 361.
Targets are 320-300.
Option Buying Strategy
So, for the option trading in this stock, you can choose any PUT option on BPCL, mark high of 21st Jan candle in option, once it breaks it just buy and keep SL below same day's low.
NIFTY: Textbook Double Top with a Possible Crash of 7000 pt?Technical Analysis
• Previous All-Time High:
Nifty formed its earlier ATH around the 26,300 zone near the end of September 2024.
• Second Phase of Bull Rally:
The next leg of the rally began in early April 2025, with Nifty once again moving up to the 26,300 resistance, but failing to break above it.
• Repeated Rejection at Resistance:
Multiple attempts to decisively cross the 26,300 zone were observed between December 2025 and early January, all of which failed — reinforcing this level as a strong supply zone.
• Distribution Phase:
A textbook distribution pattern appears to be forming, indicating potential exit of smart money.
o FII selling: Approximately ₹80,000 crore sold since December 2025.
Macro Headwinds
• Ongoing geopolitical uncertainty
• Safe-haven rally in Gold & Silver, driven by sustained central bank buying
________________________________________
Trade Setup
Entry Trigger
• Breakdown below the upward trending channel around 24,900
• Daily candle close below this level for confirmation
________________________________________
Trade Structures
• Put Ratio Back Spread
o Limited risk
o Unlimited reward potential
• Long-term Bear Put Spread
o High risk–reward profile
o Target RR of at least 1:10
Risk Factors
• Indian Union Budget on 1st February
→ Avoid aggressive short-term option selling or directional trades around the event
Educational purpose only. Happy chart reading!!!

NIFTY Faces Pressure: Can 24,300 Hold?NIFTY has turned weak after falling around 2.5% on the weekly chart. The index has made a double top near 26,250, which usually means the market is finding it hard to move higher from that area.
On the weekly chart, the candles look bearish. NIFTY is currently holding near an important support around 25,000 (50 EMA). If this level breaks, the market may move lower towards 24,300 and even 23,900.
On the daily chart, NIFTY is trading below all major moving averages (20, 50, 100 & 200 EMA). In the past, whenever NIFTY stayed below these averages, it usually corrected further. Right now, there is no strong support before 24,600.
On the monthly chart, a double top is visible again, showing weakness at higher levels. However, there is decent support near 24,300–24,240, which is also close to the monthly 20 EMA.
Momentum is also weakening. RSI is showing bearish divergence on weekly and monthly charts, which suggests upside strength is fading.
Resistance Levels :- 25,200 – 25,300, 25,500, 26,250
Support Levels :- 24,987, 24,600, 24,300 – 24,240, 23,900
Overall View
As long as NIFTY stays below 25,500, the trend remains weak. Market direction will become clearer near the 24,300 support zone.

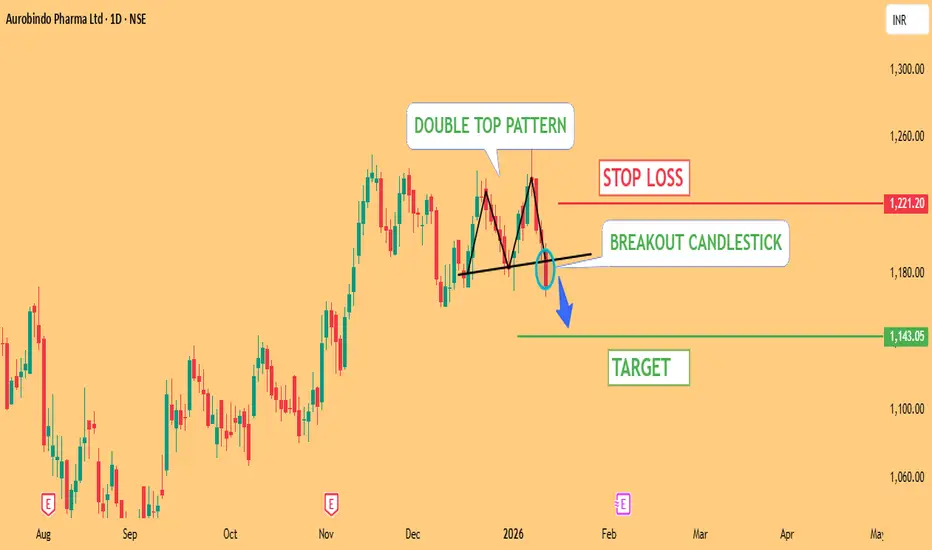
AUROBINDO PHARMA – Bearish Breakdown patternAurobindo Pharma has broken down from a Double Top pattern , confirming bearish momentum.
🔻 Structure: Double Top Breakdown
🔻 Trend: Bearish
🔻 Volume: Breakdown supported by selling pressure
Trade Setup (Short):
Entry: Below Double Top neckline (breakdown zone)
Target: 1143 🎯
Stop Loss: 1221 ⛔
As long as price stays below 1221, downside pressure may continue. A decisive move towards 1143 is expected if bears maintain control.
⚠️ Disclaimer: This is for educational purposes only. Not financial advice. Manage risk properly.
NIFTY Analysis: Double Top Breakdown & Daily 50 EMA Resistance
The current price action has confirmed a Double Top reversal pattern on the daily timeframe. Following the breakdown of the neckline, the technical bias has shifted, supported by key trend indicators.
Key Trading Points
Double Top Confirmation: Price has decisively broken below the pattern’s neckline, signaling a potential shift from bullish to bearish momentum.
EMA Resistance: The price is currently trading below the Daily 50 EMA, which is now acting as dynamic resistance and confirming the short-term bearish trend.
Wait for the Retest: My current plan is to stay patient and wait for a pullback (retest) to the broken neckline. I will observe how price reacts at this level to determine the next major move.
Bullish Invalidations: I am strictly avoiding any bullish trades at this time. Long positions will only be considered if the price manages to reclaim and trade sustainably above the neckline.
The Game Plan
"Until the price breaks back above the neckline and flips the 20 EMA, the path of least resistance remains to the downside. I am waiting for the retest to gauge whether this is a trap or a confirmed trend reversal."
Disclaimer: This is my personal trading view and not financial advice. Always manage your risk.

ETH/USD 1H: Double Top Formation Under WatchEthereum is showing a classic 'M' pattern on the hourly chart. If the support level breaks, we could see a significant move lower. Watching the price action for confirmation

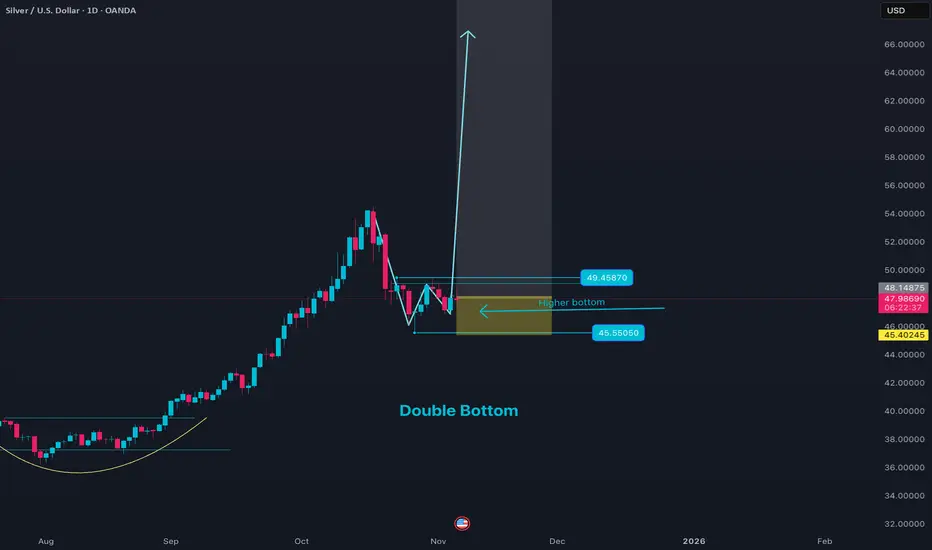
Silver Price Action set up with double bottomThe current price analysis for XAGUSD (Silver against US Dollar) in early November 2025 reveals a mixed but cautious outlook. Silver prices are moving within a corrective phase after exiting a bullish channel, trading approximately in the $47.50 range. Technical indicators such as moving averages currently suggest a bearish to neutral trend, with the price testing key resistance levels around $48.45.
Price momentum shows attempts to push higher, but resistance near $48.45 may lead to a price pullback or consolidation. If silver breaks above the critical resistance at $50.45, it could signal a renewed upward trend targeting levels around $52.35. Conversely, a failure to hold support near $46.75-47.00 may accelerate declines towards below $41.45, indicating a bearish phase.
Fundamentally, silver is influenced by the strength of the US dollar, industrial demand recovery (notably from solar energy and electronics sectors), and safe-haven buying amid global market uncertainty. The metal’s sensitivity to Federal Reserve policy and economic indicators continues to drive short-term volatility.
Traders should watch for sustained moves beyond the $48-$49 resistance or breakdown below $46.75 to gauge next directional trends. Overall, silver price dynamics suggest potential for both short-term rallies and corrections, dependent on macroeconomic cues and technical breakouts.
Policybazaar – Double Top Breakdown & Three Black CrowsPolicybazaar has formed a Double Top near the resistance zone, and price has now broken down below the neckline, confirming a bearish trend reversal. The downside view is further validated by the formation of a Three Black Crows candlestick pattern, which signals strong and sustained selling pressure.
The Three Black Crows reflect aggressive distribution after a failed upside attempt, indicating that bears remain firmly in control and downside continuation is likely.
Technical Highlights:
📌 Double Top confirmed breakdown
📉 Trading below neckline support
🕯️ Three Black Crows = strong bearish continuation
Volume supports selling pressure
Trade Plan :
Sell on pullbacks near the breakdown zone
Target: 🎯 1631
Stop-loss: Above the neckline / high of the Three Black Crows pattern
Bias:
Structure remains bearish unless price reclaims and sustains above the neckline.
⚠️ For educational purposes only. Not financial advice. Manage risk appropriately.

BSE cmp 2790.60 by Daily Chart viewBSE cmp 2790.60 by Daily Chart view
- Support Zone 2570 to 2670 Price Band
- Resistance Zone 2790 to 2915 Price Band
- Bullish "W" Double Bottom by Support Zone base
- Rising Support Trendline well sustained and respected
- Falling Resistance Zone Trendline Breakout been attempted
- Volumes spiked today with good sync with the avg traded qty

NIFTY Ready to Fly - Double Bottom BreakoutNIFTY Trade View (Technical):
Pattern : Double Bottom
Status : Breakout confirmed
Target : 26,310
Stop Loss : 25,900
Quick technical context:
A double bottom breakout generally signals trend reversal / continuation strength, especially if it’s supported by:
Strong closing above the neckline
With SL at 25,900 , the setup offers a defined risk, which is good discipline.
Risk note (important):
Markets can be volatile, and false breakouts do happen—especially near all-time highs. Trailing the stop loss if price moves in your favor can help protect gains.

BSE- Correction phase startsAfter more than 2000% rally in 2 years, BSE finally formed a double top pattern in monthly. The target for this pattern is 1241 which is the confluence of fib 0.618 + Monthly support + blue channel support.
Note: This is for educational purpose and not a trade recommendation.

Major Crash Ahead?The Diametric Pattern completed.
2-stage confirmation achieved.
The Major impulsive downtrend has begun - Unless there is a sharp reversal upside by next week.

BUY TODAY SELL TOMORROW for 5%DON’T HAVE TIME TO MANAGE YOUR TRADES?
- Take BTST trades at 3:25 pm every day
- Try to exit by taking 4-7% profit of each trade
- SL can also be maintained as closing below the low of the breakout candle
Now, why do I prefer BTST over swing trades? The primary reason is that I have observed that 90% of the stocks give most of the movement in just 1-2 days and the rest of the time they either consolidate or fall
Double Bottom Breakout in 5 PAISA
BUY TODAY SELL TOMORROW for 5%

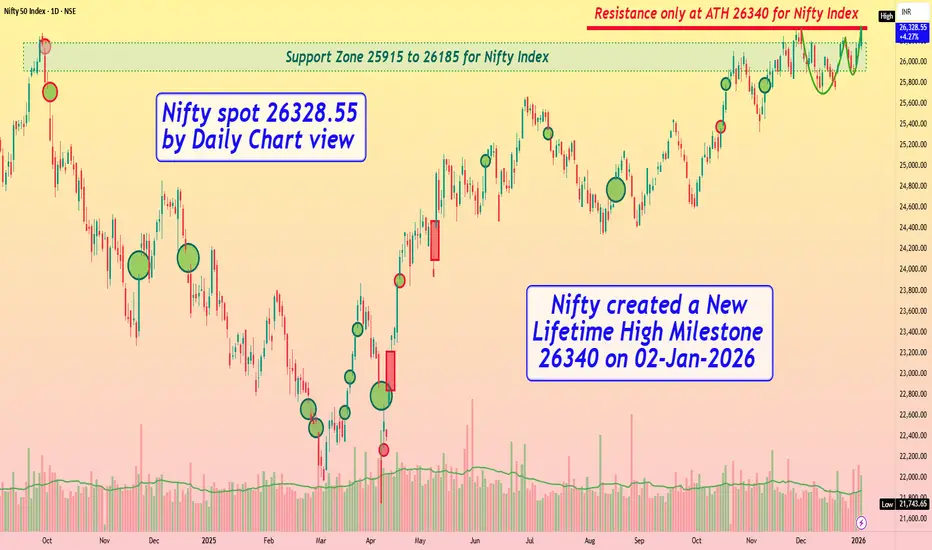
Nifty spot 26328.55 by Daily Chart view - Weekly UpdateNifty spot 26328.55 by Daily Chart view - Weekly Update
_*Nifty created a New Lifetime High Milestone 26340 on 02-Jan-2026*_
- Support Zone 25915 to 26185 for Nifty
- Resistance only at ATH 26340 for Nifty and each New ATH
- Volumes trending above avg traded quantity but with selling pressure
- Bullish Rising W formed by the neckline at previous ATH and New ATH level
- Hope to see further higher levels for the Nifty Index through the New Year 2026

HIND COPPER: Still has unfinished TragetsHIND COPPER :Trading at 495 still has momentum
Even in Monthly chart Trading above all its Moving averages 10 DEMA/20DEMA/50DEMA/100 DEMA.
Has formed a huge Rounding bottom pattern and trading above its neckline breakout suggests a move to 600+
As per FIB Extension 23.6% lies at 535
FIBONACCI Extension 38.2% lies at :605
Especially those who are long shall trail their profits with SL of 510 on a closing basis for a Target of 535/550/575/600(For educational purpose only)

Strides Pharma - Volumes Backing a Breakout?Daily Timeframe Analysis
The setup is heating up and now we’ve got volume profile data to back it. The price is hovering around ₹666.10, and it looks like it's building strength for a bigger move.
🔹 Key Observations:
Price is compressing under a falling trendline (descending triangle or wedge).
Strong volume node around the ₹650–₹675 zone. This means a lot of trading activity happened here — a key decision area.
Fibonacci projections suggest targets as high as ₹984.00, which is a +40% upside.
Breakout confirmation above ₹692.75 (61.8% level) can trigger a rally.
🔹 Important Levels:
📍 Resistance: ₹692.75 → ₹741.65 → ₹804.00 → ₹984.00
📉 Support: ₹624.00 → ₹581.50 → ₹530.00 → ₹515.20
📊 Volume Insight:
The visible range volume profile shows most trading volume has happened below the current price, which is bullish. If the price breaks above the current squeeze, it might fly with less resistance overhead.
🧠 Thought:
This chart is a coiled spring. If bulls push above ₹692 with momentum, this might become a quick swing to ₹740+, and maybe more in the short to medium term.
📝 #StridesPharma #BreakoutSetup #VolumeProfile #SwingTrade #IndianStocks
