Solana market dominance This price action shows the dominance of solana in crypto market
So its breaking out is all time high dominance.. solana can be bought for long term investment
Double Top or Bottom

BANK NIFTY-Too seems to be in a weaker teritoryBANK NIFTY: Has already breached all its critical DEMAs and has only its 200DEMA which falls at around 46100 and is acting as the major support. Expect sell on rally till it holds above 47000 comfortably and on a closing basis.On the contrary BNIFTY giving a close below 46000 expect a sharp fall extending to 45500/45000 and below.*(For edicational purpose only)

NIFTY-Still the threat of Triple Top Pattern PersistsNIFTY : Struggling around 22000 to hold it. NIFTY has formed Triple Top which is a bearish pattern.strictly going by the pattern for the neckline breakdown at around 21900 its likely to drift towards 21500-21000. NIFTY drifting below 21900 on closing basis expect more selling pressure to come to take it towards 21500-21000 levels. The pattern will get negated if NIFTY starts giving a close above 21150-200levels(For educational purpose only)

AUDIOUSDT Breakout Alert! 🚀 Watch Weekly Close Confirmation! 📈💎 If AUDIOUSDT successfully breaks out above the specified area with a confirmed weekly candle close, it may signal continued upward momentum.
💎 In the event of a breakout above the resistance area followed by a proper retest, this could confirm the presence of a W pattern, increasing the likelihood of further upward movement towards the next resistance level. Should there be a pullback, a bounce from the bullish OB can be anticipated.
💎 However, if the price breaks down below the bullish OB, it would indicate a bearish market structure. In such a scenario, it may be prudent to avoid trading AUDIO until clearer price action emerges.

Cup and Handle + W Pattern Formation! 📈 Get Ready for Potential💎 MINA has formed a cup and handle pattern, along with a W pattern on the demand level, which enhances the likelihood of a bullish move.
💎If MINAUSDT breaks above the resistance area, we can anticipate targets up to the next resistance level. In the event of a pullback, we can expect a bounce from the demand level.
💎However, if the price breaks down below the demand area, it would suggest a bearish structure. In such a scenario, it would be prudent to wait for better price action before making any decisions.

Nifty50 - Double BottomNifty50 made Double Bottom Pattern at 1hr chart, I made this on 11mar, posting today.
It has also breached its trendline pattern, which it was following since 24jan, lets see if Reversal happens or it touches 21900.
For my learning and digital records purpose only!

NIFTY-Bearish Triple Top PatternNIFTY: A s per hourly chart ,NIFTY has formed a Triple Top which is a bearish paattern.
As per the pattern it shows a downward Target of 22200/22000 and drifting to 21800 zone again.
The pattern is likely to get negated if NIFTY manages to give a close above 22400(For educational purpose only)

BLOK Breakout Alert! 🚀 Bulls Charging Ahead! 🐂💎 BLOK has broken out of a resistive trendline and formed a W pattern with CHoCH & BOS, indicating a bullish market structure and increasing the probability of a bullish move.
💎Although the price has already broken above the resistance zone, confirmation via a candle closing and retest is needed for bullish confirmation. In the event of a pullback, we can anticipate a bounce from the demand zone along with the bullish OB level, after which we can set targets for the next resistant levels.
💎However, if the price breaks down below the demand area, it would be prudent to wait on BLOKUSDT in that scenario and observe for better price action to form before making any decisions.
B

Double Bottom & Double Top Patterns and How To Trade Them👋 Hello Trading community and my friends so today i came here with an educational post hope you like my work mates, In technical analysis quite often we hear about Double bottom and Double top patterns so today i am sharing that in very simple and easy to understand way. Although a lot can be understood from the idea's image alone but for those who are new to technical analysis i am explaining them by the description below.
⚪ Double bottom pattern-:
It is a bullish reversal pattern that typically occurs at the end of a downtrend. It consists of two distinct lows at approximately the same price level, separated by a peak in between. Here's how you can identify and trade on a double bottom pattern:
⭐️Identify the Pattern- Look for two consecutive troughs (low points) in the price chart, with a peak (high point) in between. The lows should be roughly at the same price level, forming a "W" shape.
⭐️Confirmation- After identifying the double bottom pattern, it's important to wait for confirmation before entering a trade. Confirmation can come in the form of a breakout above the peak that separates the two lows. This breakout should ideally be accompanied by an increase in trading volume, signaling strong buying interest.
⭐️Entry- Once you have confirmation of the pattern, you can enter a long (buy) position. Some traders prefer to enter immediately after the breakout above the peak, while others wait for a pullback to the breakout level before entering to improve risk-reward ratios.
⭐️Stop Loss- So there are no particular definition of stop loss after the activation of trade because it totally depends on a trader's setup some takes below resistance close or trigger basis and some can take below the recent swing low and maybe there are some more ways too.
⭐️Target- Determine a target price based on the height of the pattern. Measure the distance between the lowest point of the double bottom and the peak, and then add this distance to the breakout level. This gives you a potential target for your trade.
⚪ The double pattern-:
it is another common technical analysis pattern observed in financial markets, often signaling a potential reversal of an uptrend. The double top pattern typically occurs after an extended uptrend in the price of an asset.
⭐️Identify the Pattern- It consists of two consecutive peaks (or tops) at approximately the same price level, separated by a trough (or valley) in between. The peaks resemble the letter "M" on the price chart.
⭐️Confirmation- Traders typically look for confirmation signals to validate the pattern, such as a break below the trough between the two tops, increased volume during the breakdown, or other technical indicators like bearish divergence on oscillators such as the RSI or MACD.
⭐️Entry- Enter a short trade after confirmation, preferably when the price breaks below the trough between the two tops. Some traders may wait for a pullback to the breakdown level before entering to improve risk-reward ratios.
⭐️Stop Loss- So as i said above for the double bottom stop loss now telling the same for it too that it depends on trader to trader setup that some can take stop loss above resistance on closure or trigger basis and some can take above recent swing high likewise.
⭐️Target- Set a target for your trade based on the height of the pattern, which is the distance between the peak and the trough. Additionally, consider other support levels or Fibonacci retracement levels as potential targets.
⭐️Remember that no trading strategy is foolproof, and it's essential to combine the Double bottom & Double top patterns with other forms of analysis for better accuracy and risk management.
⭐️Risk Management- Always manage your risk by sizing your position appropriately and setting stop-loss orders. Additionally, consider the overall market conditions and use other technical indicators to confirm your trade decision. As always, combining technical analysis with proper risk management and market understanding is crucial for successful trading.
⭐️Exit- Exit the trade when your target is reached, or if the price shows signs of reversing. Pay attention to other technical indicators or chart patterns that may suggest a change in market sentiment.
My Setup-: So after the confirmation usually i take retest entries to minimize my risk for these type of trades and somehow retests gives me more confirmations too of the strength of breakout, And one more thing i use and that is RSI indicator with default settings for these type of trades provided by Trading View so thank you very much to them. Stop loss i take on closing basis above or below on support and resistance. This is educational post so no logic to update this idea but still then if i will get any good example i will provide that via update. Thanks for reading and giving your valuable time.
Best Regards- Amit
“I get real, real concerned when I see trading strategies with too many rules (you should too).”
Larry Connors

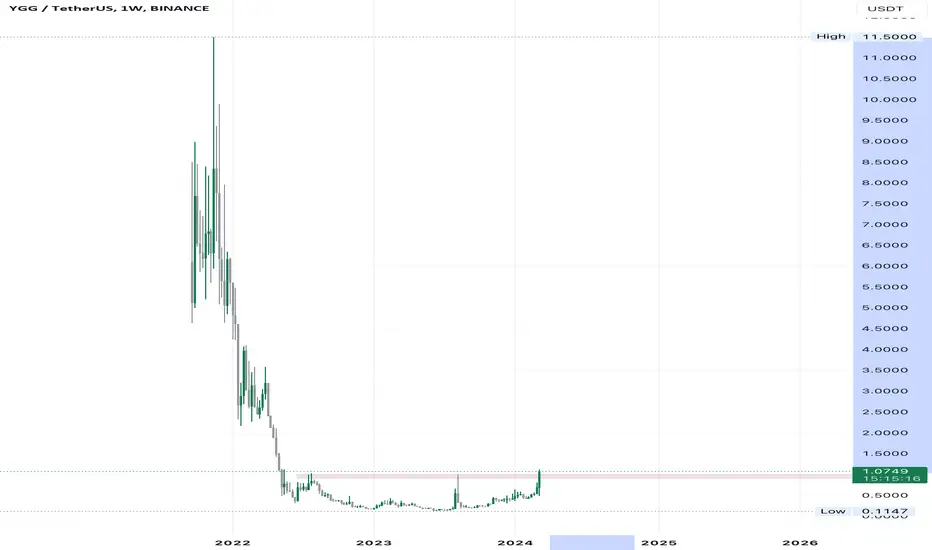
Ygg coin bullish*coin of hottest sector (gamefi)
*huge potential for good returns
*good breakout on chart
*buying in a crypto bullrun24
What else you need .
JAGSNPHARM 1:10+ RR trade set up1. Set up: Reversal Trade from support levels
2.Double bottom at support
3. RR: Minimum 1:10
4. Early unconfirmed entry is high rewarding so building position now would b a wise decision

BALAJIAMINES DOUBLE BOTTOM BREAKOUTBalajiamines breaking double bottom pattern
with huge volume
strong rsi macd crossover
#target 2700
EDUCATIONAL IDEA

BALAMINES reversal trade set up1. Trend reversal
2. set up double bottom
3. Strength: Stronger
4. RR: 1:6+
5. Crisp and clear trade set up

REEF Breakout Alert! 🚀 Get Ready for Potential Bullish Momentum💎REEF has recently broken out of a resistive trendline and formed a W pattern, which increases the likelihood of a bullish move, especially after a retest of the resistance zone.
💎Following the retest of the resistance zone, we can anticipate price targets towards the next resistant zones. However, if the price falls back below the resistance zone, it may trap breakout traders, potentially leading to a downward move. In such a case, it would be prudent to anticipate a bounce from the demand area.
💎Nevertheless, if REEFUSDT also breaks down below the demand area, it would be advisable to refrain from trading REEF in that scenario and wait for clearer price action to develop.
R


SBI Analysis!! Will SBI move as per Double Bottom(W)Pattern??SBI Daily Analysis
Double Bottom Pattern Formation in SBI
SBI has made Double Bottom Pattern . As per analysis The projected Target of SBI would be 605.65 but we all know there will be some buffer in theoretical and actual movement so i divided the profit into two parts. The target 1 will be 605.65 and target 2 will be 649.85 this is the highest level of projected profit. Will se what happens?
Entry = Above 568
Target = 1) 605.85 2) 649.85
Stop Loss = Below 554.90
Disclaimer = All my analysis are for Educational Purpose only. Before entering into any trade - 1) Educate Yourself 2)Do your own research and analysis 3)Define your Risk to Reward ratio 3)Don't trade with full capital

AU Small Finance Bank Analysis! NSE:AUBANK Weekly Analysis!
Double Top Pattern Formation is AUBANK!
Double Top Pattern breakout in AUBANK!
RSI Divergence!
AUBANK crossed 50,100 and 200 EMA, will is leads towards further downtrend?
Analysis:( Only for Pattern Analysis )
NSE:AUBANK formed Double Top Pattern on a Weekly time frame. We can clearly see on the chart that previous trend was uptrend and Double Bottom ideally formed after an uptrend so it's a valid scenario to be move ahead with the Double Bottom or M Pattern. I have done complete analysis on the chart so please have a look on it.
Trade Psychology and Setup:
Entry = Current levels are not good for short(570-580)
Target = 495.70
Stop Loss = 674.95
Disclaimer = All my analysis is for Educational Purposes only.
Before entering into any trade -
1) Educate Yourself
2) Do your research and analysis
3) Define your Risk to Reward ratio
4) Don't trade with full capital

UTK Breakout Alert: Bulls on the Move!🚀🔥"💎UTK has recently broken out of a descending channel and formed a W pattern, accompanied by signs of increasing bullish momentum indicated by CHoCH.
💎Should UTKUSDT successfully breach the resistance zone, it would confirm the W pattern formation, potentially leading to targets reaching the next resistance levels. In the event of a pullback, we can anticipate a bounce from the Bullish OB area, with confirmation ideally provided by a bullish candlestick pattern.
💎However, should panic selling occur and lead to a breakdown below the Bullish OB level, it would be prudent to exercise caution and wait for clearer price action signals before making any trading decisions.

DEEPAKFERT- Weekly AnalysisIn the Weekly Chart of DEEPAKFERT,
we can see that, it has spent time near support.
we might see a W shape recovery.
Possible momentums are shown in chart.

HINDALCO 1:5.5+ RR trade set up1. Trend bullish
2. Set up: Breakout & Retest
3. RR 1:5.5+ reversal trade set up
4. Double bottom at retest

LTC: Bulls Ready to Charge! Breakout Potential Ahead 💎 LTC is poised to break multiple resistance levels, including the resistive trendline and a significant resistance zone, while also forming a bullish W pattern. This confluence of factors suggests a potential bullish move for LTC.
💎 If LTCUSDT manages to break out above the resistance level, it could pave the way for further upward movement towards subsequent resistance levels. Conversely, in the event of a pullback in price, we can anticipate a bounce from the demand zone, providing support to the bullish momentum.
💎 However, should LTCUSDT break down below the demand zone, it would be prudent to exercise caution and refrain from trading LTC in that scenario. This breakdown would signal a potential shift in market sentiment towards bearishness, warranting a reassessment of trading strategies.

CRV:Bullish Breakout Potential! Keep an Eye on Resistance Levels💎 CRV is poised to break out of a resistance level, which would be considered bullish as it signifies a potential breakout of both a W pattern and a descending channel.
💎 If CRVUSDT successfully breach the resistance level, the next targets could be expected towards the subsequent resistance levels. In case of a pullback, a bounce from the demand area can be anticipated, especially if accompanied by proper bullish candlestick patterns within the demand zone.
💎 However, if CRVUSDT breaks down below the demand level, it would be advisable to exercise caution and consider ignoring it in that scenario. This decision is based on the premise that a breakdown below the demand level may indicate underlying weaknesses in the asset, potentially leading to further downward movement.

