As posted earlier 1:2 done As posted earlier i was sitting long in Btcusdt, 1:2 is done and i am out of the trade with 70% qunatity.
BINANCE:BTCUSDT
Like and follow for these types of trade ideas !!
And Join me with my journey so you can make yours 👍
Disclaimer: This is not financial advice. Please consult your financial advisor before making any investment decisions.
Double Top or Bottom

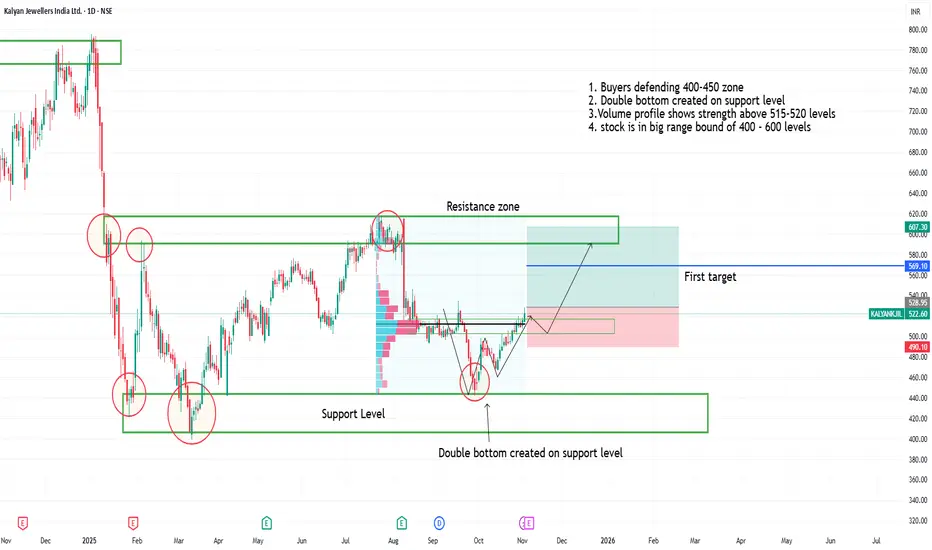
Double bottom in kalyan jwellers on support level1. Buyers defending 400-450 zone
2. Double bottom created on support level
3.Volume profile shows strength above 515-520 levels
4. stock is in big range bound of 400 - 600 levels
5. One can watch for upside movement
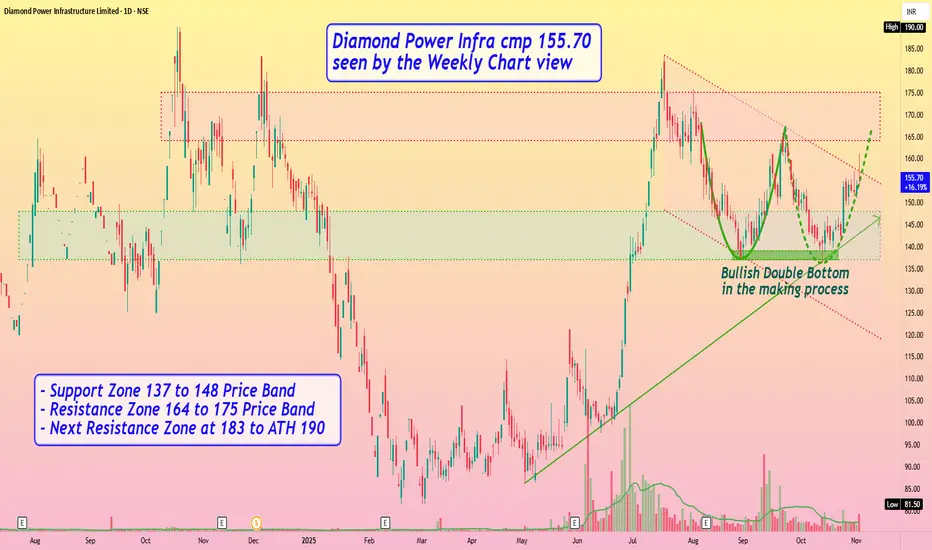
Diamond Power Infra cmp 155.70 seen by the Weekly Chart viewDiamond Power Infra cmp 155.70 seen by the Weekly Chart view
- Support Zone 137 to 148 Price Band
- Resistance Zone 164 to 175 Price Band
- Next Resistance Zone at 183 to ATH 190
- Bullish Double Bottom in the making process
- Rising Support Trendline seems well respected
- Volumes spiking regularly by close sync with avg traded qty
- Falling Price Channel Breakout seems to be in the making process
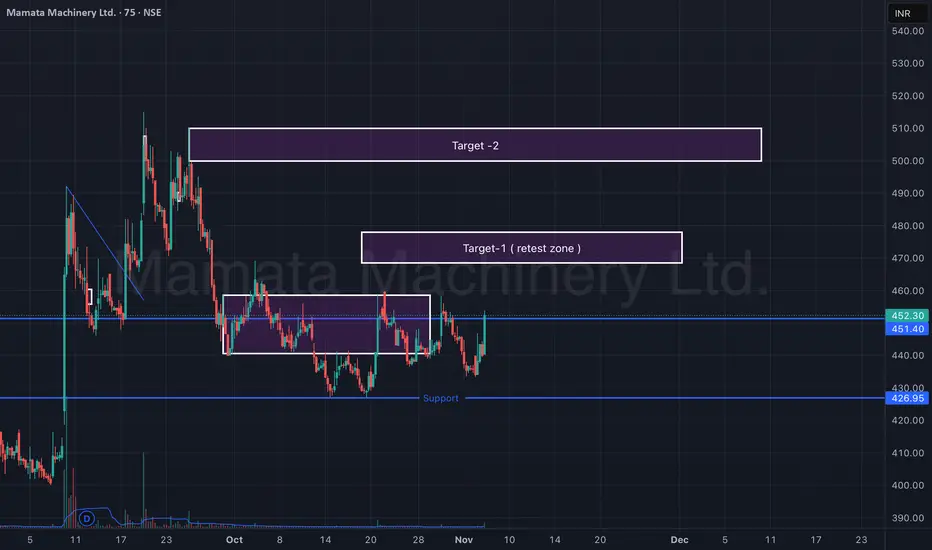
Mamata Machinery Ltd – Support Reversal & Retest Zone (75-min)Mamata Machinery is showing early signs of reversal from a strong support zone around ₹425–₹430. After forming a double-bottom-like structure, the stock has bounced sharply with rising volumes, indicating a possible short-term trend reversal.
Currently, price action is approaching a retest zone (Target-1) near ₹465–₹470. Sustaining above this level can open the path toward the next resistance cluster (Target-2) near ₹505–₹515.
🎯 Key Levels:
CMP: ₹452.30 (+3.81%)
Support Zone: ₹425 – ₹430
Target-1 (Retest Zone): ₹465 – ₹470
Target-2: ₹505 – ₹515
Stop-Loss: ₹425 (on 75-min close basis)
📊 Technical View:
Price rebounded from major support with visible volume spike.
Structure forming higher lows — early indication of momentum shift.
Short-term EMAs turning upward; potential crossover likely soon.
Sustained move above ₹470 can confirm breakout continuation toward ₹510+.
🧠 View:
Mamata Machinery has reversed from key support and is testing its retest zone. A breakout above ₹470 could trigger a short-term rally toward ₹510, while maintaining a stop-loss below ₹425.
Double bottom created at support levels in NMDC steel limited1. Double bottom created at support levels in NMDC steel limited
2. Trendline breakout in weekly chart
3. 1:4 RR trade
4. One can observe for upward movement

PROTEAN Cup & Handle with double bottom reversal set upProtean eGov Technologies Ltd (PROTEAN) is trading around ₹865 as of early November 2025, with the stock having a year high of ₹1,535 and a low near ₹716. The stock has declined roughly 35% over the last 6 months and about 42% year-on-year from its peak. Valuation metrics show a price-to-earnings (P/E) ratio near 37 and a price-to-book (P/B) ratio around 3.45, indicating a relatively high valuation considering recent price declines.
The company has zero debt, which strengthens its financial stability, but revenue growth has been weak with a recent contraction and modest sales increase in some quarters. Profitability margins remain moderate, and earnings per share (EPS) stood at around ₹23.3. Dividend yield is low at about 1.16%.
Technically, the stock is trading below its 200-day moving average (~₹1,053) and close to the 50-day average (~₹879), suggesting some near-term weakness. Support may be near the recent lows of ₹716, with resistance close to ₹900–₹950. Overall, Protean presents a cautious medium-term outlook, with fundamental strengths balanced by valuation and growth concerns.

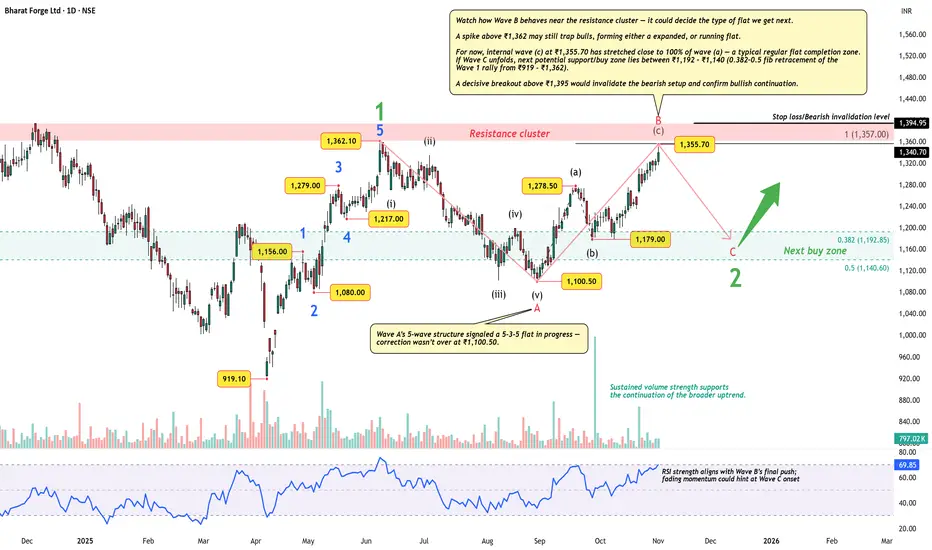
Bharat Forge Ltd – Flat in Formation, Bulls Still in Command
The impulse from ₹919 - ₹1,362 looks complete, and price is now likely carving a 5-3-5 flat correction as Wave 2.
Wave B has already stretched to the prior Wave 1 peak, keeping regular , expanded , and running flat options open.
Wave C could retrace toward ₹1,192 – ₹1,140 — the 0.382-0.5 fib zone — before the broader uptrend resumes.
Sustained volume and RSI momentum continue to support the larger bullish structure.
A breakout above ₹1,395 invalidates the bearish setup.
Disclaimer: This analysis is for educational purposes only and does not constitute investment advice. Please do your own research (DYOR) before making any trading decisions.
Precision Wires (M): Strongly Bullish (ATH Breakout)The stock has decisively broken out of a 10-month consolidation range, creating a new All-Time High (ATH) on exceptional volume. This signals the potential start of a new, major uptrend.
📈 1. The Long-Term Context
- Sideways Trend: The stock was in a prolonged sideways consolidation phase starting from January 2024.
- Volume Contraction: During this sideways period, volume was "drying up," which is a classic bullish sign of seller exhaustion and accumulation.
- The "Lid": This consolidation formed a strong horizontal resistance level that capped all rally attempts throughout the year.
🚀 2. The Decisive Breakout (The October 2025 Event)
In October, the stock broke this pattern with explosive force:
- Massive Surge: The stock surged 23.11% in a single move.
- Exceptional Volume: This surge was backed by massive, high-conviction volume of 24.51 Million shares, confirming strong institutional interest.
- ATH Achieved: This move pushed the stock to a new All-Time High and, most importantly, closed firmly above the horizontal resistance that defined the 2024 & 2025 trading range.
📊 3. Key Technical Indicators
The underlying momentum supports this bullish breakout:
- EMAs: Short-term Exponential Moving Averages are in a "PCO" (Price Crossover) state, signaling a new, strong bullish trend.
- RSI: The Relative Strength Index (RSI) is rising, indicating that buying momentum is strong and accelerating.
🎯 4. Future Scenarios & Key Levels to Watch
⚠️ A Note of Caution
While the breakout is clear, we need to be cautious. After such a sharp vertical move, a "pause" or "pullback" is healthy. The primary risk to monitor is potential bearish divergence
🐂 The Bullish Case (Breakout Continuation)
- Confirmation: The old resistance must now act as new support. As long as the stock holds above this breakout level, the trend is intact.
- Target 1:₹320
- Target 2:₹410 (if momentum continues)
🐻 The Bearish Case (Breakout Failure)
- Trigger: If the breakout fails, the stock will fall back below the old horizontal resistance level (the one it just broke).
- Confirmation: A high-volume move back into the old range.
- Target: This would signal a "fakeout" and could lead to a sharp decline to the nearest support ₹170 .

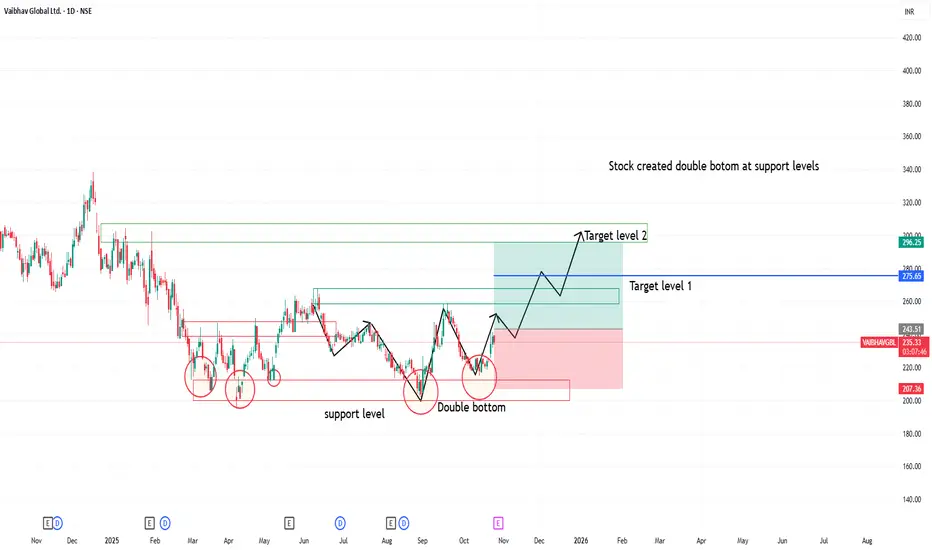
Vaibhav global created double bottom on support levelsStock created double bottom at support levels
good fundamental stock
good for long swing movement
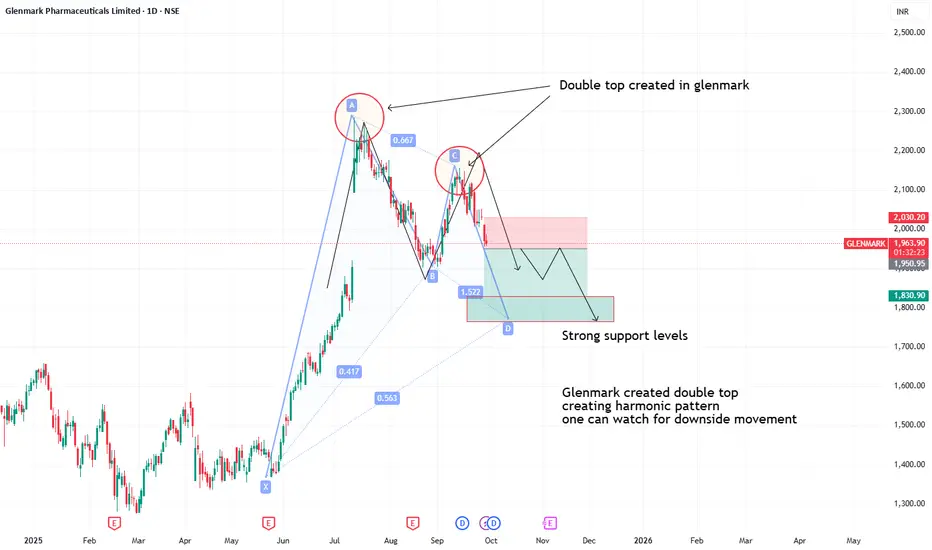
Double top formation seen in glenmark- Glenmark created double top
- creating harmonic pattern
- one can watch for downside movement
- stock may give big move downside if nifty continues to fall
Double bottom W pattern in LIC housing financeDouble bottom W pattern in LIC housing finance
may test its resistance zone
good for upside movement

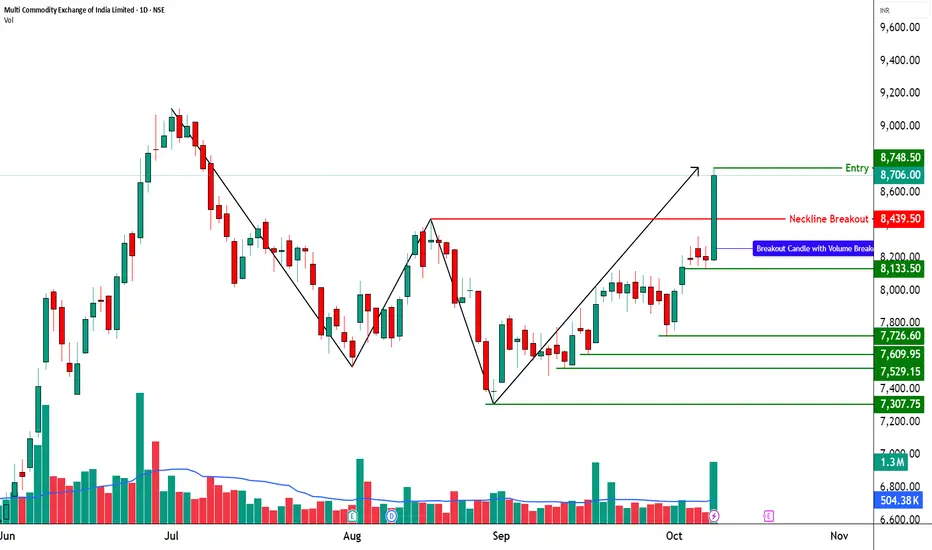
MCX - Bullish W-Pattern (Double Bottom Breakout)________________________________________
🚀 Multi Commodity Exchange of India Ltd (NSE: MCX) | Bullish W-Pattern (Double Bottom Breakout)
📊 Current Market Snapshot
CMP: ₹8,706.00
Sector: Financial Services / Commodity Exchange
Pattern Observed: 🟢 W-Pattern (Double Bottom Breakout)
Candlestick Signal: Strong Bullish Marubozu + Volume Breakout
Strength Rating: ⭐⭐⭐⭐☆ (High-Conviction Bullish Reversal)
________________________________________
🧭 Technical Indicators
The technical indicators on this chart are flashing strong bullish signals. Momentum is clearly positive, supported by a Bullish Marubozu candle, which reflects strong buying pressure and conviction. The chart also indicates a possible breakout formation, confirmed by a strong bullish candle backed by extremely high volume — a classic sign of institutional participation.
Multiple bullish confirmations like swing trade alignment, intraday signal, RSI breakout, and bullish engulfing pattern further add weight to the uptrend. The Bollinger Band breakout and Bullish VWAP suggest sustained price expansion, while the BB Squeeze-Off hints at volatility returning in favor of the bulls. Altogether, these indicators reinforce a buy-on-dip structure with potential for continuation toward higher resistance zones.
MCX is currently trading in the Progressive Zone, indicating a phase of steady upward momentum where buyers are actively accumulating positions. This zone reflects controlled bullish strength and sustained participation, suggesting that the stock is gearing up for a potential breakout continuation.
The KST (Know Sure Thing) indicator for MCX is in bullish territory, confirming the upward momentum seen in price action. With a strong positive crossover and supportive strength reading, the KST reinforces the ongoing uptrend — indicating that momentum remains firmly in favor of the bulls and the stock could continue its northward journey.
MCX is trading between its Swing High at ₹8,439.5 and Swing Low at ₹7,304. The Top Range near ₹9,115 acts as a major resistance zone, while the Bottom Range around ₹7,304 provides strong support, defining a clear bullish structure with room for further upside if momentum sustains.
________________________________________
📊 Trade Setup (Strong Momentum Entry)
Entry: ₹8,748.50
________________________________________
💡 Learning Note
This setup is a textbook example of a W-pattern (Double Bottom) breakout, where price reverses from a downtrend after forming two clear lows at similar levels. The neckline breakout with heavy volume confirms a shift in market sentiment from bearish to bullish. Such patterns highlight how volume expansion and strong breakout candles validate reversal strength and help traders identify early entry points in new uptrends.
________________________________________
⚠️ Disclosure & Disclaimer – Please Read Carefully
The information shared here is meant purely for learning and awareness. It is not a buy or sell recommendation and should not be taken as investment advice. I am not a SEBI-registered investment adviser, and all views expressed are based on personal study, chart patterns, and publicly available market data.
Position Status: No active position in MCX at the time of analysis.
Data Source: Past Chart reference(Historical levels)
Trading—whether in stocks or options—carries risk. Markets can move unexpectedly, and losses can sometimes exceed the money you have invested. Past performance or setups do not guarantee future results.
If you are a beginner, treat this as a learning guide and practice with paper trades before risking real money. If you are experienced, always assess your own risk, position sizing, and strategy suitability before entering trades.
Consult a SEBI-registered financial adviser before making any real trading decision. By engaging with this content, you acknowledge full responsibility for your trades and investments.
________________________________________
💬 Found this useful?
🔼 Give this post a Boost to help more traders discover clean, structured learning.
✍️ Drop your thoughts, questions, or setups in the comments — let’s grow together!
🔁 Share with fellow traders and beginners to spread awareness.
👉 “If you liked this breakdown, follow for more clean, structured setups with discipline at the core.”
🚀 Stay Calm. Stay Clean. Trade With Patience.
Trade Smart | Learn Zones | Be Self-Reliant 📊
________________________________________
Gold’s Double Trouble: Will the Bounce Hold or Break Below?#Gold hit a double top after a parabolic rally, topping at 4380.99 and 4381.44 , forming a classic M-pattern . Breakdown below 4185.91 confirmed the bearish structure, and price nearly completed the pattern target by testing the long-term ascending trendline , leading to a technical bounce.
👀 Now, all eyes are on the key zones:
🔸 Critical Resistance: 4185.91 – 4205.12
🔸 Critical Support: 3944.435 (green line)
📉 Break below the support (4HCB) could trigger further bearish continuation .
📈 Break above the resistance zone (4HCB) could open doors to retest All-Time Highs (ATH) .
🧭 These are your trend-deciding levels – stay sharp!
#XAUUSD | #Gold | # TVC:GOLD | #GoldAnalysis | #DoubleTop | #Mpattern | #ChartPatterns | #PriceAction | #TrendDeciderLevels | #KeyLevels | #BullVsBear
📌 Disclaimer: This analysis is shared for educational purposes only. It is not a buy/sell recommendation. Please do your own research before making any trading decisions.

Reliance eyes breakout as bulls return post earningsTopic Statement:
Reliance has gained bullish momentum following strong earnings and a market rally, now approaching a key resistance zone with breakout potential.
Key Points:
1. The stock is climbing toward a triple top formation, which carries a high probability of a bullish breakout
2. It is trading above both the 50-day and 200-day EMAs, indicating strength but also making it relatively expensive in the short term
3. Price continues to move comfortably within its established up-trending channel, maintaining a well-supported bullish structure

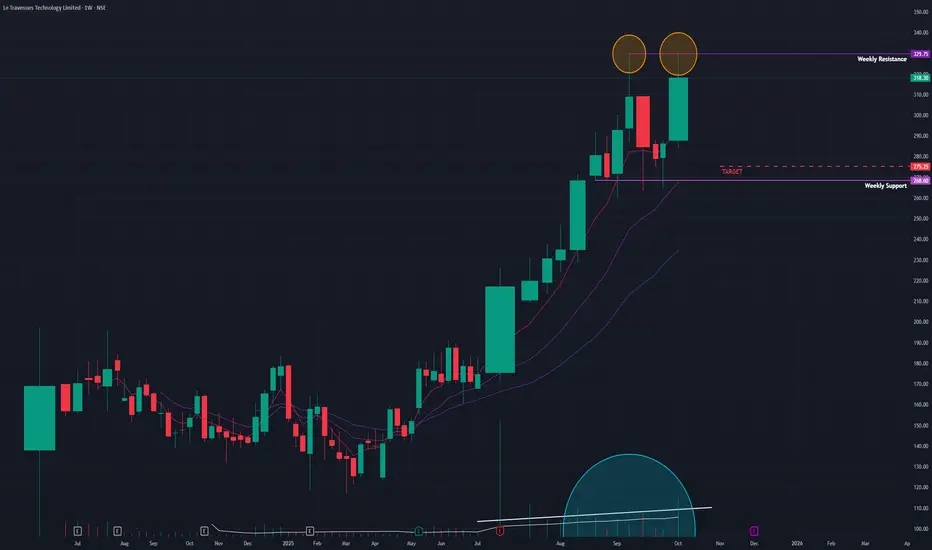
Ixigo (W) - At a Crossroad: Bullish Trend vs. Bearish PatternAfter a spectacular run-up, Ixigo (Le Travenues Technology Ltd) has entered a sideways consolidation phase. The current price action presents conflicting technical signals, placing the stock at a critical inflection point where it could either be pausing before another surge or forming a major top.
The Powerful Backdrop
Since April 2025, Ixigo has been in a powerful bull market, delivering an extraordinary gain of approximately 166% in just a few months. Following this rapid ascent, the stock's strong momentum has paused since August 2025, with the price now trading within a well-defined horizontal range.
The Current Dilemma: Two Competing Scenarios
The technical picture offers two distinct and competing interpretations:
1. The Bullish Case (A Healthy Consolidation):
This perspective views the current phase as a normal and healthy pause, where the stock is building energy for its next advance. This argument is supported by:
- Strong Underlying Momentum: Key indicators like the short-term Exponential Moving Averages (EMAs) remain in a bullish positive crossover state, and the Relative Strength Index (RSI) is still rising, suggesting the primary uptrend remains intact.
2. The Bearish Warning (A Potential Reversal):
Conversely, there are clear warning signs that the rally could be losing steam:
- Potential Double-Top: A Double-Top pattern , a classic bearish reversal signal, appears to be forming at the upper boundary of the trading range.
- Elevated Volume: Typically in a bullish consolidation, volume tends to decrease. However, volume has remained relatively high during this phase, which at a potential peak, can be a sign of distribution (selling) rather than accumulation.
Conclusion and Key Triggers to Watch
Ixigo is currently in a state of equilibrium, and a breakout from the current range is required for confirmation of the next directional move.
- Bullish Trigger: A decisive close above the range's resistance would invalidate the Double-Top pattern and signal a continuation of the uptrend. This would open a path towards the ₹380 level.
- Bearish Trigger: A decisive close below the range's support would confirm the Double-Top pattern, suggesting the bullish momentum has faded and a correction towards the ₹275 level could be imminent.
Until either of these levels is breached, patience is warranted. The direction of the break from this consolidation will be the key to identifying the stock's next major trend.
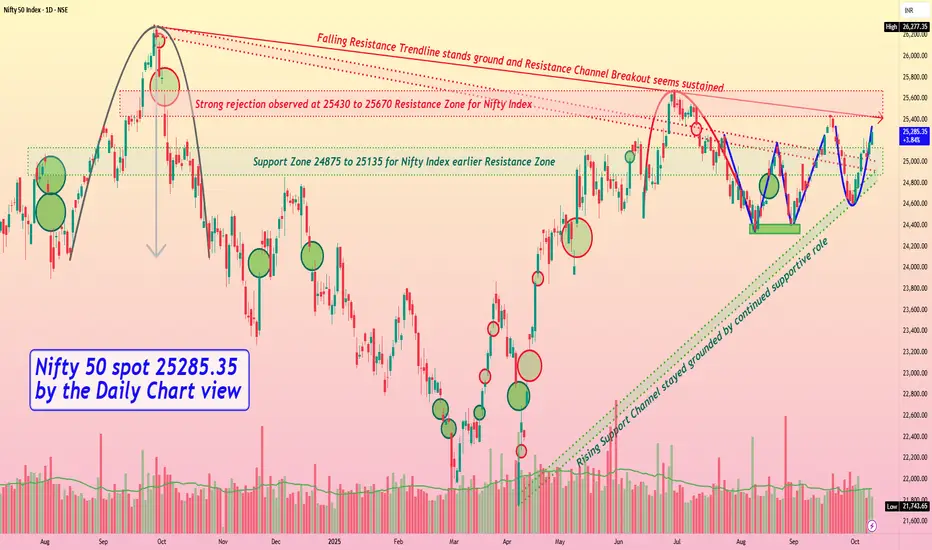
Nifty 50 spot 25285.35 by the Daily Chart view - Weekly updateNifty 50 spot 25285.35 by the Daily Chart view - Weekly update
- Support Zone 24875 to 25135 for Nifty Index earlier Resistance Zone
- Rising Support Channel stayed grounded by continued supportive role
- Strong rejection observed at 25430 to 25670 Resistance Zone for Nifty Index
- Falling Resistance Trendline stands ground and Resistance Channel Breakout seems sustained
- Bullish Technical patterns of "W" Double Bottom followed by Rounding Bottom formed around Support Zone
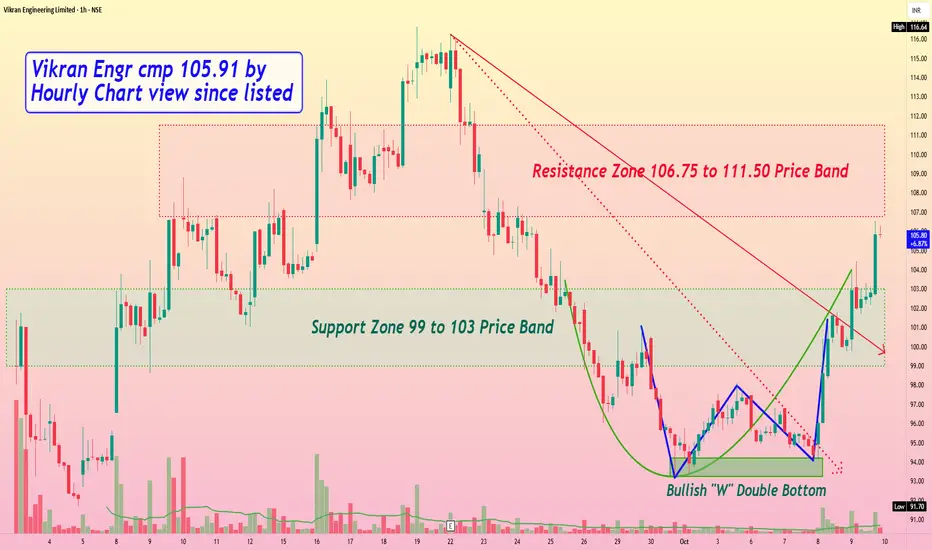
Vikran Engineering cmp 105.91 by Hourly Chart view since listedVikran Engineering cmp 105.91 by Hourly Chart view since listed
- Support Zone 99 to 103 Price Band
- Resistance Zone 106.75 to 111.50 Price Band
- Volumes are spiking well above avg traded quantity over past few days
- Subject to closure above Resistance Zone for few days, New ATH maybe anticipated
- Stock has formed bullish technical chart setup with Rounding Bottom and W Double Bottom
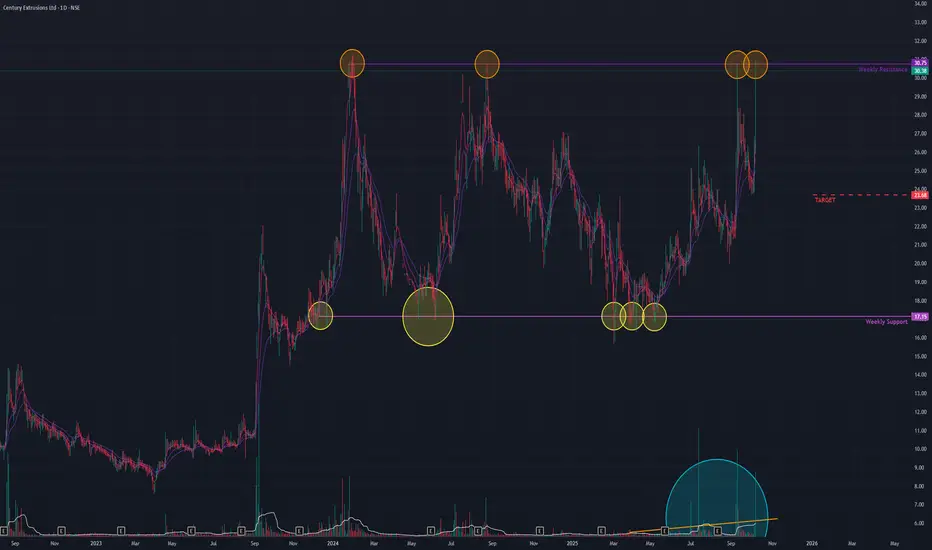
Century Extrusions (D) - Breakout or Fakeout?Century Extrusions has shown a significant sign of life after a prolonged period of sideways movement. However, a critical bearish indicator is flashing a warning sign, placing the stock at a crucial crossroads.
The Bullish Catalyst: A Powerful Surge
After a lackluster uptrend, the stock entered a consolidation phase in December 2023 , trading within a defined range. Today's session broke this monotony with authority:
- Massive Price Gain: The stock surged by +17.03% in a single session.
- Volume Spike: This price surge was backed by a significant spike in trading volume, indicating strong buyer participation.
- Resistance Retest: This move represents a serious attempt to break out of a persistent resistance trendline that has capped previous rallies.
Supporting this bullish action, key indicators are aligned positively across Monthly, Weekly, and Daily timeframes, with short-term Exponential Moving Averages (EMAs) in a positive crossover and the Relative Strength Index (RSI) showing rising momentum.
If the stock can successfully breach and sustain above the immediate resistance, the path could be clear for a move towards the ₹44 level.
The Bearish Warning: Waning Momentum
Despite the powerful price action, a significant red flag exists. A bearish divergence is clearly visible across the Monthly, Weekly, and Daily timeframes. This occurs when the price charts higher peaks while the RSI indicator forms lower peaks, suggesting that the underlying momentum is fading despite the price surge.
This divergence is a potent warning sign that the current breakout attempt may lack the strength to continue. If this signal proves true and the breakout fails, the stock could reverse course and decline towards the support level of ₹23 .
Conclusion and Outlook
The situation is a classic standoff between price action and momentum. The breakout is visually impressive, but the underlying bearish divergence cannot be ignored.
The price action over the next few trading sessions is critical for confirmation. A decisive close above the resistance would validate the bullish breakout, while failure to hold today's gains could confirm the bearish divergence, leading to a potential downturn. Prudent analysis requires waiting for the market to reveal its true direction.
Indraprastha Medical (D) - Bullish Breakout or Bearish Reversal?Indraprastha Medical Co. is at a critical juncture, presenting conflicting signals that warrant close attention. While the long-term trend remains bullish, emerging patterns suggest a potential reversal.
The Bullish Case: Strong Momentum
The stock has been in a consistent uptrend since July 2023, followed by a period of sideways consolidation that began in October 2024. Today's session was notably strong:
- New All-Time High: The stock registered a new all-time high, with the closing price being the same as the high of the day. This indicates intense buying pressure and an absence of selling at the peak.
- Massive Volume: The breakout was supported by exceptionally high trading volume, adding conviction to the upward move.
- Indicator Alignment: Key momentum indicators are bullish across multiple timeframes (Monthly, Weekly, and Daily). The short-term Exponential Moving Averages (EMAs) are in a positive crossover state, and the Relative Strength Index (RSI) is rising, confirming the underlying strength.
If this bullish momentum is sustained and the stock decisively breaks out from the current resistance zone, the next potential target is the ₹760 level.
The Bearish Counterargument: Divergence and Reversal Pattern
Despite the bullish price action, there are significant warning signs:
- Potential Double-Top: Today's new high has formed a potential Double-Top pattern on the Monthly, Weekly, and Daily charts. This is a classic bearish reversal pattern that can signal a market peak.
- Bearish Divergence: Crucially, this pattern is accompanied by a bearish divergence in the RSI. While the price made a new high, the RSI failed to do so, suggesting that the momentum behind the rally is weakening.
If the breakout fails and this bearish pattern plays out, the stock could see a significant correction, with a potential downside support level at ₹385 .
Conclusion and Outlook
The current technical landscape is ambiguous. We have a powerful breakout candle on high volume conflicting with a classic bearish reversal pattern and weakening momentum.
The immediate price action in the upcoming days is critical. Traders should wait for confirmation . A sustained move above today's high would validate the bullish case, while a failure to hold these levels and a subsequent breakdown would give credence to the bearish scenario.

Nifty 50 Daily, Trend Based Fibonacci Extension (Natural levels)Hey Traders, I hope you all are doing well in your life.
Market is nature's response and Price is the God.
Let's check the market with the help of natural levels tool : Trend Based Fibonacci Extension .
After forming a ' W ' pattern on Daily chart, Nifty50 has given a pull-back ( base for Fib-Extension level tool, 24587 ).
Most near level is the re-test of 38.2% level ( 24980 ), for a new UP trend ( investors ).
" Buy 🟢 " above 25110 with the stop loss 🔻 of 24980, for the
🎯 Target 1: 25402
🎯 Target 2: 25650
🎯 Target 3: 26260
🎯 Target 4: 26500.
" Sell 🔴 " below 24960 with the stop loss 🔺 of 25110, for the
🎯 Target 1: 24880
🎯 Target 2: 24780
🎯 Target 3: 24680
🎯 Target 4: 24500.
Smart Levels is Smart Trading. 👨🎓
⚠ RISK DISCLAIMER :
All content provided by "TradeWithKeshhav" is for information & educational purposes only.
It does not constitute any financial advice or a solicitation to buy or sell any securities of any type. All investments / trading involve risks. Past performance does not guarantee future results / returns.
Always do your own analysis before taking any trade.
Regards :
@TradeWithKeshhav & team
Happy Trading and Investing!

SBI Cards : Double Bottom Breakout Ignites Bullish MomentumSBI Cards and Payments has given a strong bullish breakout from a well-defined double bottom pattern on the daily chart, indicating bullish potential
The price has crossed above the neckline zone, confirming the breakout strength. The structure suggests that buyers have regained control, and momentum indicators are supporting further upside.
Currently, the stock is showing sustained strength above its short-term moving averages, and the breakout candle has closed decisively above resistance.
Based on the pattern height and measured move projection, the next potential target comes around the ₹904 price level. Any retest towards the neckline could offer a fresh buying opportunity with a favorable risk-reward setup.
Key Levels:
Support: 845
Resistance: 904
Trend Bias: Bullish above 840
Conclusion:
The technical breakout from the double bottom pattern points towards renewed upward momentum in SBI Cards. A sustained move above 860–870 can accelerate the rally towards the 904 zone in the short term.

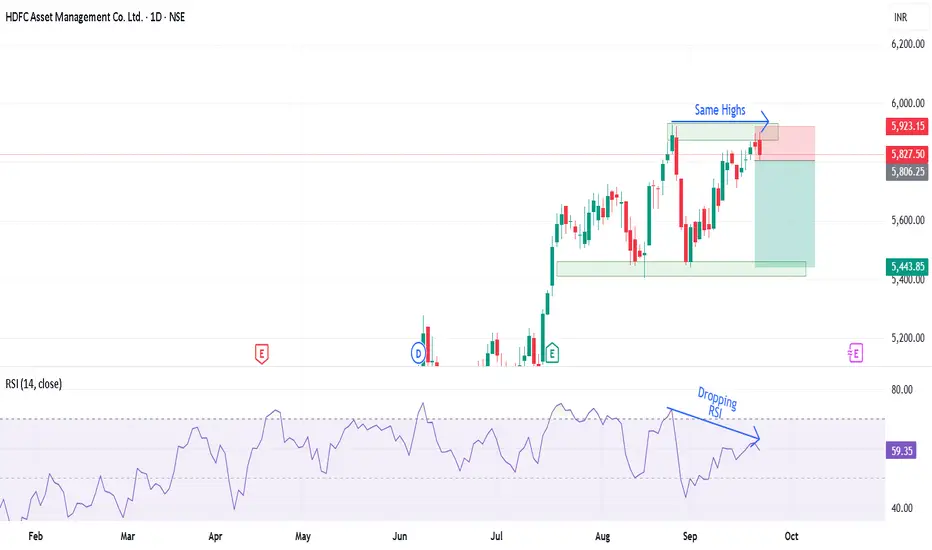
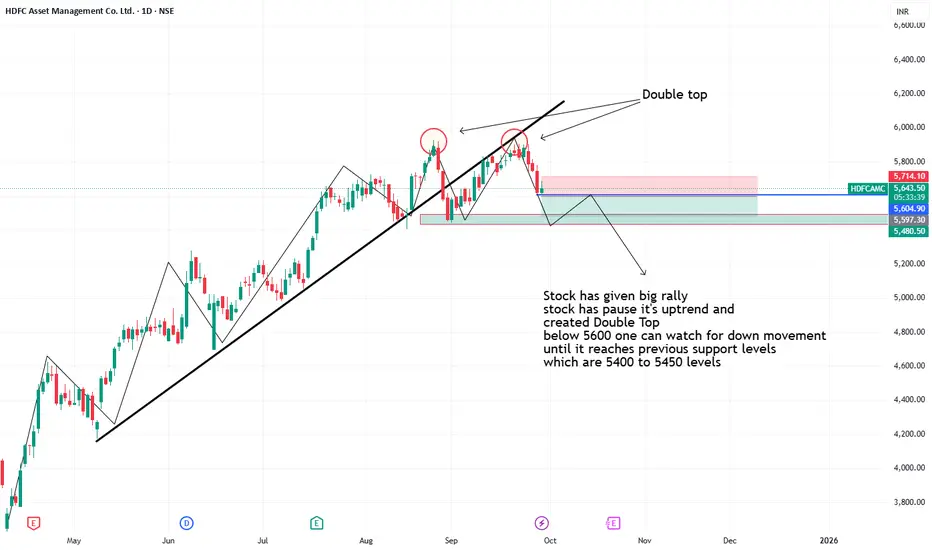
Hdfc created Double Top Formation- Stock has given big rally
- stock has pause it's uptrend and
created Double Top
- below 5600 one can watch for down movement
until it reaches previous support levels
which are 5400 to 5450 levels
Double Top at the Peak: Is a Bearish Reversal Coming in HDFC AMCHDFC AMC has given a good upside rally of 65% and is form a double top pattern.
The stock is following a bullish trendline but the RSI divergence is creating a bearish sentiment supported by the drop India VIX.
If the stock breaks below the trendline, a bearish trade can be entered with the first target of 5440 following it to 5208.
Bullishness will only be confirmed only once the stock starts trading above 6000 levels.
There is RSI divergence on the higher time frame too and gives more convincing trade in the stock.
Entry :- Below 5809
Target :- 5440 and 5208
Stop Loss :- Close above 5927 (daily charts)
Wait for the price action and trade accordingly.