Nifty Double bottom Nifty is being oversold and making a double bottom in 1 hr time frame. If it breaks the neckline that is the blue line as you can see in the chart, one may go for long with target 24950 with SL of 24650.
Disclaimer - This is just for educational purposes.
Jai Shree Ram.
Double Top or Bottom

Double Top in SilverEntry- 143000-143200
Target- 142000, 141500, 141200
SL- Day high
Pattern - Double Top has been made in MCX silver and Comex silver in 1 hr and 15 min time frame.
Disclaimer- This is just for educational purpose.
Jai Shree Ram.

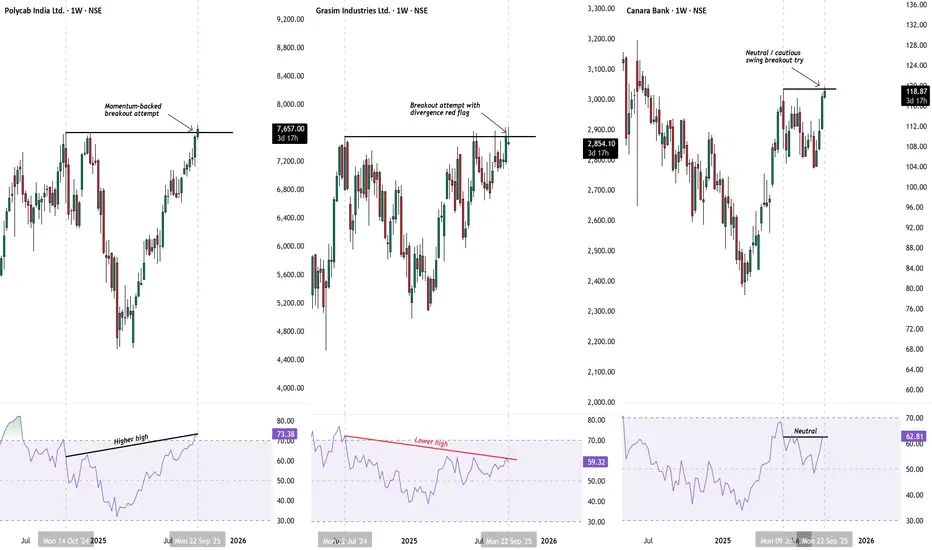
Breakout Attempts – Same Setup, Different StoriesSeveral stocks are attempting key breakouts on the weekly timeframe. At first glance, the charts look alike — price testing overhead resistance. But momentum (RSI) paints very different pictures.
Polycab India – Momentum-backed breakout
RSI makes a higher high, confirming strength behind the move.
Grasim Industries – Breakout with divergence risk
Price pushes higher, but RSI forms a lower high. A red flag for possible weakness.
Canara Bank – Cautious breakout attempt
Price tests the swing high, RSI is neutral with only a slight higher high. Momentum is less convincing.
Takeaway
Breakouts may look the same on price charts, but momentum helps separate strong moves from risky ones. A follow-up with Elliott Wave counts will be done once the structures mature further.
Disclaimer: This analysis is for educational purposes only and does not constitute investment advice. Please do your own research (DYOR) before making any trading decisions.
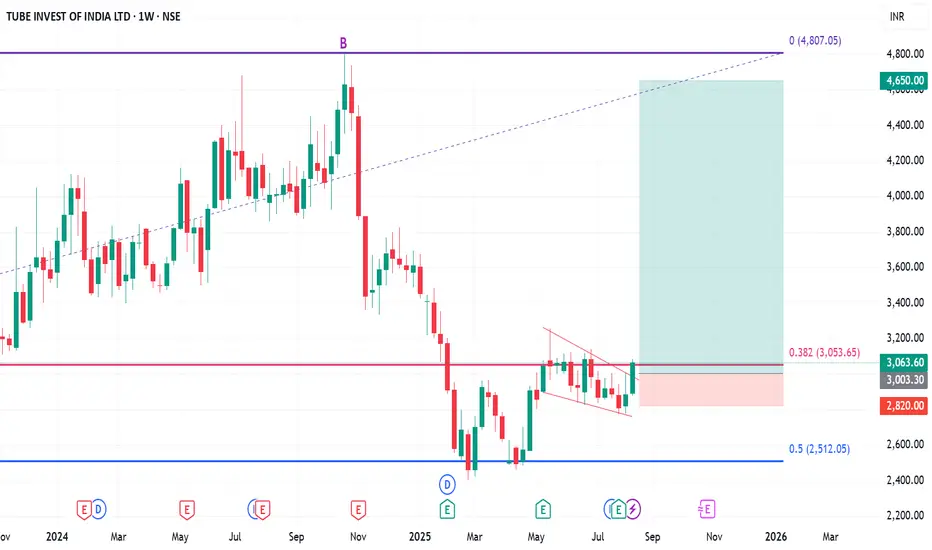
Positional or Long-term Opportunity in TIINDIAGo Long @ 3003.3 for Targets of 3330, 3830, and 4650 with SL 2820
Reasons to go Long :
1. On Weekly timeframe if we draw Fibonacci retracement from the all time swing low (A) to the all time swing high (B) then the stock took support from the 0.5 Fibonacci level.
2. In addition to this, the stock formed a Double Bottom Pattern (W) around 0.5 Fibonacci level.
3. After retracing the stock formed pole & flag pattern & gave breakout.
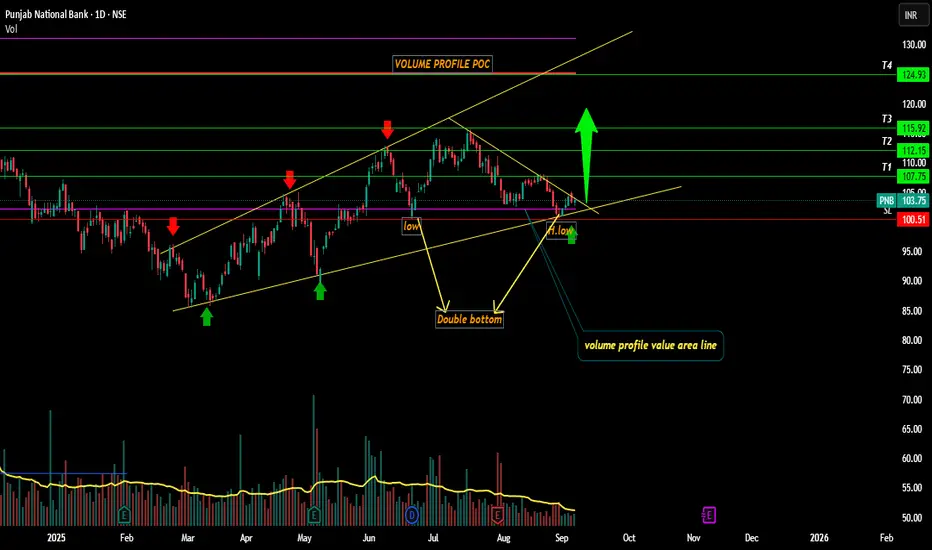
PNB looking Bullish ahead??!!Kindly check out the chart for the explanation.
Reasons-
1. Trendline Support
2. Double bottom
3. Fixed volume profile value area support
4. Low and lower low
5. PSU BANK index too looking bullish , check out idea below
Close below 100.52 - invalidation level
Targets mentioned @ chart.
Just my view ...not a tip nor advice!!!!
Thank you!!!
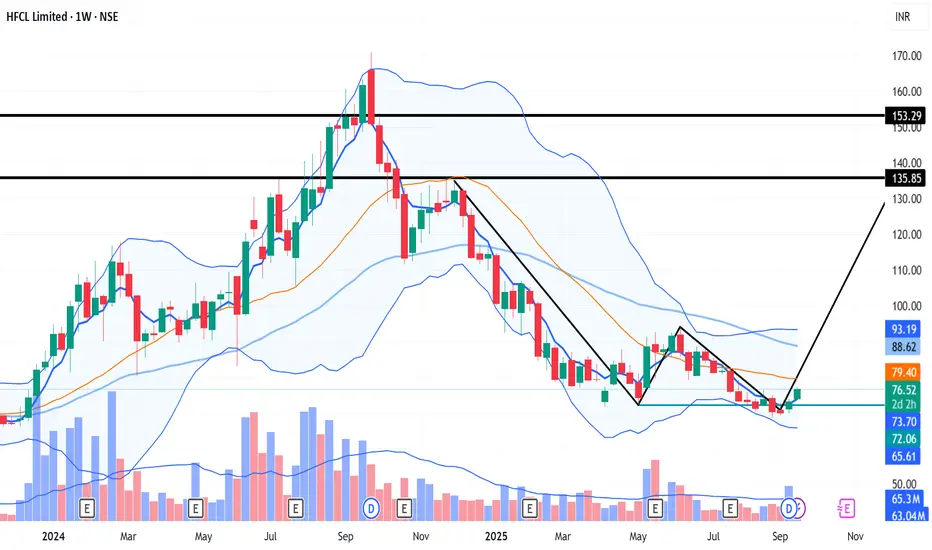
Double bottom Fake BreakdownMy view on HFCL is a Double bottom fake breakdown.
Divergence in MACD and RSI on Weekly TF.
Bullish RD on Monthly TF.
Price closed above 50EMA on the Daily TF.
Maruti Suzuki . Multi time frame analysisThe price is forming a very narrow range consolidation between 15300 and 15360 in the one-hour time frame. The price can give a breakout from here or test the trend line before moving up.
In the daily time frame, we can see double top resistance around the 15370 and 15388 zones.
Using this analysis, when we look at the 15-minute chart, safe entry will be when the price sustains above the double top or during a pullback when the price takes support around 15200.
Scenario 1: Buy above 15390 with the stop loss of 15330 for the targets 15440, 15490, 15540, 15590, and 15660.
Scenario 2: Buy above 15200 with the stop loss of 15140 for the targets 15260, 15320, 15380, 15440, and so on.
Always do your analysis before taking any trade.

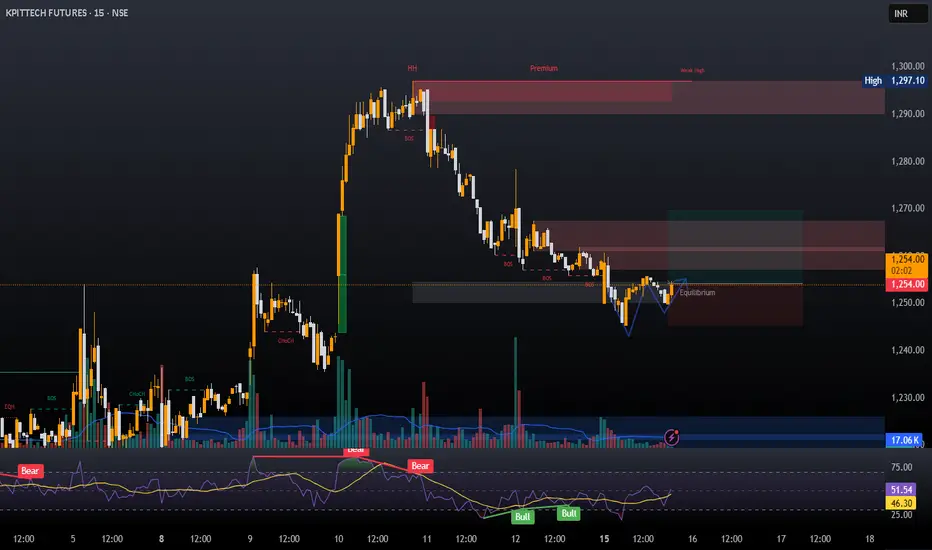
LONG IN KPITTECHA long trade can be taken in KPIT TECH. After a bullish run last week Kpit tech showed some profit booking but couldn't break the low of the candle from where it started its bullish reversal. Now it has formed a double bottom and hence a swing trade on the buy side can be taken.
Follow for more such analysis.
Entry- 1250-1254
Support- 1245-1242
Target- 1270, 1275, 1290
Disclaimer- This is just for educational purposes.
Jai Shree Ram
Stock-wise Investigation: Breakouts or Support? ( MTF )Using 3-month-old chart data, this video explores how stocks tend to favor breakouts or support zones, with key technical terms to sharpen your pattern recognition skills—purely educational in nature.

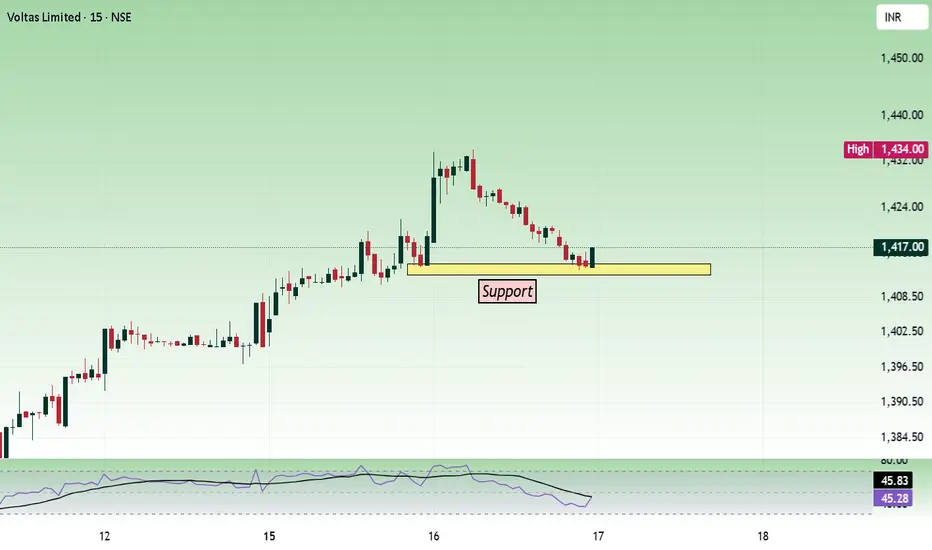
VoltasPrice is facing double top resistance at the 1434 - 1438 zone and had a pullback towards the 1410 zone. Nearby strong support is at 1400.
1400 and 1412 are buying(support) levels. Buy can be initiated depending on the price movement at these levels.
Buy above 1412 with the stop loss of 1400 for the targets 1422, 1430, 1442, 1454, and 1466.
If the price opens below 1410 and moves towards 1400, we can buy when the price shows bullish strength above 1400.
Price is bearish below 1400. Sell below 1395 with the stop loss of 1405 for the targets 1386, 1374, and 1362.
Kotak Swing Idea (Long)Kotak might move upside due to following logical reason:
1) Inside/doji candle on daily candle (trend reverse)
2)Trading above 20 EMA in 1 hr to 4 hr chart (Support)
3)GAP cover pending
4)Swing Low formation is shifting up
5)Consolidation from last 1.5 months
(Note: Author not responsible for anyone profits or loss, nor a sebi registered RA. Please do your own due diligence before taking any trades. For educational purpose only)

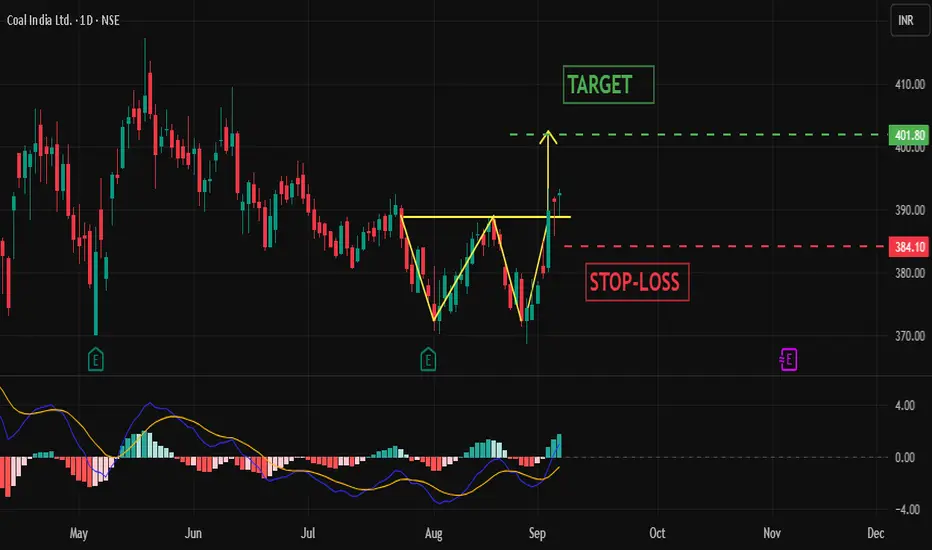
COALINDIA – Double Bottom Breakout with MACD Strength!📊 Pattern & Explanation
COALINDIA has formed a double bottom pattern, which looks like a “W” on the chart. This occurs when price tests the same support level twice and holds strongly. It signals that buyers are defending that zone. Once the neckline (resistance above the bottoms) is crossed with momentum, it often leads to a strong upward move.
📈 Key Levels
Target: 402 – calculated from the breakout projection.
Stoploss: 384 – to limit downside risk.
📊 MACD Crossover
The MACD (Moving Average Convergence Divergence) is a momentum indicator. A positive crossover happens when the MACD line moves above the signal line, showing fresh buying strength and supporting the bullish breakout setup in COALINDIA.
💡 Why This Setup Matters
This setup combines price action (double bottom breakout) with momentum confirmation (positive MACD crossover). When support holds twice and momentum shifts upward, the chances of a sustained rally improve. Traders can use this confluence to trade with higher confidence, while managing risk with a clear target and stoploss.
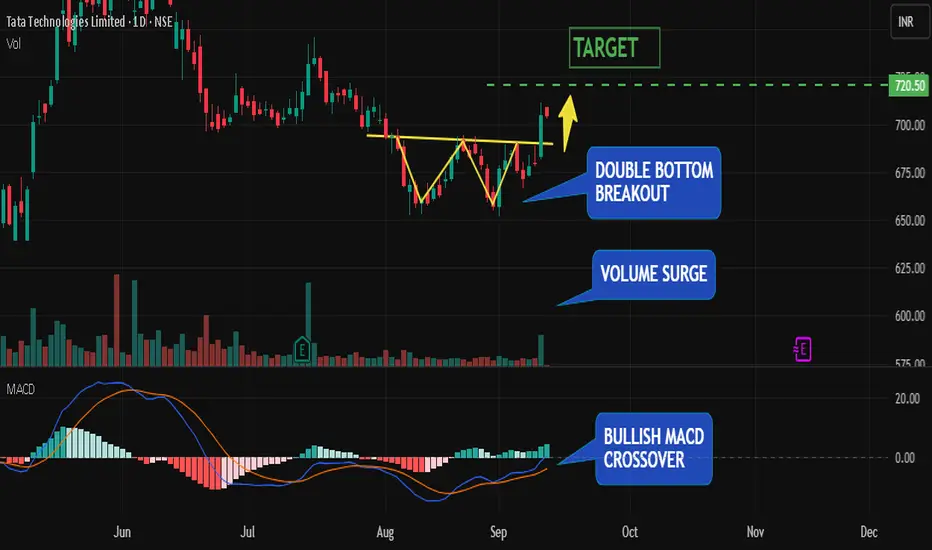
Tata Technologies Double-Bottom Breakout | Target ₹720The stock has recently completed a double-bottom reversal pattern . A double bottom is one of the most reliable bullish reversal setups, often described as a “W-shaped” formation. It occurs when price tests the same support level twice, with sellers unable to push lower both times. This repeated defense by buyers signals demand at those levels and exhaustion of selling pressure.
Once price broke above the neckline (the midpoint of the “W”), the pattern was confirmed, suggesting that buyers are regaining control and an uptrend may be unfolding.
But what makes this breakout even stronger is the confluence of technical signals:
Bullish MACD Crossover : The MACD line has crossed above the signal line, shifting momentum to the upside. This indicates that bullish momentum is not only present but accelerating.
Volume Surge : Breakouts accompanied by rising volume are considered stronger and more reliable. In this case, the surge in volume confirms that institutions and larger players are participating in the move, adding credibility to the breakout.
Together, these signals create a powerful alignment of pattern, momentum, and participation.
Trade Plan :
Entry : On breakout above neckline or on a healthy retest of the neckline as support.
Target : ₹720, calculated as the measured move objective from the double bottom formation.
Risk Management : Always size positions carefully. Risking only 1–2% of capital per trade ensures you can survive a string of losses and stay in the game long-term.
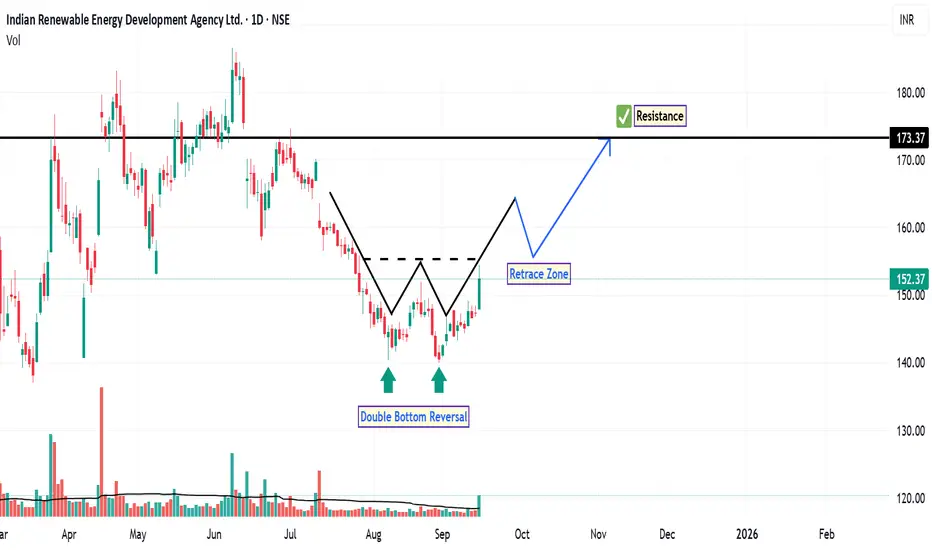
IREDA: Double Bottom in PlayOn the daily time frame, the chart of IREDA has recently displayed a double bottom reversal pattern , a classic technical formation often associated with a potential shift from bearish to bullish sentiment. This pattern, marked clearly on the chart, suggests that buyers may be stepping in at a previously defended price level.
In the preceding downtrend, the stock failed to establish a new low and instead broke above a prior swing high, indicating a CHoCH in market structure. This shift is typically interpreted by technical analysts as a transition from bearish to bullish momentum.
The RSI is currently above 60 , approaching the overbought zone. While this suggests strong buying interest, it also warrants caution as price may be nearing short-term exhaustion. However, in trending markets, RSI can remain elevated for extended periods. Additionally, the stock has managed to close above both the 20-day and 50-day EMAs, accompanied by increased volume, which adds credibility to the bullish setup. These moving averages often act as dynamic support levels and trend confirmation tools.
Based on this technical structure, the next potential resistance levels are identified near ₹160, followed by ₹173 . A technical stop-loss level could be considered at a daily close below ₹140 , which aligns with the double bottom support zone.
Disclaimer: This analysis is intended solely for educational and informational purposes. It does not constitute investment advice or a recommendation to buy, sell, or hold any financial instrument. Market conditions are subject to change, and trading decisions should be made based on individual research, risk tolerance, and consultation with a licensed financial advisor.
Nifty 50 – Bearish Engulfing at 25,150, Eyes on FedNifty rallied into the 25,150 zone and immediately met resistance. The daily chart printed a bearish engulfing candle , a textbook reversal signal after a short-term rally. From a pure price-action perspective, this suggests caution as bulls lose momentum at a key supply zone.
However, context matters. The Fed interest rate decision on 17th Sep night is the big catalyst ahead. Until then, markets may prefer to stay rangebound rather than commit to a direction.
Derivatives data backs this:
Heavy Call OI at 25,100–25,200 creates resistance.
Strong Put OI at 25,000 provides support.
With PCR near 1.0, the bias leans neutral-to-cautious.
In short: the bearish engulfing is valid, but expiry flows (16th Sep) and the Fed decision (17th Sep night) will decide whether this turns into a deeper pullback or gets invalidated by a breakout.

INDUS TOWER broke out of Double Bottom - Bullish DOUBLE BOTTOM breakout -
indus tower has recently broken out of double bottom. A double bottom is formed when 2 consecutive troughs are formed and the neckline is at the same level as the joining line of the 2 troughs. price has broken out of this neckline indicating strong upward potential
BOLLINGER BAND SQUEEZE Breakout -
price has recently broken out of a perfect bollinger band squeeze indicating strong upward momentum for the stock. A squeeze is formed when the upper band and lower band of bollinger band comes very close to each other and breaks out of it in either direction
TARGET -
price is expected to reach 382
STOPLOSS -
if price closes below the neckline then exit the position

SBICARD at Key Level: Watch ₹780 Support, ₹830 BreakoutSBICARD is currently displaying a double bottom pattern on the daily chart — a bullish reversal setup that typically forms after a downtrend. This pattern signals that the stock is attempting to establish a strong base and could be preparing for an upward move.
⚖️ Key Levels to Watch
Support Zone: As long as SBICARD holds above ₹780, the structure remains strong and the pattern is valid. A breakdown below this level could weaken the setup.
Breakout Confirmation: A closing above ₹830 will serve as bullish confirmation of the double bottom breakout.
Upside Targets: Once confirmed, the stock has potential to rally toward ₹860–880 levels in the short term.
✅ Summary
In short, SBICARD is in a consolidation phase, attempting to break out from a double bottom. Holding above ₹780 keeps the bullish bias intact, while a breakout above ₹830 can trigger the next leg higher.

Bajaj Finserv – Double Bottom Breakout Hits 2082!Bajaj Finserv recently broke out of a double bottom pattern , confirming strong bullish momentum. After the breakout, price action swiftly reached the target of 2082 , validating the pattern’s strength.
Adding to the bullish sentiment, the stock also achieved a breakout above 50D SMA and 100D SMA , showing renewed medium-term momentum and strong follow-through buying.
This breakout above critical levels suggests that the trend is gaining strength. Sustaining above these moving averages could attract further momentum traders and long-term investors.
📊 Key Highlights:
Breakout from double bottom pattern ✅
Target of 2082 achieved 🎯
50D SMA & 100D SMA breakout 🔑

Mazagon Dock – Breakout Victory: Target Achieved at 2925!Mazagon Dock recently delivered a strong breakout from a descending wedge pattern , signaling a shift in momentum. After the breakout, price action surged and successfully reached the target of 2925 .
Interestingly, the stock also took a reversal from the 200D SMA , which acted as a major resistance zone . This confluence of technical factors highlights the importance of moving averages in identifying key turning points.
Currently, traders should watch how the price reacts around this zone. A sustained move above 200D SMA may open the doors for further upside, while rejection could trigger some healthy consolidation.
📊 Key Takeaways:
Breakout from descending wedge pattern ✅
Target of 2925 achieved 🎯
200D SMA acted as resistance 🔑

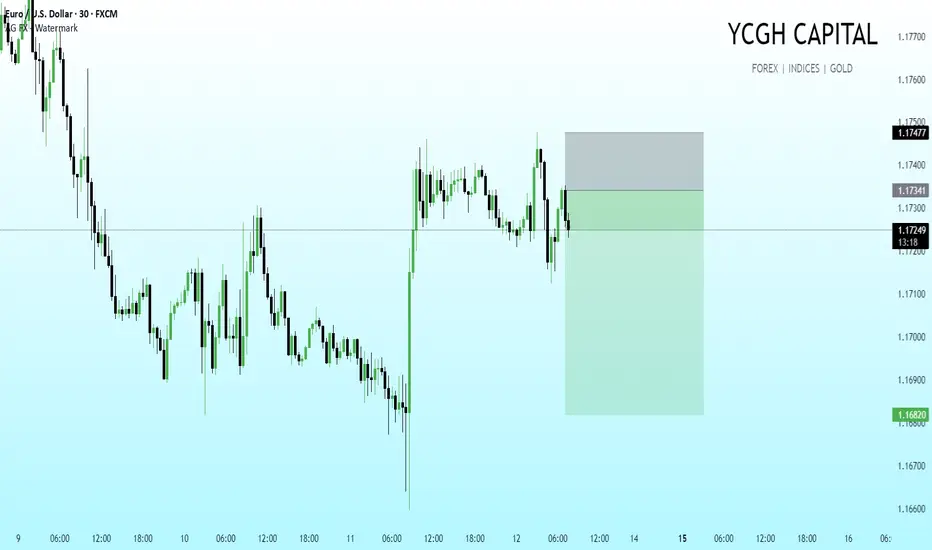
EUR/USD | 30M | Live Execution Zone
We’ve marked out our trade zone post-CPI. Price tapped into our supply pocket at 1.1747 and is now reacting as anticipated. Position structured with:
Entry at the rejection from supply
Stop above the sweep zone
Target the lower liquidity pool near 1.1680
Key narrative: Market took out liquidity on both sides, confirmed displacement, and is now showing signs of delivering south before the next structural shift.
This is a clean setup aligning with the higher-timeframe bias — patience and discipline doing the work.
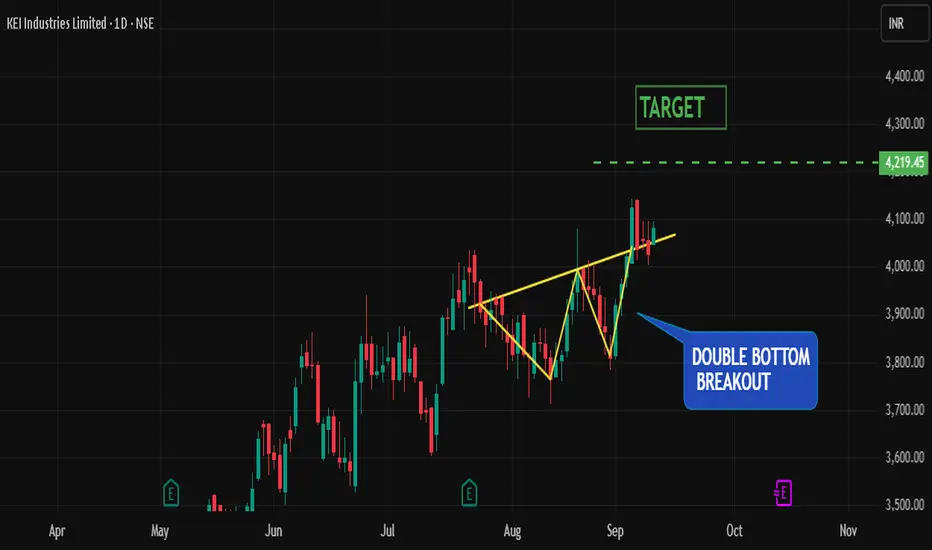
Double-Bottom Breakout → Bulls in Control | Target ₹4219The stock has recently completed a double-bottom reversal pattern . A double bottom forms when price tests the same support level twice and fails to break lower, creating a “W-shaped” structure. This indicates that sellers tried twice to push the stock lower but were unable to, while buyers stepped in to defend the level. Once price breaks above the neckline (the midpoint of the “W”), the pattern is confirmed, often signaling the start of a bullish trend.
Adding further strength to this setup, price is holding firmly above the 50D, 100D, and 200D SMA . Here’s why this matters:
50-Day SMA : Represents short-term trend. Interestingly, the stock has now tested the 50D SMA thrice and held each time , showing strong buyer interest and reinforcing bullish momentum.
100-Day SMA : Reflects medium-term structure; price above this confirms that buyers dominate the broader swing.
200-Day SMA : The long-term benchmark; trading above this signals the stock is firmly in an uptrend.
When price stays above all three moving averages, it shows alignment across short, medium, and long-term trends — a powerful confirmation that bulls are in control.
Trade Plan :
Entry : On breakout above neckline or on a pullback retest of neckline as support.
Target : ₹4219 (measured move objective from the double bottom pattern).
Risk Management : Stick to disciplined sizing; risk no more than 1–2% of trading capital.
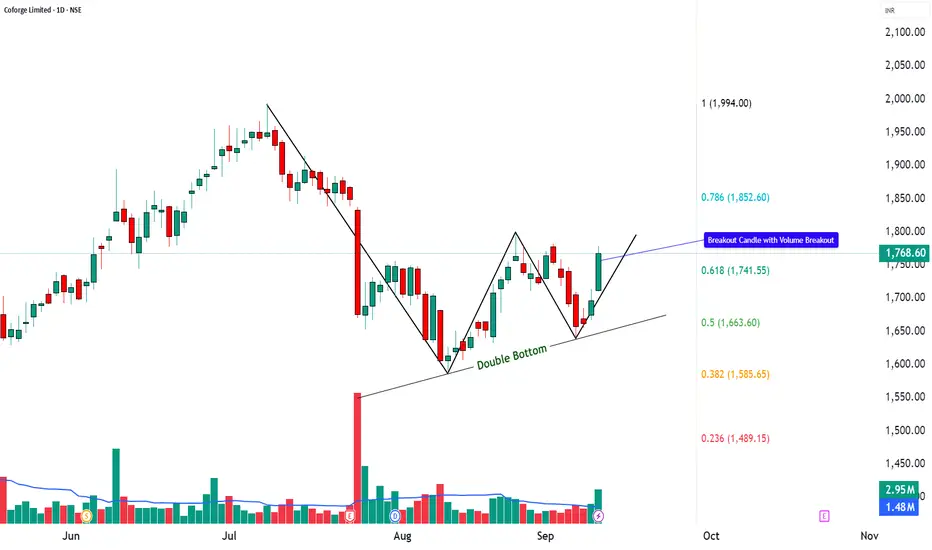
Coforge | Double Bottom Reversal with RSI + MACD Breakout📌 Coforge Ltd. – Closing Price: ₹1,768.60
📊 Technical Indicators Explained
Coforge is showing strong technical signals. A Double Bottom pattern 📉➡️📈 suggests a possible bullish reversal, while a strong bullish candle 🔥 confirms momentum. The RSI breakout ⚡, MACD crossover 📊, and volume surge 🚀 all indicate growing trader participation. With supports holding firm and resistances nearby, the stock is entering a decisive zone.
________________________________________
📈 Bullish Case – Why the stock could go up
Double Bottom signals potential trend reversal.
Strong bullish candle with volume validates buying interest.
RSI breakout + MACD crossover = bullish confirmation.
Fibonacci retracement levels open upside zones towards ₹1,852 – ₹1,994+.
📉 Bearish Case – Potential downside risks
If price fails to sustain above ₹1,726, weakness may return.
Broader market corrections could weigh on momentum.
A breakdown below ₹1,657 would weaken the bullish outlook.
⚡ Momentum Case – Short-term Trading Edge
Strong bullish candle + RSI breakout = near-term strength.
Sustaining above ₹1,780–₹1,800 could push towards higher Fibonacci levels.
Heavy volume indicates short-term traders are active.
📊 Support & Resistance Levels
Support Zones: ₹1,657 | ₹1,683.67 | ₹1,726.13
Resistance Zones: ₹1,794.93 | ₹1,821.27 | ₹1,863.73
📅 Short-term vs. Long-term Perspective
Short-term: Stock may test resistance levels between ₹1,795 – ₹1,860 if momentum sustains.
Long-term: Formation of a double bottom indicates potential for a structural trend reversal if higher levels hold.
✅ Conclusion: Coforge is showing a technical reversal pattern with strong momentum signals.
👉 The stock is at a key breakout zone — short-term traders may track resistances closely, while long-term investors can monitor the double bottom for confirmation of sustained trend change.
⚠️ Disclaimer – Please Read Carefully
The information shared here is meant purely for learning and awareness. It is not a buy or sell recommendation and should not be taken as investment advice. I am not a SEBI-registered investment advisor, and all views expressed are based on personal study, chart patterns, and publicly available market data.
Trading — whether in stocks or options — carries risk. Markets can move unexpectedly, and losses can sometimes exceed the money you have invested. Past performance or past setups do not guarantee future results.
If you are a beginner, treat this as a guide to understand how the market works — practice on paper trades before risking real money. If you are experienced, always assess your own risk, position sizing, and strategy suitability before entering trades.
Consult a SEBI-registered financial advisor before making any real trading decision. By engaging with this content, you acknowledge full responsibility for your trades and investments.
💬 Found this useful?
🔼 Give this post a Boost to help more traders discover clean, structured learning.
✍️ Drop your thoughts, questions, or setups in the comments — let’s grow together!
🔁 Share with fellow traders and beginners to spread awareness.
👉 “If you liked this breakdown, follow for more clean, structured setups with discipline at the core.”
🚀 Stay Calm. Stay Clean. Trade With Patience.
Trade Smart | Learn Zones | Be Self-Reliant 📊
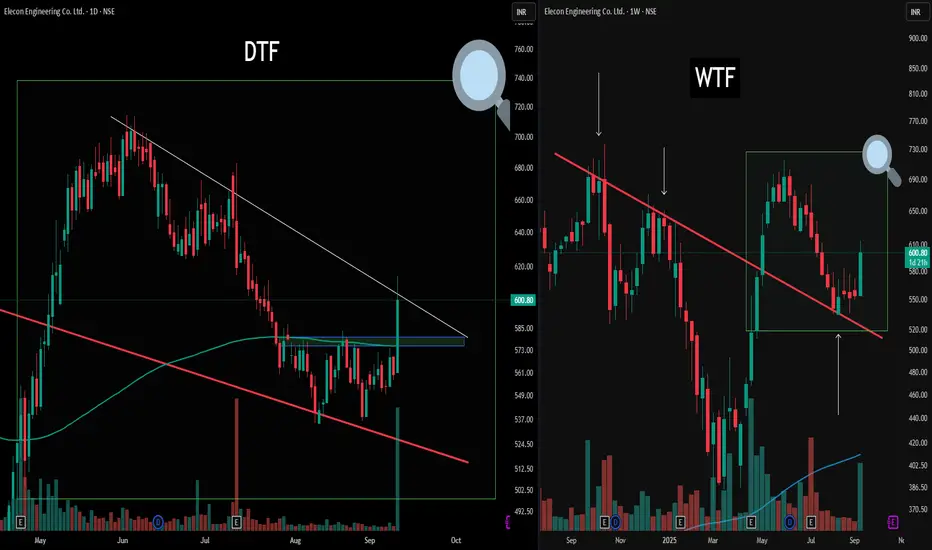
Unlocking Structure: Multi-Timeframe Mapping Today’s chart highlights the value of multi-timeframe analysis for structured observation.
On the right (WTF), the weekly perspective provides a broad structure, showcasing a clean counter trendline and its reaction zone. A green box and magnifier zoom into this region, framing the context for the daily (DTF) chart on the left.
On the DTF view, the same zone is explored in detail. Here, there's an active counter trendline (white) and a pronounced double bottom formation resting on a blue Flip zone—noted for educational reference rather than outcome prediction. Both timeframes display how structural overlaps and retests can be identified, serving as useful pattern recognition and risk management.
Disclaimer: Trading involves significant risk and is not suitable for all investors. Past performance does not guarantee future results. Always conduct your own research, consider seeking advice from a qualified financial advisor, and trade only with capital you can afford to lose.