Motherson Sumi Wiring - Double Bottom & Head & Shoulder PatternMotherson Sumi Wiring is looking for a 50% jump from current price. Following are the factors:
Technical Analysis:
1. On weekly time frame, it is making a Double Bottom Pattern
2. On Weekly time frame it is making a Head & Shoulder Pattern
3. A confluence point along with strong weekly candle will take this price upwards
Fundamental Analysis:
1. Strong player in harness wiring
2. Supplying in top 10 automobile models - auto sector is in strong uptrend
3. New factories - Haryana, Pune and Gujarat - already clocked 200cr from these green field projects
A must in your portfolio.
Keep following @Cleaneasycharts as we provide "Right Stocks at Right Time at Right Price"
Cheers!!
Double Top or Bottom

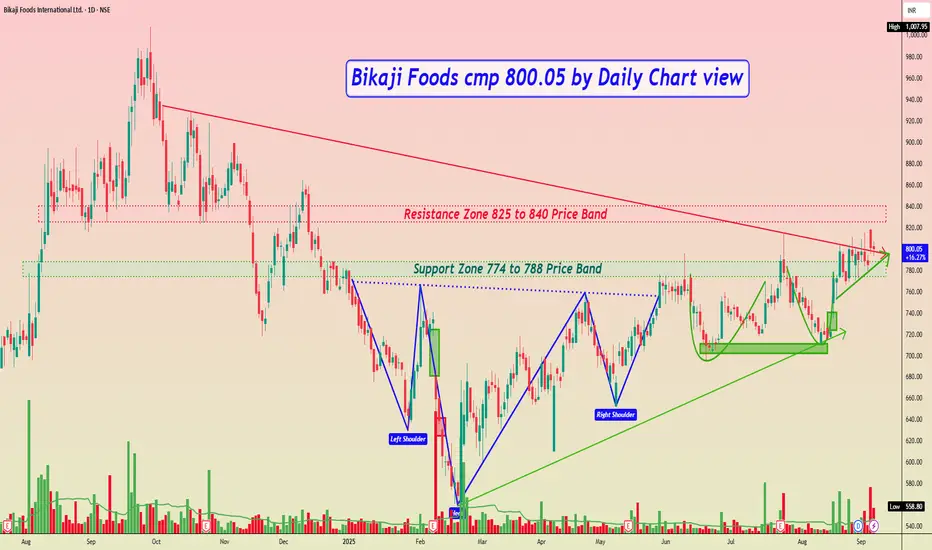
Bikaji Foods cmp 800.05 by Daily Chart viewBikaji Foods cmp 800.05 by Daily Chart view
- Support Zone 774 to 788 Price Band
- Resistance Zone 825 to 840 Price Band
- Pretty closely considerate Bullish Double Bottom formed
- Support Zone seems like going thru testing retesting mode
- Falling Resistance Trendline Breakout seems been attempted
- Price momentum seem respecting the Rising Support Trendlines
- Bullish Rounding Bottoms with Head & Shoulders below Support Zone
- Price Breakout will sustain after closure above Resistance Zone for few days
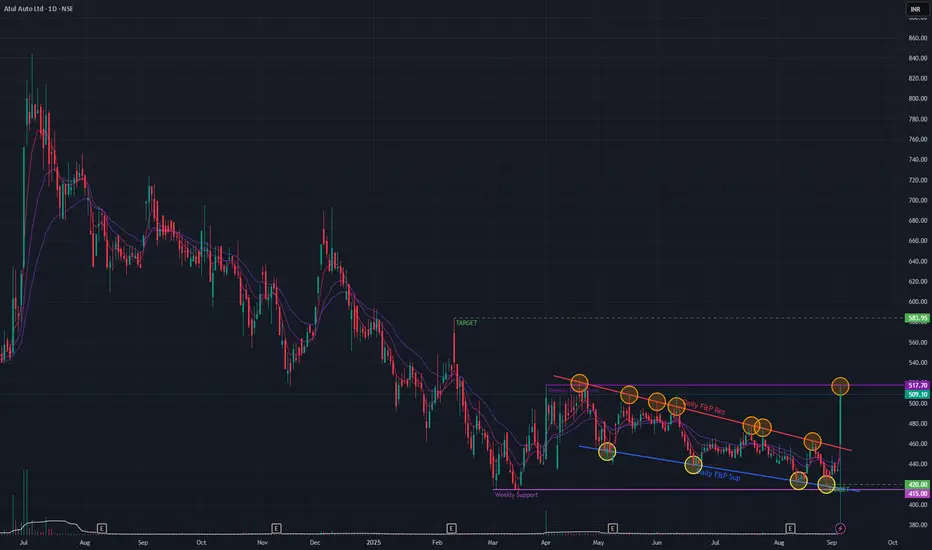
Atul Auto (Daily Timeframe) - Is it the Bullish reversal ??Atul Auto has been in a downtrend since the All Time High. Resistance & Support trendlines in the recent past has been respected well as marked. Today the stock BrokeOut of the angular trendline with a 17% spike and huge volume spurt. Currently the stock is encountering a key resistance.
Overall the stock is in a downtrend but a bullish divergence can be seen along with short-term EMAs in positive cross-over state. Till further positive price action, a bullish trend may not be foreseen.
If the stock moves in an uptrend then we might see the levels of 583 & in case of a downtrend we might see the levels of 420.
Keep monitoring!!
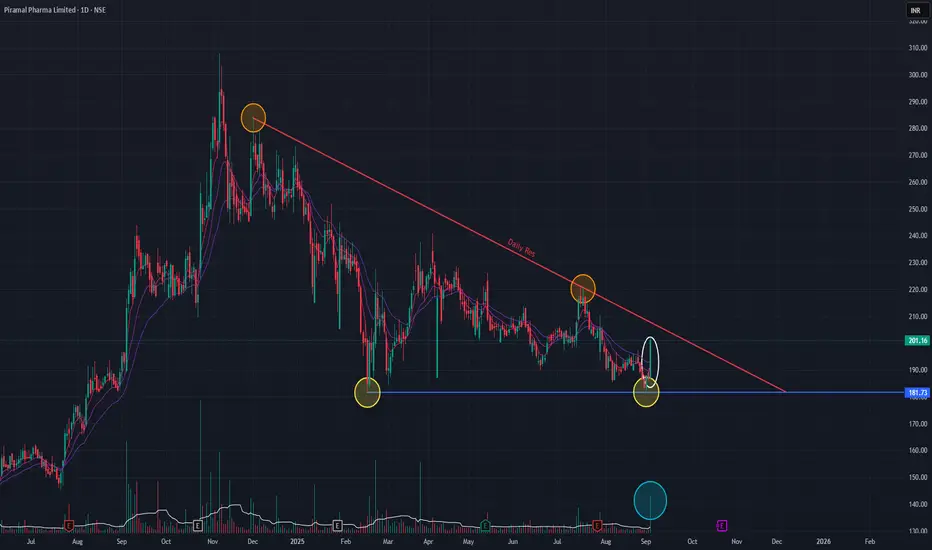
Piramal Pharma (Daily Timeframe) - Potential BreakOutPiramal Pharma, has formed a Double-Bottom chart pattern, indicating Bullish reversal. With today's bullish candle the volume has also spiked. We should watch out for the price action in the coming days. As indicated in the chart, resistance trendline is respected as well as the support trendline. If the stock has to move up, then it has to breach the resistance trendline.
Let's keep a watch on it.
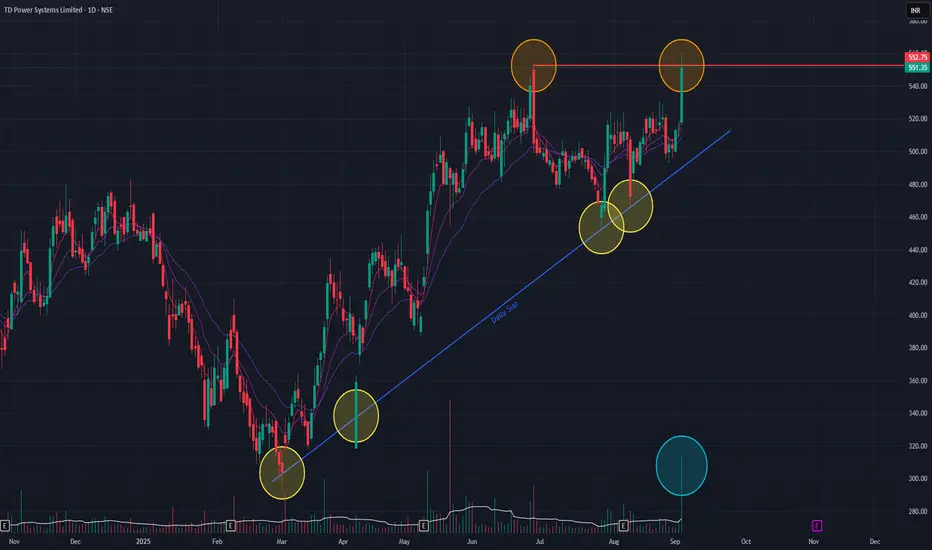
TD Power Systems (Daily Timeframe) - Can it make new ATH ??TD Power made a new All Time High today with huge volume. With that last bullish candle, on daily timeframe, we observe a Double-Top which is a bearish chart pattern. The angular support trendline has been respected as indicated. Short-term EMAs are in positive cross-over state, which is an obvious scenario during Double-Top formation.
We should observe how the price action plays out in the coming days to decide on the possible targets, both upside and downside.
Multi-Confirmation Price Action: Fibonacci Zones, Base BreakoutsExplore multi-confirmation techniques using Fibonacci retracement to identify high-probability base breakout zones. Learn how to spot double bottom and inverted head & shoulders patterns at demand levels and execute confirmation trades for precision entries

Bikaji Foods - Double Bottom + Strong BuyingBikaji Food is standing strong in this market. Nifty falling by more than 1400 points in 2 weeks and Bikaji is holding the fort. It is heading for a 30% jump to 1000+. Other factors:
1. Made double Bottom pattern on DTF
2. Moving in a small channel and looking to move upward after a breakout
3. JV with Chaudhary Group in Nepal - boost to business
4. Best profits margins in June'25 quarter
Bikaji is ready to explode and it should be in your watching for a quick trade. Targets are mentioned in the chart.
Keep following @Cleaneasycharts for more such stocks - we provide Right Stocks at Right Time at Right Price.
Cheers!!

“Multi-Year Rally in the Making – Route Mobile”My Technical View:
---Double-bottom pattern identified – strong reversal signal.
---Long-term trendline breakout in progress, setting the stage for a huge upside rally.
Upside Targets:
🎯 Target 1: +30% Upside
🎯 Target 2: +66% Upside
🎯 Target 3: 100%+ Upside
Key Growth Catalysts:
1) Global Expansion – Integration with CPaaS major Kaleyra, giving presence in 100+ countries and Tier-1 clients.
2) Strong Backing – Supported by Proximus Group (Belgium), enhancing credibility & global scale.
3) Tech Edge – Partnership with Nokia for secure, carrier-grade CPaaS solutions worldwide.
New Business Wins (Driving Revenue & Margins):
1) IRCTC – Enterprise communication.
2) L&T Metro – Smart ticketing.
3) Nagpur / Hyderabad / Pune Metros – Digital ticketing solutions.
4) Google RCS – Advanced messaging platform.

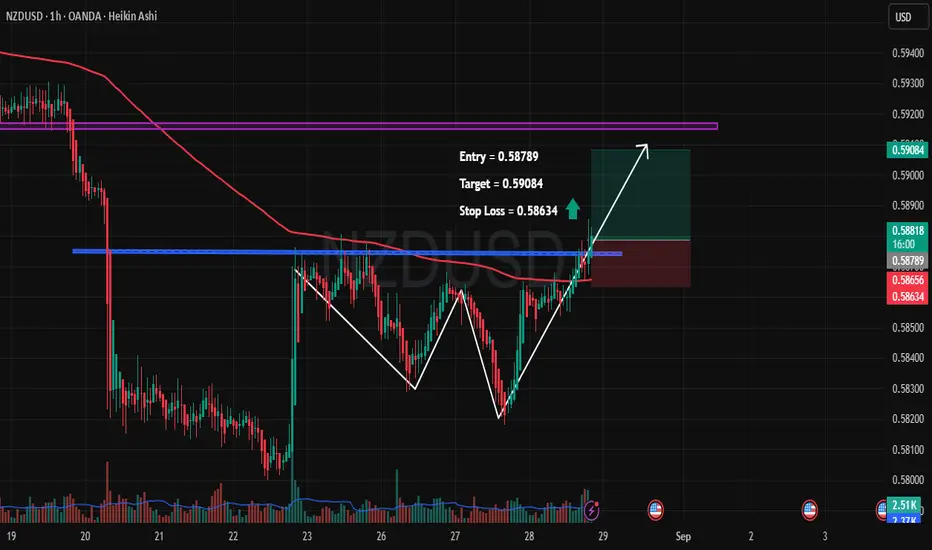
NZDUSD – Breakout Confirmation with Upside Potential🔹 Pair: NZDUSD (1H, Heikin Ashi)
🔹 Entry: 0.58789
🔹 Target: 0.59084 🎯
🔹 Stop Loss: 0.58634 🛑
🔑 Trade Rationale:
✅ Double Bottom Formation – Price respected key support twice, signaling potential reversal.
✅ Breakout Above Resistance – Clean breakout above horizontal resistance (blue line).
✅ 200 EMA Retest – Price is now pushing above the EMA, adding strength to the bullish case.
✅ Volume Spike – Recent surge in buying volume supports the upside move.
📊 Trade Plan:
I’m going long from 0.58789, looking for a quick move toward 0.59084. Risk is limited with a tight SL at 0.58634.
This setup offers a favorable R:R with a technical confluence of breakout + pattern confirmation.
⚠️ Disclaimer: This is not financial advice. Trade at your own risk. Always use proper risk management.
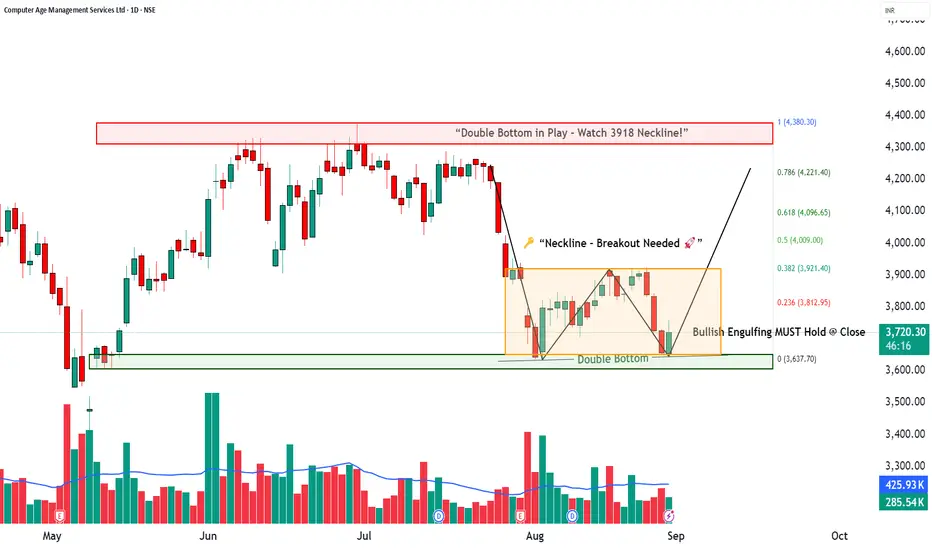
CAMS | Reversal in Sight? How to Trade a Double Bottom📈 CAMS | How to Trade a Double Bottom
Stock: Computer Age Management Services Ltd (CAMS)
Timeframe: Daily
Pattern: Possible Double Bottom (bullish reversal structure)
________________________________________
🔹 Pattern Identification
Bottom-1: 3632.40
Bottom-2: 3645
Neckline (Breakout Point): 3918
Candle Confirmation: Bullish Engulfing/Piercing on the second bottom
Volume: Improving on bounce, needs stronger confirmation on breakout
________________________________________
📘 Regular Trading Strategy (Conservative)
The Double Bottom is confirmed only when price closes above the neckline with strong volume.
Entry: Go long on close > 3918 preferred with volume ≥ 1.5–2× 20-DMA
Measured Height: 3918 − 3632 = 286 pts
Targets:
🎯 4094 (62% move)
🎯 4204 (full measured move)
🎯 4380 (161.8% Fibonacci extension)
Stoploss: Below 3630 (pattern invalidation)
Invalidation: Daily close below the bottoms
________________________________________
🔹 Alternative Entries
1️⃣ Retest Entry (Safer):
After breakout >3918, buy the pullback to neckline (3918–3925) if reversal candle appears.
SL below retest low.
2️⃣ Early Entry (Aggressive):
Trigger already seen at 3758.90 (bullish engulfing/piercing).
SL below 3668.
Add position if 3918 breakout confirms.
________________________________________
📊 Key Levels
Supports: 3668 | 3599 | 3554
Resistances: 3783 | 3827 | 3895
Fibonacci Zones: 3821 (23.6%) | 3921 (38.2%) | 4009 (50%) | 4096 (61.8%) | 4221(78.6%) | 4380 (100%)
________________________________________
💡 Trading View
CAMS is forming a potential Double Bottom reversal near major support.
Early signs of buying are visible at 3758.9, but real confirmation will come only above 3918 neckline.
Breakout with strong volume can open upside towards 4094 → 4204 → 4380.
📌 Bias: Bullish above 3750; stronger confirmation only on breakout above 3918.
📌 Risk: Invalidation below 3630.
👉 The Bullish Engulfing/Piercing candle at the second bottom MUST hold at daily close for the setup to remain valid.
⚠️ Disclaimer – Please Read Carefully
The information shared here is meant purely for learning and awareness. It is not a buy or sell recommendation and should not be taken as investment advice. I am not a SEBI-registered investment advisor, and all views expressed are based on personal study, chart patterns, and publicly available market data.
Trading — whether in stocks or options — carries risk. Markets can move unexpectedly, and losses can sometimes exceed the money you have invested. Past performance or past setups do not guarantee future results.
If you are a beginner, treat this as a guide to understand how the market works — practice on paper trades before risking real money. If you are experienced, always assess your own risk, position sizing, and strategy suitability before entering trades.
Consult a SEBI-registered financial advisor before making any real trading decision. By engaging with this content, you acknowledge full responsibility for your trades and investments.
💬 Found this useful?
🔼 Give this post a Boost to help more traders discover clean, structured learning.
✍️ Drop your thoughts, questions, or setups in the comments — let’s grow together!
🔁 Share with fellow traders and beginners to spread awareness.
👉 “If you liked this breakdown, follow for more clean, structured setups with discipline at the core.”
🚀 Stay Calm. Stay Clean. Trade With Patience.
Trade Smart | Learn Zones | Be Self-Reliant 📊
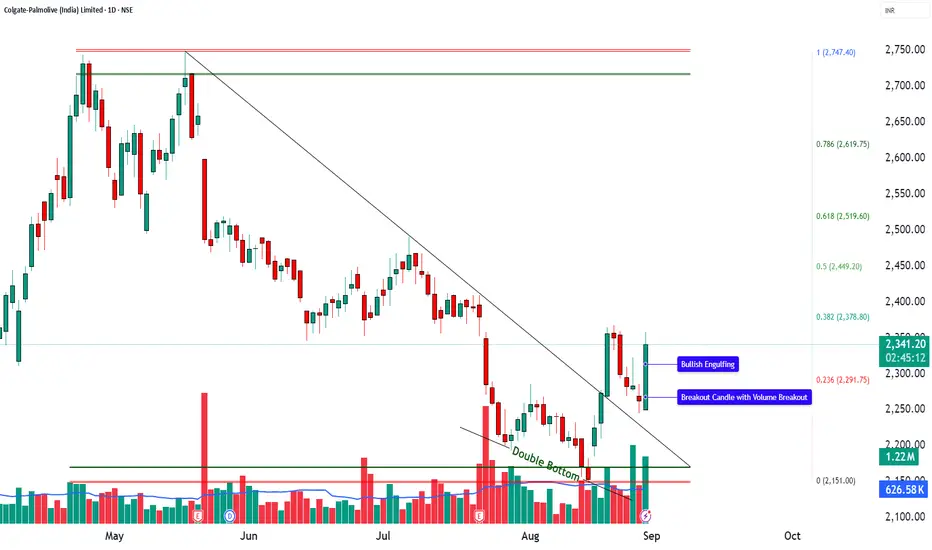
COLPAL | Double Bottom Retest + Volume Breakout🚀 COLPAL | Double Bottom Retest + Volume Breakout
📌 Pattern Setup:
🔹 Double Bottom retest spotted
🔹 Bullish Engulfing candle at support
🔹 Breakout candle with strong volume surge
📊 Technical Snapshot:
RSI: 58 → Healthy momentum
MACD: Bullish crossover
CCI: 107 → Strong positive bias
Stochastic: 89 → Overbought but strong
Volume: 1.22M vs 626k avg → ⚡ Breakout confirmed
🛠 Levels to Watch:
🔼 Long Entry: Above 2357.9
🔽 Stoploss: Below 2243
🎯 Targets: 2472 | 2587
📉 Pullback Buy Zone: 2291–2273
❌ Invalidation: Below 2207
⚡ Resistance Levels: 2382 | 2424 | 2490
⚡ Support Levels: 2274 | 2208 | 2167
🎯 Fibonacci Zones: 2378 → 2449 → 2519 → 2619 → 2747
💡 View:
COLPAL is breaking out from a Double Bottom Retest with strong volume & bullish signals. Sustaining above 2358 could open the gates towards 2472 – 2587 in the short term.
👉 Bias: Bullish till 2207 holds.
⚠️ Disclaimer – Please Read Carefully
The information shared here is meant purely for learning and awareness. It is not a buy or sell recommendation and should not be taken as investment advice. I am not a SEBI-registered investment advisor, and all views expressed are based on personal study, chart patterns, and publicly available market data.
Trading — whether in stocks or options — carries risk. Markets can move unexpectedly, and losses can sometimes exceed the money you have invested. Past performance or past setups do not guarantee future results.
If you are a beginner, treat this as a guide to understand how the market works — practice on paper trades before risking real money. If you are experienced, always assess your own risk, position sizing, and strategy suitability before entering trades.
Consult a SEBI-registered financial advisor before making any real trading decision. By engaging with this content, you acknowledge full responsibility for your trades and investments.
💬 Found this useful?
🔼 Give this post a Boost to help more traders discover clean, structured learning.
✍️ Drop your thoughts, questions, or setups in the comments — let’s grow together!
🔁 Share with fellow traders and beginners to spread awareness.
👉 “If you liked this breakdown, follow for more clean, structured setups with discipline at the core.”
🚀 Stay Calm. Stay Clean. Trade With Patience.
Trade Smart | Learn Zones | Be Self-Reliant 📊
ECLERX SKYROCKETS 35%! This Pattern Signals ₹4,200 TargetNSE:ECLERX SKYROCKETS 35%, Made a Beautiful Chart Structure to Qualify for the Chart of the Week
Price Action:
- It experienced a powerful rally from ₹2,200 to ₹3,877 (all-time high) between July and October 2024
- Recent correction formed a descending wedge pattern from October 2024 to early May 2025
- Currently showing an explosive breakout at ₹3,301.80, up ₹852.40 (+34.80%) in this Week.
- Massive single-week gain with a long bullish candle breaking above both resistance levels and the downtrend line
- The weekly chart shows a strong V-shaped recovery from support
Volume Analysis:
- This Week's volume at 2.28M shares vs. average of 420.79K (over 5x normal volume)
- Previous support bounces have also witnessed above-average volume
- Extremely high volume on today's breakout suggests significant institutional participation
- Volume pattern confirms the legitimacy of the price action
Key Support and Resistance:
- Strong support zone at ₹2,200-2,300 (green horizontal box) - tested and held multiple times over the past year
- Previous resistance now likely support at ₹3,200-3,250 (green horizontal line)
- Next resistance at all-time high of ₹3,877 (marked as "High")
- Downtrend line (white diagonal) now broken with conviction
Technical Patterns:
1. Descending Wedge Breakout- Classic bullish reversal pattern completed this week
2. Double Bottom*- Formed at ₹2,300 level in March-May 2025
3. Support Retest- Successfully retested the major support zone before the breakout
4. V-Shaped Recovery - Strong reversal indicating powerful buying interest
Trade Setup:
- Pattern: Descending wedge breakout with volume confirmation
- Confirmation: Explosive price action and volume expansion
- Context: Bullish reversal after testing major support zone
Entry Points:
1. Aggressive Entry: Current price (₹3,301.80) with partial position
2. Pullback Entry: On retest of breakout level ₹2,900-3,000
3. Confirmation Entry: On consolidation and holding above ₹3,200 for 2-3 sessions
Exit Strategy:
- Target 1: ₹3,600 (psychological resistance)
- Target 2: ₹3,877 (previous all-time high)
- Target 3: ₹4,200 (pattern projection based on measured move)
- Trailing Stop: 7% trailing stop after Target 1 is achieved
Stop Loss Placement:
- Aggressive Stop: ₹2,950 (below recent swing low)
- Conservative Stop: ₹2,800 (near the breakout point of the wedge)
- Pattern-Based Stop: ₹2,500 (invalidation level for the pattern)
Risk Management:
- Position sizing: Limit risk to 1-2% of trading capital
- Risk-reward ratio: Minimum 1:1.5 for aggressive entry, 1:2 for pullback entry
- Consider scaling approach:
* Enter 50% position now
* Add 25% on confirmation of trend (holding above ₹3,200)
* Add 25% on pullback (if it occurs)
- Take partial profits: 30% at Target 1, 30% at Target 2, hold remainder with trailing stop
NSE:ECLERX shows a powerful technical setup with its powerful breakout from a descending wedge pattern on record volume. The price action respects key technical levels, with the stock holding major support at ₹2,200-2,300 before staging today's massive rally. The breakout above both the wedge pattern and horizontal resistance, with 5x normal volume, suggests potential for continued upside momentum toward previous highs and beyond.
Keep in the Watchlist.
NO RECO. For Buy/Sell.
📌Thank you for exploring my idea! I hope you found it valuable.
🙏FOLLOW for more
👍BOOST if you found it useful.
✍️COMMENT below with your views.
Meanwhile, check out my other stock ideas on the right side until this trade is activated. I would love your feedback.
Disclaimer: "I am not a SEBI REGISTERED RESEARCH ANALYST AND INVESTMENT ADVISER."
This analysis is intended solely for informational and educational purposes and should not be interpreted as financial advice. It is advisable to consult a qualified financial advisor or conduct thorough research before making investment decisions.

Nifty - Weekly Review Aug 25 to Aug 29Price is at the double bottom support now. Breaking it can make the price fill the gap. Filling the gap will make the price more bearish. 24850 is the trend direction deciding zone now.
Buy above 24920 with the stop loss of 24870 for the targets 24960, 25000, 25060, 25120, and 25200.
Sell below 24800 with the stop loss of 24850 for the targets 24760, 24700, 24660, 24600 and 24540.
Always do your analysis before taking any trade.

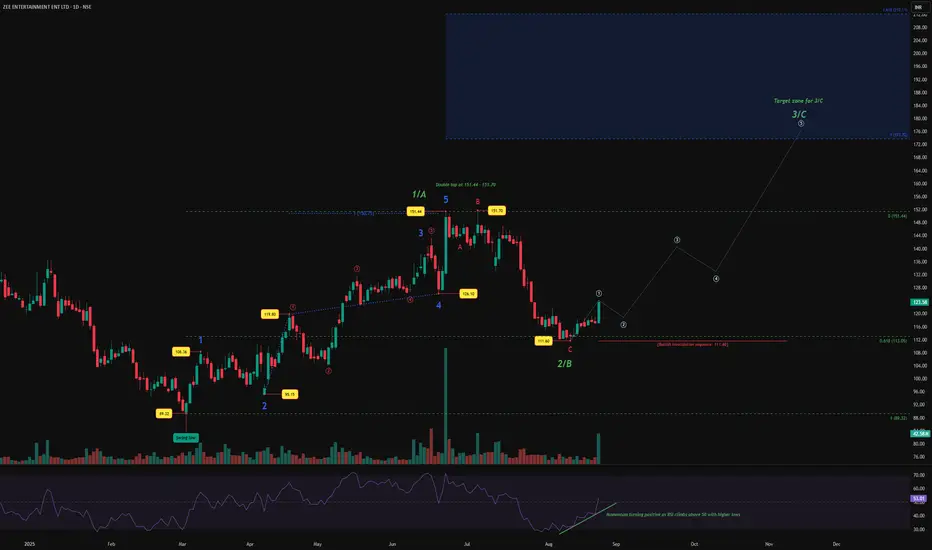
Zee Entertainment – Wave 3/C on the Horizon?After topping near 151.44–151.70 (a neat double top), price corrected into 111.60 , completing what looks like Wave 2/B right around the 0.618 retracement.
Now, signs of life are emerging:
Volume has ticked higher, hinting at accumulation.
RSI is forming higher lows and has regained strength above 50.
The structure is shaping up for a fresh impulsive advance toward the 173–212 zone (1.0–1.618 extension).
The path higher is expected to unfold as a 5-wave sequence, with Wave 3/C potentially targeting this blue zone overhead.
⚠️ Invalidation: A sustained move below 111.60 would negate this bullish sequence, opening the door for deeper correction.
Disclaimer: This analysis is for educational purposes only and does not constitute investment advice. Please do your own research (DYOR) before making any trading decisions.
How to read market TOPS like a pro : Double & Triple TopsIn this video I will breakdown about the concepts of Double and triple tops, they aren’t just reversal signals — they’re blueprints of future price action. Here’s how to read market tops like a pro and anticipate what comes next.

OPTIEMUS Price ActionOptiemus Infracom Limited (OPTIEMUS) is currently trading around ₹608 as of August 2025. The stock has shown a strong recent performance, gaining approximately 4% in the latest trading sessions, with daily price ranges between ₹585 and ₹625.
Over the past year, the stock price has fluctuated substantially, with a 52-week low near ₹378 and a high nearing ₹874. The current price sits closer to the mid-to-upper end of this range, indicating a recovery from lows but still beneath recent highs.
Financially, Optiemus Infracom has an earnings per share (EPS) of about ₹7.58. The price-to-earnings (PE) ratio stands elevated, above 80, which highlights strong market expectations for future growth or reflects a premium valuation often seen in technology or telecom-related firms.
The price trades above its 50-day average (~₹609) and 200-day average (~₹595), indicating a positive medium-term trend. Volume levels are moderate, consistent with stable investor interest.
While the stock has seen volatility, the trajectory suggests a gradual uptrend supported by its core business segments in electronics and telecommunications infrastructure. Key support is seen around ₹580, while resistance near ₹630 could test the strength of the ongoing rally.
In summary, Optiemus Infracom is positioned in an upward trading range with strong growth expectations, but valuation is relatively high, which should be monitored alongside company earnings and sector dynamics for future moves.

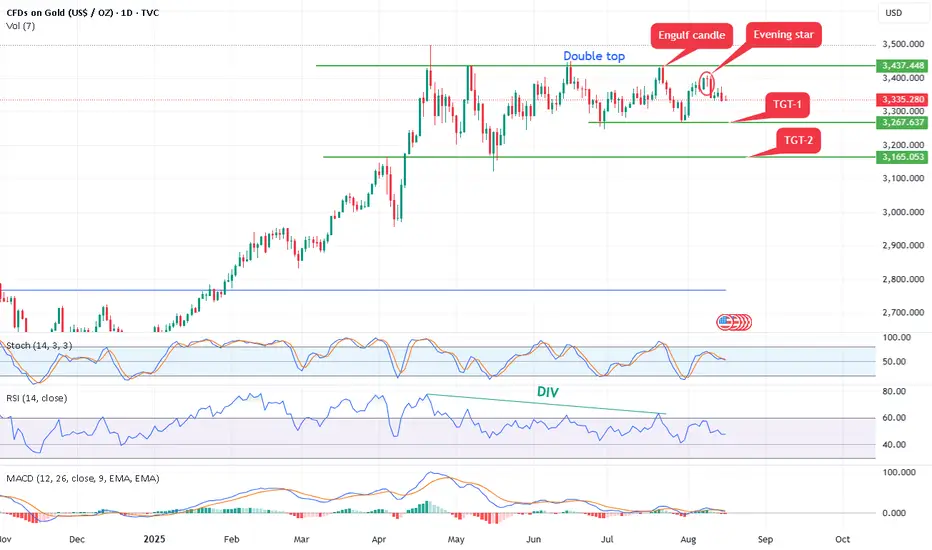
Gold form double top bearish pattern,Bearish Patterns Annotated:
Double Top: A classic bearish reversal pattern resembling an "M" shape. It occurs when price hits resistance twice at similar levels (here, approximately $3,437 and $3,448 in July and August) and fails to break higher. This signals potential exhaustion of buyers and a shift to sellers.
Evening Star: A three-candle bearish reversal pattern marked near the recent high. It typically consists of a large green candle (up day), followed by a small-bodied candle (indecision), and then a large red candle closing below the midpoint of the first candle. This suggests bulls are losing control.
Engulf Candle (Bearish Engulfing): A red candle that completely "engulfs" the body of the prior green candle, indicating strong selling pressure overriding previous buying. It's marked near the top, reinforcing the reversal theme.
Opportunity: - As per chart it can short 3380-3350 with stop loss 3400 above for the targets of double bottom pattern 3260 and 3160.
BTC SHORTBTC is at ATH, now we can see some selling pressure. First indication is the strong red candle which was formed on 14th Aug. According to Price action it can test 108K and then and trend line which is in red coming from Nov 2022.
If we get a lower low formation in lower timeframe we can short below short and even if sl get hit can try to reenter.
I am confidant though.

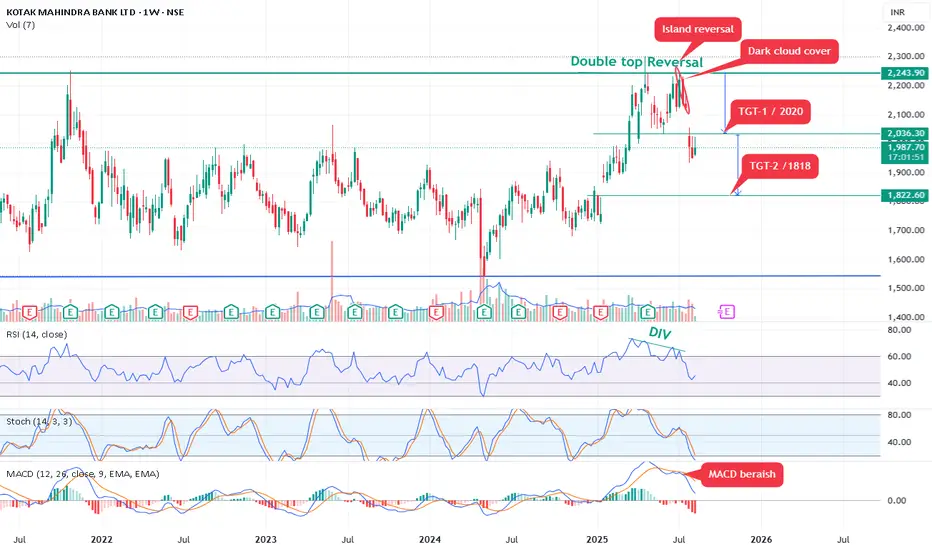
Kotak Mahindra bank form double top Reversal pattern.Kotak Mahindra bank form double top Reversal pattern.
Bearish View (Short Opportunity): The pattern suggests shorting on any rally back up to ₹2,020 (potential resistance or retest of the neckline/breakout level).
As per pattern is may test 1818 soon target -2.
Risk-reward ratio: Approximately 1:2-3, assuming disciplined stops.
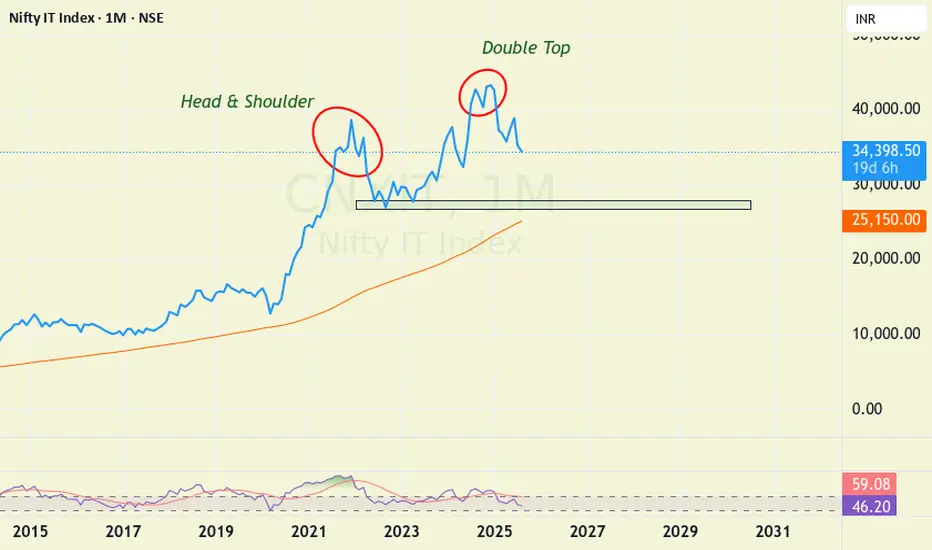
Bearish patterns in Nifty ITOn monthly we see multiple bearish patterns in IT index.
Over long term we can see that this index takes support near 100 SMA on monthly.
Currently this index is in down trend and in worst case can see support nr 29000 levels. Which also coincides with earlier buying zone.
I would avoid IT till I find some good bottoming out pattern.
Nifty 50 29400 is Resistance for this month As per one of the GAN Cycle the 24900 will react as strong resistance.
As per cross over, one upward pullback is pending , so we can wait till 24900 to short or agressive trader can go long till 24900.
#nifty, #optiontrade

Route Mobile Bottomed-out for Highest UpsideMy Stock View and Opinion:
Double-bottom pattern identified, Huge upside potential as enterprise communication continues to evolve globally.
Strategic Moves:
1) Successful integration with global CPaaS major Kaleyra, unlocking access to 100+ countries and Tier-1 enterprise clients.
2) Backed by Proximus Group (Belgium), enhancing global reach and enterprise credibility.
3) Collaboration with Nokia to deliver secure, carrier-grade CPaaS services to telecom operators globally.
Strong execution capabilities, strategic partnerships with global telecom leaders, scalable SaaS-driven model, and growing demand for digital engagement platforms position Route Mobile for sustained multi-year growth.
