End of the Drop? Tata Motors Sets Stage for Wave 3Tata Motors has completed a clear five-wave advance from the April low of 535.75 to a high near 742, which is being marked as wave 1. After that peak, the stock entered a corrective phase and has now dropped into what appears to be an a-b-c structure (expanding flat), likely forming wave 2. The recent decline has reached the 1.618 extension of wave a, with wave c possibly ending near 672.
This 1.618 level is often where deeper corrections tend to exhaust, and price has also moved below the lower edge of the Bollinger Band, which can signal short-term pressure easing. These two conditions together suggest that the current downmove may be ending. If this count is correct, the next move should be a fresh upward rally in the form of wave 3.
For this idea to stay valid, wave 2 must not fall below the April low at 535.75, which serves as the key invalidation level. Until then, the setup remains constructive, with early signs pointing to a possible bounce from here.
Disclaimer: This analysis is for educational purposes only and does not constitute investment advice. Please do your own research (DYOR) before making any trading decisions.
Double Top or Bottom

Dhani BO: Ready for Its Next Rally After 80% Correction?NSE:DHANI Breakout: Is This Med/Fin Tech Stock Ready for Its Next Rally After 80% Correction?
Price Action Overview:
- Stock has undergone a significant correction from highs of ₹109.88 to lows of ₹47.05, representing nearly a 57% decline
- Currently trading at ₹71.09 with recent bullish momentum showing +14.42% gains
- Price action suggests a potential bottoming process after prolonged consolidation
Volume Spread Analysis:
- Significant volume spikes observed during major price movements
- Recent breakout accompanied by above-average volume (4.22M vs average 30.03M)
- Volume concentration during earnings announcements (marked 'E' on the chart) indicates institutional participation
- Higher volume during recent uptick suggests renewed interest
Key Technical Levels:
Support Levels:
- Primary Support: ₹50-52 zone (previous consolidation area)
- Secondary Support: ₹47.05 (absolute low)
- Immediate Support: ₹62-65 (recent breakout zone)
Resistance Levels:
- Immediate Resistance: ₹82.71 (marked horizontal level)
- Major Resistance: ₹96.79-₹109.88 (previous highs zone)
- Intermediate Resistance: ₹75-78 (previous resistance turned support)
Base Formation:
- Extended consolidation base formed between ₹50-₹68 over 4-5 months
- Classic rectangle/range-bound pattern with multiple tests of support and resistance
- Recent breakout from the upper boundary of this base suggests the completion of the accumulation phase.
Technical Patterns:
- Descending triangle pattern from February to April 2025
- Internal Flag & Pole Breakout
- Recent breakout from the consolidation rectangle
- Potential inverse head and shoulders formation on smaller timeframes
- Rising volume during breakout confirms pattern validity
Trade Setup:
Entry Strategy:
- Primary Entry: ₹68-₹70 (on pullback to breakout level)
- Aggressive Entry: Current levels ₹71-₹72 (momentum play)
- Conservative Entry: ₹65-₹67 (retest of breakout zone)
Exit Levels:
- Target 1: ₹82-₹85 (immediate resistance zone) - Risk: Reward 1:2
- Target 2: ₹95-₹98 (major resistance area) - Risk: Reward 1:3.5
- Target 3: ₹110-₹115 (previous highs extension) - Risk: Reward 1:4.5
Stop Loss:
- Conservative Stop: ₹62 (below recent consolidation)
- Aggressive Stop: ₹58 (below key support cluster)
- Trailing Stop: Implement an 8-10% trailing stop after the first target achievement
Position Sizing:
- Risk per trade: Maximum 2% of portfolio
- Position size calculation: Portfolio value × 2% ÷ (Entry price - Stop loss)
- For ₹1,00,000 portfolio with ₹70 entry and ₹62 stop: Position size = ₹2,000 ÷ ₹8 = 250 shares
Risk Management:
- Maximum exposure to single stock: 5% of total portfolio
- Sector exposure limit: 15% to financial services
- Use of stop-loss orders mandatory
- Position review after every 10% move in either direction
- Risk-reward ratio minimum 1:2 for all trades
Sectoral Backdrop:
Fintech Sector Overview:
- Digital lending sector experiencing regulatory scrutiny, but long-term growth prospects intact
- Increasing digital adoption post-pandemic, supporting fintech growth
- RBI guidelines on digital lending create compliance costs but also barriers to entry
- Consolidation is expected in the sector, favouring established players
Industry Trends:
- Growing smartphone penetration is driving digital financial services adoption
- The government push for financial inclusion through digital means
- Rising interest rates are impacting borrowing costs but improving net interest margins
- Increasing focus on data analytics and AI-driven lending decisions
Fundamental Backdrop:
Company Overview:
- Dhani Services operates in the digital financial services space
- Diversified business model including lending, insurance, and investment services
- Strong technology platform enabling scalable operations
- Focus on serving underbanked population segments
Recent Developments:
- Quarterly earnings showing revenue growth trajectory
- Management focuses on improving asset quality and reducing NPAs
- Strategic partnerships for expanding product offerings
- Regulatory compliance improvements undertaken
Financial Health Indicators:
- Need to monitor debt-to-equity ratios given the lending business nature
- Asset quality metrics are crucial for long-term sustainability
- Revenue diversification, reducing dependence on single income streams
- Technology investments supporting operational efficiency
Catalyst Factors:
- Potential regulatory clarity on digital lending norms
- Expansion of credit underwriting capabilities
- Strategic alliances or acquisition opportunities
- Improved economic conditions support loan demand
Risk Factors:
- Regulatory changes in the fintech space
- Competition from established banks entering the digital space
- Credit risk in unsecured lending segments
- Technology and cybersecurity risks
- Dependence on external funding for growth capital
My Take:
This technical setup suggests a potential medium-term opportunity with proper risk management, though investors should monitor both technical levels and fundamental developments closely.
Keep in the Watchlist.
NO RECO. For Buy/Sell.
📌Thank you for exploring my idea! I hope you found it valuable.
🙏FOLLOW for more
👍BOOST if you found it useful.
✍️COMMENT below with your views.
Meanwhile, check out my other stock ideas on the right side until this trade is activated. I would love your feedback.
Disclaimer: "I am not a SEBI REGISTERED RESEARCH ANALYST AND INVESTMENT ADVISER."
This analysis is intended solely for informational and educational purposes and should not be interpreted as financial advice. It is advisable to consult a qualified financial advisor or conduct thorough research before making investment decisions.
DLong

Crude may bounce up to 5522 level.Crude oil is on bounce, As per chart Crude is showing divergence with morning start. It is at demand zone and add more if come down to 4900 level. It may test minimum 5522 level soon.

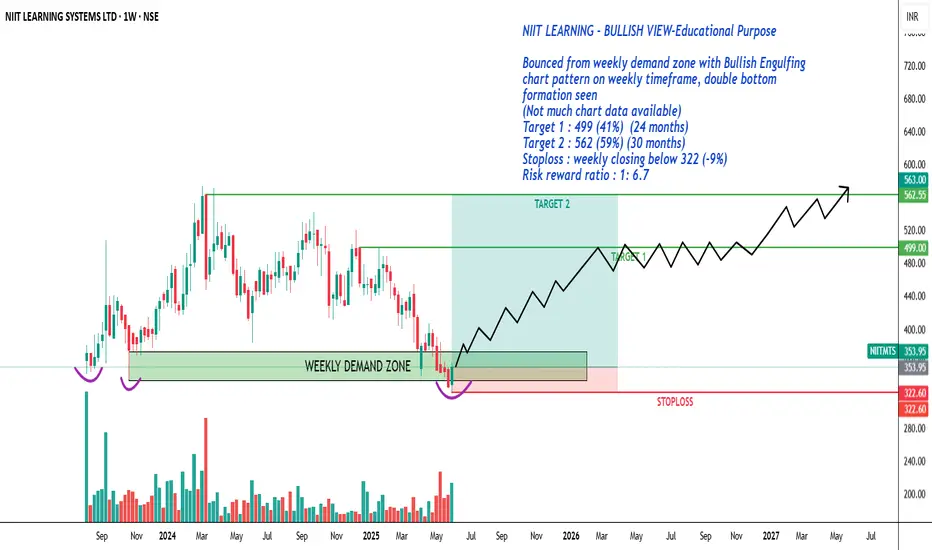
NIIT LEARNING - Double bottom - BULLISH VIEW-Educational PurposeNIIT LEARNING - BULLISH VIEW-Educational Purpose
Bounced from weekly demand zone with Bullish Engulfing chart pattern on weekly timeframe, double bottom formation seen
(Not much chart data available)
Target 1 : 499 (41%) (24 months)
Target 2 : 562 (59%) (30 months)
Stop loss : weekly closing below 322 (-9%)
Risk reward ratio : 1: 6.7
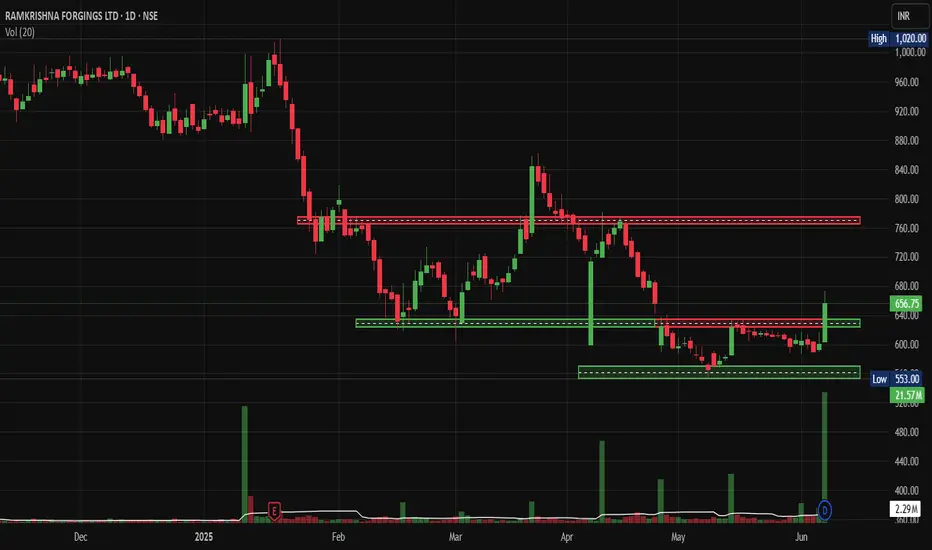
RKF Massive Breakout After 6-Month Consolidation.NSE:RKFORGE Hidden Auto Component Gem Ready for Massive Breakout After 6-Month Consolidation, after Breaking out Today With King Candle and Volumes.
Price Action:
- Current Price: ₹656.75 (+9.37% gain)
- Trading Range: ₹553.00 - ₹1,020.00
- Market Cap Category: Mid-cap stock with decent liquidity
- Chart Pattern: Extended consolidation phase with recent breakout attempt
Support and Resistance Levels
- Primary Resistance: ₹760-780 zone (red horizontal line)
- Secondary Resistance: ₹1,020 (previous high)
- Immediate Support: ₹620-640 zone
- Major Support: ₹553-580 zone (green horizontal rectangle)
- Critical Support: ₹553 (52-week low)
Base Formation:
- Base Type: Rectangle/Sideways consolidation base
- Duration: Approximately 6 months (January 2025 to June 2025)
- Base Depth: ~45% correction from highs
- Base Quality: Tight consolidation with reduced volatility
- Breakout Characteristics: Recent volume spike suggests potential base completion
Technical Patterns:
- Rectangle Pattern: Clear horizontal support and resistance boundaries
- Volume Accumulation: Declining volume during consolidation, spike on recent move
- Flag Formation: Potential bull flag pattern forming at current levels
- Double Bottom: Possible formation around ₹553-580 support zone
Volume Spread Analysis
- Volume Characteristics: 21.57M shares traded (above average)
- Volume Pattern: Higher volume on up days, lower on down days
- *Accumulation Signs: Volume spike coinciding with price breakout attempt
- Volume Confirmation: Recent breakout supported by increased participation
Trade Setup:
Entry Strategy:
- Primary Entry: ₹650-665 (current levels on pullback)
- Aggressive Entry: ₹680-690 (on breakout above resistance)
- Conservative Entry: ₹620-630 (on retest of support)
Exit Levels:
- Target 1: ₹750-760 (15% upside)
- Target 2: ₹850-880 (30% upside)
- Target 3: ₹980-1,000 (50% upside)
Stop Loss Levels:
- Tight Stop: ₹620 (5% risk)
- Swing Stop: ₹580 (12% risk)
- Position Stop: ₹550 (16% risk)
Position Sizing:
- Conservative Allocation: 2-3% of portfolio
- Moderate Allocation: 4-5% of portfolio
- Aggressive Allocation: 6-8% of portfolio (for risk-tolerant investors)
Risk Management:
- Risk-Reward Ratio: Minimum 1:2 for all entries
- Portfolio Risk: Maximum 2% portfolio risk per position
- Position Monitoring: Weekly review of technical levels
- Profit Booking: 25% at Target 1, 50% at Target 2, remainder at Target 3
Sectoral Backdrop:
Auto Components Sector Overview
- Sector Performance: Recovery phase post-COVID disruptions
- Growth Drivers: EV transition, export opportunities, aftermarket demand
- Challenges: Raw material inflation, supply chain disruptions
- Government Support: PLI schemes, Make in India initiatives
Forging Industry Dynamics
- Market Position: Specialised manufacturing with high entry barriers
- Demand Drivers: Commercial vehicle recovery, export growth
- Competitive Advantage: Technical expertise, established client relationships
- Cyclical Nature: Linked to auto industry cycles and capex spending
Fundamental Backdrop
Company Overview
- Business Model: Automotive forging components manufacturer
- Key Clients: Major OEMs in domestic and international markets
- Product Portfolio: Crankshafts, connecting rods, front axle beams
- Manufacturing Facilities: Multiple locations with modern equipment
Financial Health Indicators
- Revenue Growth: Recovery trajectory expected post-consolidation
- Margin Profile: Improving operational efficiency
- Debt Levels: Manageable debt-to-equity ratios
- Cash Flow: Positive operating cash flow generation
Growth Catalysts
- Export Expansion: Increasing share in global supply chains
- Product Diversification: Entry into new automotive segments
- Technology Upgrades: Investment in advanced manufacturing
- Market Recovery: Commercial vehicle segment revival
Risk Factors
- Cyclical Demand: Vulnerability to auto industry downturns
- Raw Material Costs: Steel price volatility impact
- Competition: Pressure from low-cost manufacturers
- Regulatory Changes: Environmental and safety compliance costs
My Take:
NSE:RKFORGE presents a compelling technical setup after a prolonged consolidation phase. The stock appears to be breaking out from a well-defined base with strong volume support. The risk-reward profile is attractive for medium-term investors, with clear support and resistance levels providing good trade management opportunities. However, investors should remain mindful of the cyclical nature of the auto components sector and size positions accordingly.
Keep in the Watchlist.
NO RECO. For Buy/Sell.
📌Thank you for exploring my idea! I hope you found it valuable.
🙏FOLLOW for more
👍BOOST if you found it useful.
✍️COMMENT below with your views.
Meanwhile, check out my other stock ideas on the right side until this trade is activated. I would love your feedback.
Disclaimer: "I am not a SEBI REGISTERED RESEARCH ANALYST AND INVESTMENT ADVISER."
This analysis is intended solely for informational and educational purposes and should not be interpreted as financial advice. It is advisable to consult a qualified financial advisor or conduct thorough research before making investment decisions.
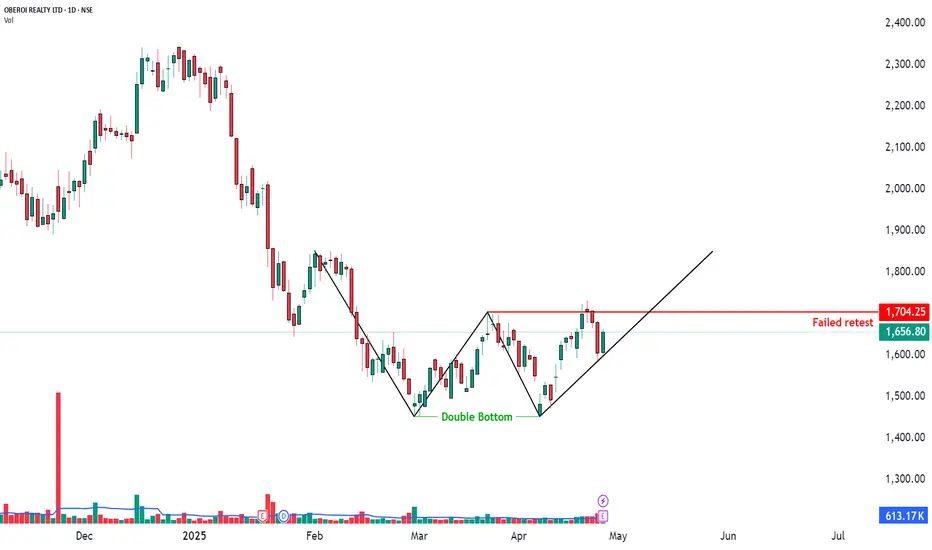
Double Bottom but Failed Breakout Retest | Daily Time Frame📉 OBEROI REALTY LTD – Double Bottom but Failed Breakout Retest
📅 Date: April 28, 2025
📈 Timeframe: Daily Chart
🔍 Stock: Oberoi Realty Ltd (NSE)
📌 Technical Overview:
A Double Bottom pattern was formed indicating bullish reversal potential.
Price attempted a breakout above the neckline near ₹1704.25, but the retest failed — price could not sustain above the breakout zone.
Price is currently trading at ₹1656.80, under the trendline support.
🧩 Key Observations:
✅ Double bottom structure was confirmed.
❌ Breakout retest failed — caution needed.
📉 Watch trendline support (black line) closely — breakdown could trigger weakness.
📊 Volume during the failure was moderate (not aggressive selling yet).
🧠 Observational Bias:
Weak below the trendline support.
Bulls must reclaim and hold above ₹1704.25 to regain strength.
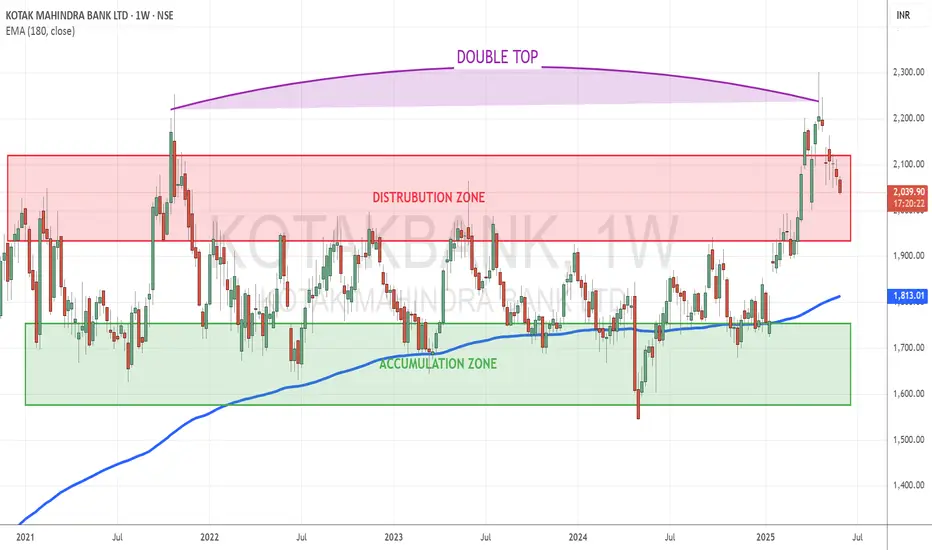
Kotak Bank Remains Range-Bound Amid Breakout AttemptsTopic Statement:
Kotak Bank has been trading sideways since 2021, forming a structured accumulation and distribution pattern within a broad range.
Key Points:
* The stock has clear accumulation and distribution zones, making channel-based trading efficient
* A recent breakout attempt was met with strong resistance, forming a double top pattern and pushing the price down
* The price has overextended above the 180-day EMA, contributing to the heavy resistance at the double top
* Accumulating the stock near or below the 180-day EMA presents a favorable long-term opportunity
RelianceIn lower time frame as well as higher time frame, price is at support. Range has formed in between 1440 - 1460.
Buy above 1440 with the stop loss of 1430 for the targets 1452, 1466, 1478 and 1492.
Price is bullish as long as it sustains above 1400.
If price breaks the support in lower time frame chart that is 1430 - 1440, then it will take support at 1400.
Always do your own analysis before taking any trade.

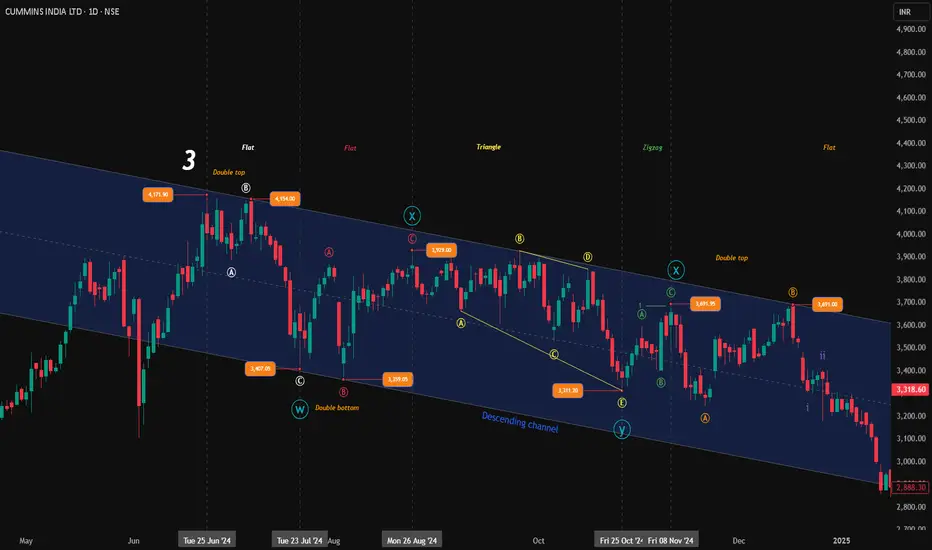
Waves Gone Wild: Understanding Complex CorrectionsUntangling the Mystery of Complex Corrections – A Simple Walkthrough Using CUMMINS INDIA
Ever wondered why the market suddenly becomes messy and confusing after a big rally? Welcome to the land of Elliott Wave corrections, where things aren't always a straight road—but if you know the signs, you won’t get lost.
Let’s break it down using a real chart – CUMMINS INDIA , where we can spot all types of corrections playing out like a drama series.
Step 1: Why Do Corrections Happen?
Corrections mostly show up in Wave 2 and Wave 4, which come after a strong trend (Wave 1 or 3). The job of corrections is simple – to cool things down before the next move.
Step 2: The Simple Ones – Flats and Zigzags
Zigzags (Pattern: 5-3-5):
Wave A: 5 waves
Wave B: 3 waves (does not cross the start of A)
Wave C: 5 waves, usually equal to or 1.618x of A
Zigzags are sharp and directional – like a quick jab.
Flats (Pattern: 3-3-5):
All about sideways movement.
The B wave often ends near or slightly above/below A’s start – forming what we call expanded flats (hello, double tops and bottoms!)
C wave finishes things off with 5 waves.
Flats are more chill – like the market catching its breath.
Step 3: The Slow Builders – Triangles
Triangles are like coiled springs. They’re made of five legs: A-B-C-D-E, all 3-wave moves. These usually show up in:
Wave 4 of an impulse
Y wave inside complex corrections
Think of triangles as the calm before the final push. You’ll often spot them before Wave 5 explodes.
Step 4: When One Correction Isn't Enough – Enter WXY
Imagine the market says, “One ABC correction? Nah, let’s keep going.”
WXY: Two corrections joined by an X wave.
W = ABC
X = ABC (a connector)
Y = ABC again
So it’s like: ABC + ABC + ABC
Step 5: When Even That’s Not Enough – The WXYXZ Beast
Sometimes the market just doesn’t want to move on. So it throws in another ABC.
WXYXZ:
That’s three ABC corrections, joined by two X waves.
If that’s still not enough? (Yes, this happens)
The whole mess becomes just Wave W of another larger correction. Fun, right?
CUMMINS INDIA – The Perfect Textbook Example
In the chart:
You’ll see flats, zigzags, triangles, all wrapped inside a giant WXYXZ correction.
It spanned months, unfolded in layers, and just maybe, it’s done now.
From April onwards, the move looks impulsive (non-overlapping), hinting at a fresh trend. Or… is it just a big Zigzag in disguise? (C = 1.618 × A, remember?)
Only time (and maybe a bit more charting) will tell.
Final Thoughts
There are amazing books, and thousands of charts to study if you’re serious about learning.
"Give a man a fish, he eats for a day. Teach him how to fish, he eats for life." Trading is the same. Learn the process. Dont chase the calls.
I’m just sharing what I’ve learned with this post. Hope it helps someone out there. Happy charting, and remember— no one is ever 100% right. Stay curious. Stay humble.
Disclaimer: This analysis is for educational purposes only and does not constitute investment advice. Please do your own research (DYOR) before making any trading decisions.
Aether Industries has been consolidating?Aether has been consolidating for almost a year within a falling wedge pattern, a structure that often signals the end of a downtrend. Recently, the stock has shown signs of bottoming out near the ₹740–750 zone, where it found strong demand in the past as well.
• This base has now formed two key bottoms, which indicate potential accumulation by long-term investors. The volume is gradually increasing near the lower end of the wedge, which may suggest silent buying.
• From a fundamental perspective, Aether operates in the specialty chemicals sector with a focus on niche products and R&D capabilities. The sector has long-term tailwinds due to India's growing role as a global chemical supplier. Aether's consistent revenue growth and expansion into new chemistries make it a structural story rather than just a trading bet.
• A breakout if close above ₹757 could trigger a strong uptrend, with potential targets around ₹1,150 and even ₹1,400 in the longer term. The price would then be aligning with the company's growth potential, as the fundamentals begin to reflect in the stock price.
• The risk-reward here favors patient investors willing to sit through volatility, especially if the company continues to deliver on execution.
Like, comment your thoughts, and share this post
Explore more stock ideas on the right hand side your feedback means a lot to me!
Disclaimer: This post is for educational purposes only and should not be considered a buy/sell recommendation.

CSBBANK : Swing Pick#CSBBANK #BREAKOUTSTOCK #trendingstock
CSBBANK : Swing Trade
>> Breakout Candidate
>> Trending stock
>> Good strength & Volume
>> Good Upside Potential
Swing Traders can lock profit at 10% and keep trailing
Disc : Stock Charts shared are for Learning purpose and not a Trade recommendation.
Consult a SEBI Registered Advisor before taking position in it.

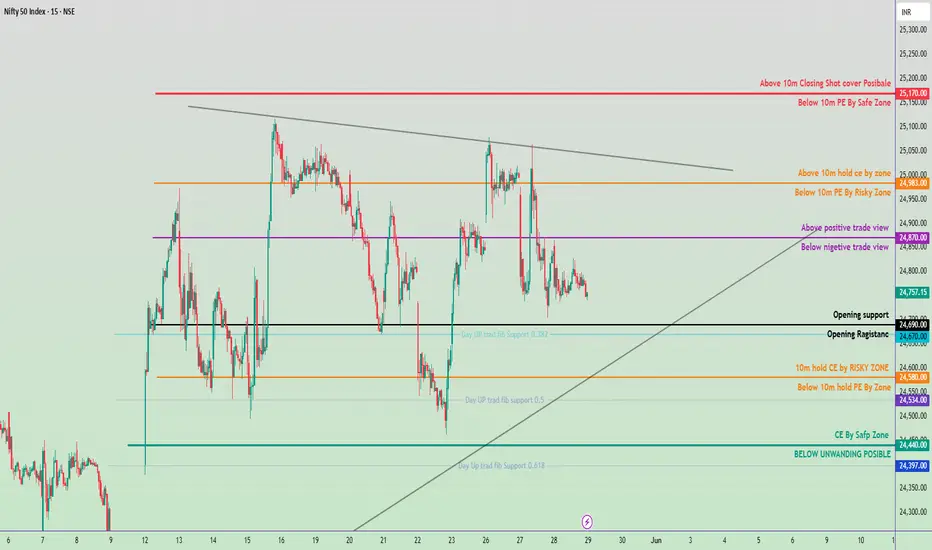
May 29, 2025 Nifty 50 Trading Zone 🔺 Bullish Bias If:
Price sustains above 24,870:
Expect move towards 24,983 (Above 10M CE zone).
Target: 25,170 (Short covering may trigger).
Strategy: Buy on dips above 24,870 with SL below 24,840.
🔻 Bearish Bias If:
Price falls below 24,670:
Likely to test 24,580 and 24,534 ( PE zones).
Break below 24,440 opens downside to 24,397 (unwinding zone).
Strategy: Sell on rise below 24,670 with SL above 24,720.
⚖️ Neutral/Bounce Zone:
Between 24,710 – 24,870:
Choppy moves expected; avoid fresh positions unless breakout confirms.
📌 Key Levels to Watch:
Breakout Level (Upside): 24,870
Breakdown Level (Downside): 24,670
Major Support: 24,397
Major Resistance: 25,170
Bharat Dynamics Ltd (BDL)🚀 BDL - Technical Breakout in Play!
Weekly breakout above key resistance zone 🔥
Pattern: Double Bottom ➕ Break of Monthly Mother Candle High
Potential Upside:
🎯 Target 1: ₹1968.50
🎯 Target 2: ₹2590.00

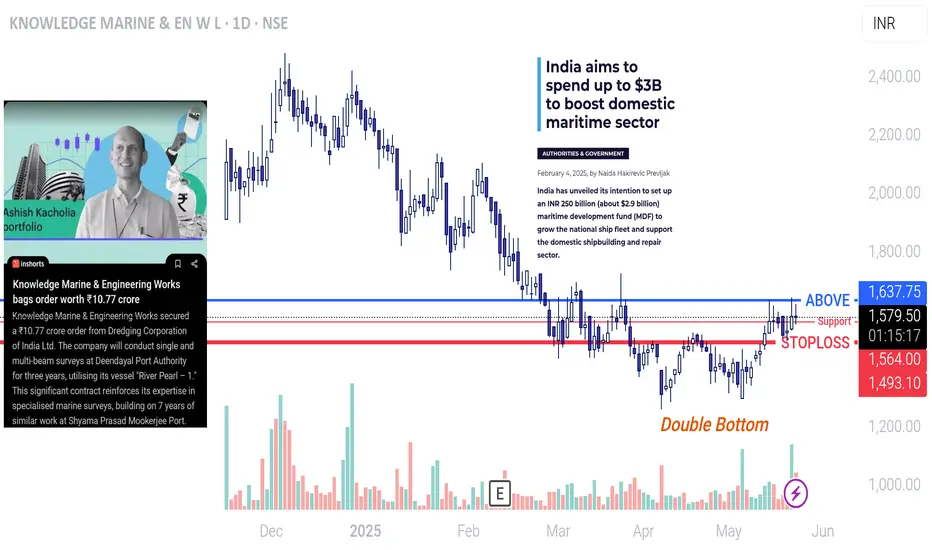
Knowledge Marine & Engineering WorksThe long-term financing plan for the maritime industry was presented by Union Finance Minister Nirmala Sitharaman on February 1, 2025.
As informed, the Government of India will contribute up to 49 percent to the fund, with the private sector, port authorities, financial institutions and other government entities covering the remainder of the sum. The financial assistance will be provided via equity or debt securities, according to the government.
Objectives of the new fund are:
Development of new and modernization of existing ports;
Financial aid for green shipping initiatives;
Investments in ship repair facilities to make India a global shipping hub;
Encouragement of technological innovation in maritime logistics & fleet efficiency.
As per the government, the MDF is primarily intended for financing ship acquisitions, in line with the country’s strategy to increase the share of Indian-flagged vessels to 20% by 2047.
What is more, the enriched domestic fleet would reduce dependency on foreign ships and improve the balance of payments, contributing to India’s strategic interests.
The Union Budget also provided a ‘shot in the arm’ to India’s domestic shipbuilding industry after it announced new mega shipbuilding clusters in the country in an effort to increase the range, categories, and capacity of ships. The proposed allocation of ₹6,100 crore ($700 million) aims to support India’s existing shipyards in upgrading, modernizing, and automating their operations, enhancing efficiency, utilization, and overall output.
Furthermore, the Union Budget has extended the Shipbuilding Financial Assistance Policy (SBFAP) 2.0, aimed at providing direct financial subsidies to Indian shipyards. This initiative seeks to help in securing orders by offsetting operational cost disadvantages, thereby strengthening the domestic shipbuilding industry.
“It is reassuring to see that the budgetary initiatives for India’s marine sector are focused on unlocking its vast potential and enhancing existing assets through upgrades, modernisation, and automation. A key highlight is our ministry’s development of new shipbuilding clusters of 1.0 to 1.2 Million Gross Tonnage (GT) each,” Sarbananda Sonowal, The Union Minister of Ports, Shipping & Waterways, commented.
“This strategic push is crucial in realising India’s vision of becoming a $30 trillion economy by 2047. By leveraging the Public-Private Partnership (PPP) model, the scheme is designed to attract private investment, promote modernisation, and advance green technologies. These efforts will enhance India’s global competitiveness, drive sustainable growth, and solidify its position as a leading Global Maritime Hub.”
Another innovative scheme announced in the budget is the shipbreaking credit note to promote the circular economy. This scheme incentivizes ship scrapping by issuing a credit note of 40% of the scrap value which can be reimbursed to buy new ‘Made in India’ ships.
Finally, large ships will be now accounted as infrastructure assets, enabling easy access to long-term financing and tax incentives. This will help attract private investments in the maritime sector and enhance fleet modernization, according to the government.
RelianceDaily chart is showing price is at double bottom support. In lower time frame price is moving inside a descending channel.
Buy above 1411 with the stop loss of 1401 for the targets 1421, 1434, 1446 and 1458.
Sell below 1390 with the stop loss of 1401 for the targets 1380, 1366, 1354 and 1340.
Always do your own analysis before taking any trade.

Confidence Petrol ltd., Looking good ; min 50% Roi ; swingFor short term investment ;
Leave a " Like If you agree " .👍
.
Wait for small retracement & daily candle to close above - "57.50" .
Trade carefully untill ENTRY level.
.
Entry: 57.5
Target: 61-66-73-81
sl: 53
major stoploss/ support: 44.5.
.
Enter only if market Breaks and retrace and support above
"Yellow box" mentioned.
.
.
Don't make complicated trade set-up.📈📉
Keep it " simple, focus on consistency "💹
Refer our old ideas for accuracy rate🧑💻
Follow for daily updates👍
.
Refer old posted idea attached below.

Gabriel India -Double Bottom Breakout!📊 Gabriel India - Positional Breakout Trade
🔍 Technical Overview:
✅ Trend: Strong uptrend, followed by a 32% correction and a double bottom formation .
✅ Breakout Confirmation: Cleared ₹565 resistance with strong volume.
✅ Key Levels:
Entry: Above ₹600 (Earlier breakout was at ₹565)
Stop Loss: ₹475 (Closing basis) 🔻
Positional Target: ₹824 (Tentative) 🎯
✅ Moving Averages: Trading above key DMAs, indicating strength.
✅ Market Condition: Stock is breaking out early as markets show signs of recovery.
⚠ Risk Management & Position Sizing:
Risk per trade: More than 20%, so position sizing is 🔑.
Recommended Approach:
Enter 25% now and accumulate on retest.
Do NOT go all-in – respect SL at all costs! 🚨
Current market structure: Still in LL-LH (Lower Low - Lower High). This could be a counter-trend pullback or a bull trap—stay cautious.
📈 Fundamental Overview:
Market Cap: ₹8,463 Cr
Current Price: ₹589
52W High/Low: ₹598 / ₹326
P/E Ratio: 40.2
Book Value: ₹74.9
Dividend Yield: 0.68%
ROCE: 26.7%
ROE: 19.6%
Debt-Free Company 💰
Sales, EPS, and Profits improving YoY 📈
🛑 Final Thoughts:
Market concerns still exist—we don’t know if this is the bottom or a reversal yet.
Control FOMO! Watch for market confirmation before adding aggressively.
If you struggle with risk management, sit on the sidelines—waiting is also a trade.
⚠ Disclaimer:
This is NOT financial advice. Trade at your own risk and follow your own risk management rules. 📉📈

UNIONBANK – Positional Breakout SetupPattern: Double Bottom | W Pattern Inside Channel
Trend: HH-HL Structure | Trading Inside Ascending Channel
Volume: Noticeable Build-Up
DMAs: Trading Above Key DMAs
Stage: Aiming for Stage 2 Breakout
The stock is forming a double bottom (W pattern) inside a well-respected ascending channel, with a clean higher high–higher low structure and visible volume build-up. It's now trading above key DMAs, hinting at underlying strength. With price approaching a key breakout zone, it looks primed for a potential Stage 2 continuation.
🔔 Trade Plan
Entry: ₹143.38+ (on breakout and daily close above)
Stop Loss: ₹121.74 (closing basis )
Target 1: ₹151.72
Target 2: ₹172.83
Risk–Reward Insight 🎯
Risk from entry to SL is ₹21.64.
Reward to Target 1 is ₹8.34 (~1:0.38)
Reward to Target 2 is ₹29.45 (~1:1.36)
While T1 gives a conservative move, the bigger play lies in T2 — the upper edge of a 1-year trading range. This is where smart money tends to scale in.
💡You don’t have to go full throttle on day one.
✅ Consider buying a test quantity above ₹143.38 to assess breakout strength.
If the move confirms with strong follow-through and volume, you can look to add on dips or above T1 with a tighter trailing SL.
This approach helps you ride trends without overexposing yourself early. The key is to stay mechanical and let the setup prove itself.
⚠️ Risk Management is Non-Negotiable
Never ignore your stop loss.
Don't chase.
Stick to your plan and size positions according to your risk appetite.
This setup looks technically clean — but remember: even the best setups fail without confirmation. Let price and volume lead the way.
📌 Disclaimer:
This is not investment advice. I am not a SEBI-registered advisor. All content is for educational purposes only. Please do your own analysis and always trade responsibly.

PARAMOUNT COMA LTD📊 PARAMOUNT COMA LTD (1D) – CMP ₹60.08
📅 Date: May 20, 2025
📈 Exchange: NSE
📌 Ticker: PARACABLES
🧠 Technical Analysis Overview
✅ Bullish W-Pattern (Double Bottom):
Price has formed a strong W-pattern, also known as a double bottom, indicating a potential trend reversal. The neckline breakout above ₹58.00 confirms bullish momentum.
✅ Downtrend Breakout:
The long-term falling trendline has been broken decisively with strong bullish candles and increasing volume – a classic reversal signal.
✅ Volume Spike:
Breakout has occurred with significant volume (1.98M), confirming the strength of the move and hinting at potential institutional entry.
✅ Fibonacci Retracement Levels:
🔶 38.2% – ₹65.69
🟩 50.0% – ₹72.36
🟩 61.8% (Golden Ratio) – ₹79.03
💡 Price Action Strategy
🧱 Key Support & Resistance Levels
🟩 Support
₹58.00 – Previous neckline breakout level
₹50.00 – Mid-range base level
🟥 Resistance (Fibonacci-based)
₹65.69 – 38.2%
₹72.36 – 50%
₹79.03 – 61.8% Golden Ratio
📌 Conclusion
PARAMOUNT COMA LTD has triggered a strong breakout after forming a W-pattern and clearing a key trendline. With volume confirmation and upside potential toward Fibonacci levels, this could be a promising swing trade setup. Retesting ₹58 zone could offer a perfect entry opportunity.
📌 Disclaimer:
This is for educational purposes only. Not financial advice. Always do your own research or consult a financial advisor.

TATAMOTORS DOUBLE BOTTOM BREAKOUTTatamotors giving double bottom reversal breakout
if suatain can reach to 780-820
breaking above levels will give more upside
good RSI,RSIdivergence
good volume building up
DO YOUR OWN RESESARCH BEFORE INVESTING

Grasim is fitting Harmonics for 2800Grasim seem to have taken support at previous reversal zone. As per the pattern it can touch 2700,2740, 2800 respectively.

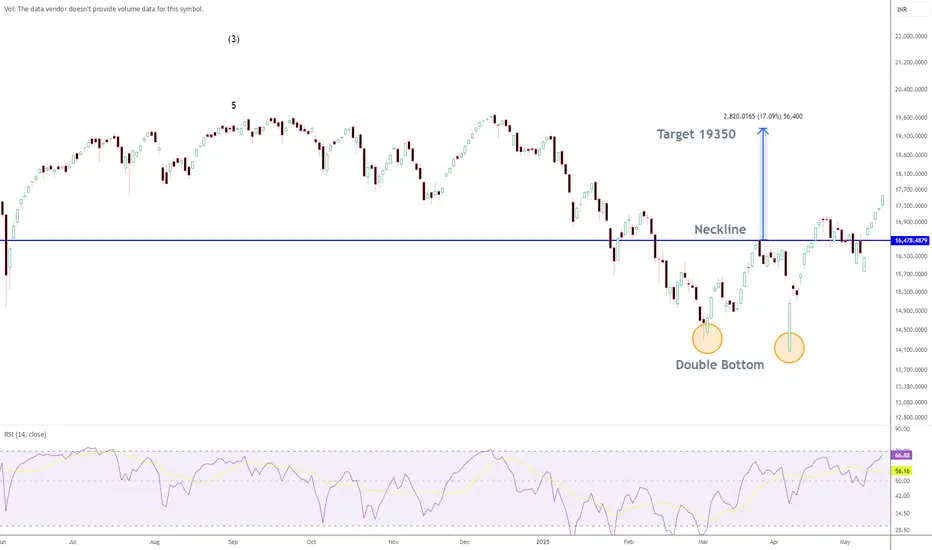
Nify Small Cap Index TargetA double bottom is seen in Nifty Small Cap Index and the Index has decisively broke above the neckline. The target for Index is close to 19350 based on double bottom projection
SARDAEN - Breakout WatchlistWhy This Stock?
✅ Base Breakout – Breaking above ₹526.2 with strong volume confirmation (4-5x past trading sessions).
✅ Trading Above Key DMAs – Strong price structure with good RSI.
✅ No Left-Side Resistance – Clean chart structure with potential for an uptrend.
✅ Formation of W Pattern + VCP – Classic bullish continuation setup.
✅ Resisted Market Fall – Showcasing relative strength despite overall weakness.
Safe traders wait for a weekly close above the break-out level ₹526.2.
Key Levels
📌 Entry: ₹538.50
📌 SL (Closing Basis): ₹423.10
📌 Breakout Level: ₹526.2
Fundamentals (Key Metrics)
Market Cap: ₹18,979 Cr.
Stock P/E: 27.9
ROCE: 15.3%
ROE: 14.1%
Sales Growth (YoY): Improving
OPM % YoY Improving
EPS YoY: Improving.
What Could Go Wrong?
⚠️ Overall Market Trend is Bearish – Any weakness in broader indices can drag the stock down.
⚠️ Sectoral Index is Weak – Lack of sectoral strength may limit upside potential.
⚠️ High SL Probability – Strong pullbacks can invalidate the breakout; hence, buy test quantities only.
⚠️ Deep SL
Why This is Worth Watching?
📈 Stocks that Fell Less in Correction – Often become early movers when the market stabilizes.
📈 Volume Picking Up – A good sign that institutional interest might be present.
🚨 Disclaimer: This is not a trade recommendation but a watchlist alert. Do your own research before making any trading decisions. 🚨
