BDL – Weekly W-Pattern + Sector Strength + Volume Surge 📈 BDL – Weekly W-Pattern + Sector Strength + Volume Surge = High-Potential Positional Setup
BDL is showing textbook technical confluence at the right time:
Sector: Defence index at all-time highs
Stock: BDL forming a clear double bottom (W-pattern) over several months
Weekly breakout underway with strong green candle and volume confirmation
Structure: Rounded base, higher lows, long support holding strong
Price just broke key levels with momentum — setup for multi-leg positional rally
🧠 Technical Highlights
✅ W-pattern (double bottom) over weekly chart confirms accumulation & reversal
✅ Price breakout from neckline zone around ₹1,525+
✅ Clean structure with support zone holding for 8+ months
✅ Volumes rising with the breakout — early signs of trend continuation
✅ Defence sector tailwind active
🧮 Setup Overview
Entry Zone ₹1,530–₹1,540
Stop Loss (SL) ₹1,293.95
ATH Resistance ₹1,799.45
Target (Positional) ₹2,363.55
SL % −15.38%
Target % +54.34%
Risk : Reward 1 : 3.5
📊 Strategy Recommendation
Add 30–40% position now
Add more on clean ATH breakout or base retest with volume
Avoid full position in one shot — shakeouts possible on weekly charts too
Let volume lead the move — don’t pre-empt full size
⚠️ Cautionary Note:
While the setup is structurally strong, remember:
Markets are still volatile
Sudden sector pullbacks or macro headlines may affect entries
Stick to position sizing and respect your stop loss
📌 Summary
BDL is setting up for a high-reward positional breakout fueled by a confirmed W-pattern, sector momentum, and volume surge. Structure is tight, risk is defined, and the upside potential is significant.
📉 Disclaimer:
This is not a buy/sell recommendation. For educational purposes only. Do your own research and manage risk as per your capital and style.
Double Top or Bottom

BEL – Sector Strength + Double Bottom + Volume Thrust 📈 BEL – Sector Strength + Double Bottom + Volume Thrust = A Setup Worth Tracking
The India Defence Index just broke into new all-time highs, possibly driven by rising geopolitical tensions — but beyond the headlines, the sector remains structurally strong.
BEL (Bharat Electronics Ltd) is showing powerful confluence:
A double bottom breakout
Sectoral support
Rising volumes
Key moving averages reclaimed
All of this sets up a technically sound positional opportunity.
🧠 Technical Highlights
✅ Stock trading above key DMAs
✅ Volume picking up — watch for 4x–5x surge to confirm strength
✅ ATH at ₹339.90 may act as resistance; clean breakout above it = add/fresh entry
✅ Defence sector index at ATH – macro tailwind active
🧮 Setup Overview
Entry Zone ₹32.7
Stop Loss (SL) ₹287.65
ATH Resistance ₹339.90
Target (Positional) ₹399.10
SL % -10.09%
Target % +24.72%
Risk : Reward 1 : 2.45
🧭 Suggested Strategy
🔄 Add 30–40% at breakout
🧘 Wait for pullback or retest to add more
🚫 Avoid chasing — shakeouts are very likely
🧠 Gradual accumulation + disciplined risk management > FOMO
📊 Volumes should confirm — clean candle with strong demand = green signal
⚠️ Final Note:
We are not entirely out of danger — markets can throw brutal pullbacks and false breakouts. Defensive positioning, proper sizing, and exit planning are essential.
📉 Disclaimer:
This is not a buy/sell recommendation. For educational purposes only. Do your own research and manage risk as per your trading style.

HFCL Ltd – Order-Block Rally in Play?Timeframe: Daily | CMP: ₹81.90
Key Zones:
🟢 Demand Zone: ₹72–₹75 (multiple pin-bars & buys)
🟡 Order-Block Resistance: ₹85–₹88 (prior supply area)
🔴 Major Supply Zone: ₹110–₹112 (big block of sellers)
What’s Happening?
Strong Bounce: Price hit the ₹72–₹75 support twice and rallied sharply—classic demand‐zone confirmation.
Projected Path: Green arrow shows a likely move into the order-block at ₹85–₹88, where institutions tend to sell.
Pullback & Secondary Swing: After tagging ₹88, expect a mild pullback into ₹82–₹85 before a second leg higher toward ₹110.
Trade Plan
Aggressive Entry: ₹80–₹83 on dips.
Primary Target: ₹88 (first profit-book).
Secondary Target: ₹110+ for swing holds.
Stop-Loss: Below ₹72 (daily close).
💡 Why This Is Smart Money Setup
Order-Block Trade: Institutions accumulated at demand, will distribute at supply.
Clear Risk Zones: Defined stop below ₹72 and first resistance at ₹88.
High Reward/Risk: > 2:1 upside vs risk.
💬 Your Take?
Do you see HFCL riding this order-block bounce? Drop your comments below! 👇
#HFCL #OrderBlock #TechnicalAnalysis #DemandZone #SwingTrade #ChartPatterns #SupplyDemand #SmartMoney #PositionalTrading #PriceAction

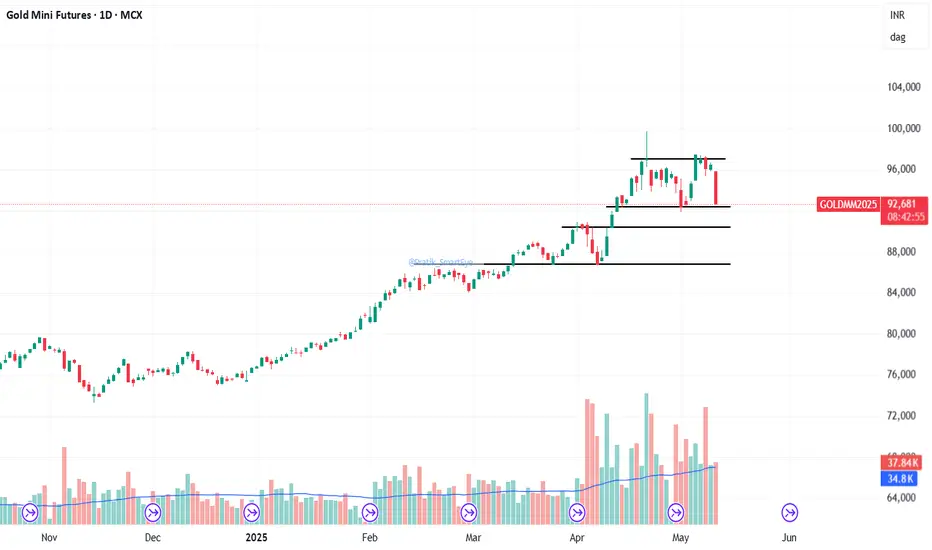
Gold: CMP 92,800. Forming a double top pattern. Gold: CMP 92,800. Forming a double top a bearish pattern. Break below 92,300 will take it to support levels of 90,400 / 86,800.
It's a Technical View.
Sustained reversal from support levels can be an addition point.
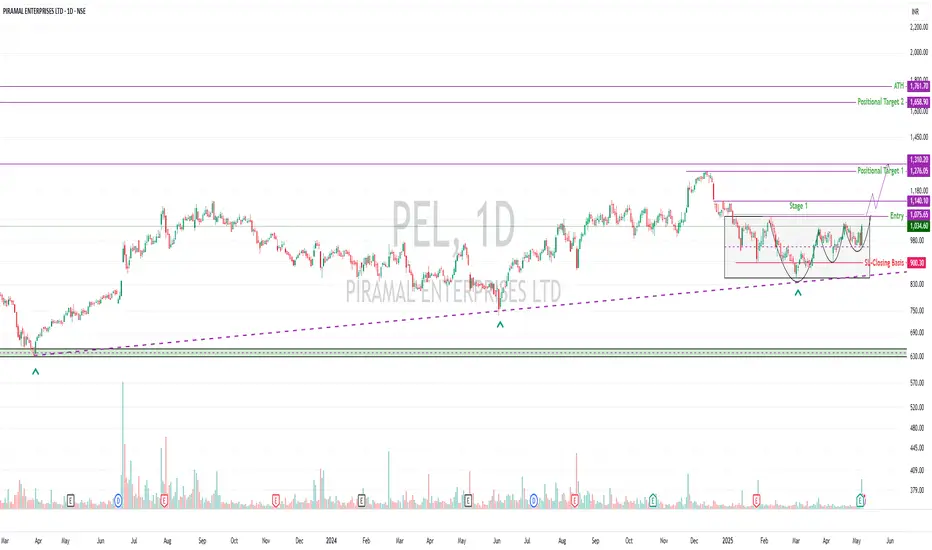
Piramal Enterprises| VCP traits | Breakout on volume📈 PEL | Piramal Enterprises Ltd
Multi-month base | VCP traits | Breakout on volume watch
🔍 Technical Highlights:
Volume spurt: 5x relative to recent sessions – clear institutional interest 🧠
Bullish engulfing candle on 7 May 2025, signaling a strong reversal attempt
Closed above 200 DMA, trading above 50 DMA, and just above 30 WMA – early signs of trend re-alignment
Price is forming a VCP-like structure within a Stage 1 base
Breakout is aligning with a Higher High–Higher Low (HH–HL) structure
Took support at a rising trendline that’s been respected since April 2023
⚠️ Key Risk Considerations:
Fundamentals are weak – poor ROE & ROCE, and RSI is unimpressive
Broader market is not supportive — Nifty 500 is still below 200 DMA
This may be an early breakout attempt — confirmation is everything
No clean follow-up yet post breakout day – wait for continuation
🧭 Why Watch This?
Despite fundamental weaknesses, technicals are improving rapidly:
Volume is stepping up
Price is testing long-term moving averages
Structure is getting tighter (VCP traits visible)
A clean breakout and follow-through above ₹1,075–₹1,140 could unlock Stage 2 potential
🎯 Trade Levels:
Entry: Above ₹1,075.6 (confirmation required)
SL (Closing Basis): ₹895.2
Positional Target 1: ₹1,276
Positional Target 2: ₹1,658
ATH Review Zone: ₹1,761
💰 Risk–Reward
Risk = ₹1,075.6 – ₹895.2 = ₹180.4
Reward to T1 = ₹1,276 – ₹1,075.6 = ₹200.4 → R:R = 1 : 1.11
Reward to T2 = ₹1,658 – ₹1,075.6 = ₹582.4 → R:R = 1 : 3.23
🛡️ Trader's Note
Position sizing is not optional — it's your only protection.
This is a setup driven by volume, structure, and levels — not by fundamentals.
If this breakout holds, momentum traders may pile in — but don’t front-run it blindly.
📌 Quarterly results are around the corner — trade with caution as earnings volatility can invalidate technicals.
📌 If price reaches ATH, review for new risk-reward alignment and partial booking.
📜 Disclaimer: This is a technical perspective, not investment advice. For educational purposes only. Trade safe, trade smart.
PLong
Sell INDUSTOWER @384 with Target 340 and SL 39503th May 2025 / 1.50 PM
Sell INDUSTOWER @384 with Target 340 and SL 395
1. Stock made clear false BD
2. Entered in the parallel channel again
3. Good volume on 02 May 2025
4. Expecting correction from here till 340.
Expected Targets and SL are mentioned in Chart
Note: Short term aggressive price downside possible

TIINDIA – Fundamental View with Technical TriggersTube Investments of India Ltd (TIINDIA) has been a notable player in the Indian engineering sector, with a diversified portfolio spanning automotive components, bicycles, metal-formed products, and precision steel tubes. As of April 2025, the stock has experienced significant volatility, prompting investors to closely examine its fundamentals and technical outlook.
📊 Fundamental Overview
Valuation Metrics:
Price-to-Earnings (P/E) Ratio: Approximately 61.5, indicating a premium valuation compared to industry peers.
Price-to-Book (P/B) Ratio: Around 9.4, suggesting the stock is trading at a high multiple of its book value.
Earnings Per Share (EPS): ₹42.43, reflecting the company's profitability.
Financial Performance:
Revenue (TTM): ₹182.5 billion.
Net Income (TTM): ₹8.13 billion.
Gross Margin: 31.38%.
Net Profit Margin: 4.45%.
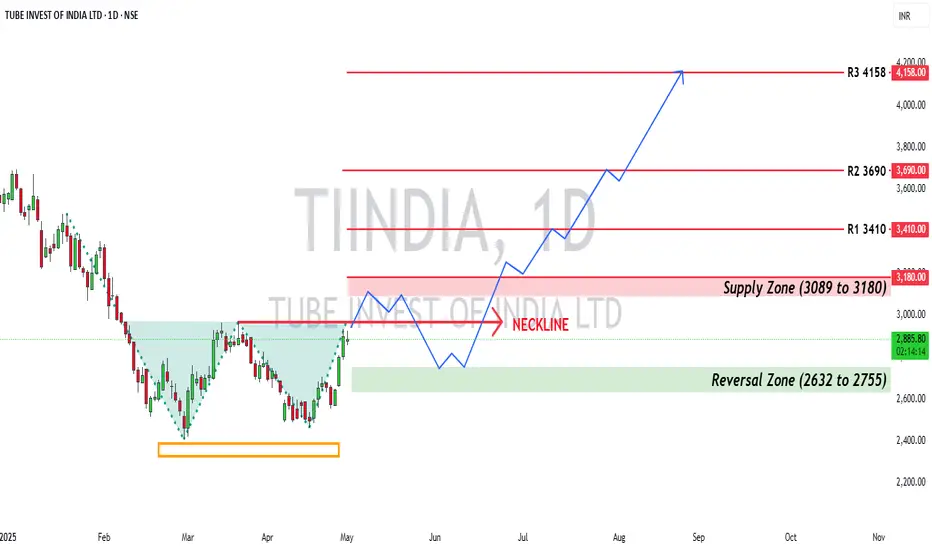
Tube Investments of India Ltd (NSE: TIINDIA) is exhibiting a classic double bottom pattern on the daily chart, signaling potential reversal strength. While fundamentals reflect a strong industrial play with high valuation multiples, the technical setup suggests a critical moment for traders to watch.
📉 Technical Analysis (Daily Timeframe)
Pattern: Double Bottom
Neckline Breakout Zone: ~₹2,967.50
Current Structure: The stock has formed a double bottom and is now consolidating near the neckline, awaiting a decisive breakout.
🟨 Immediate Supply Zone: ₹3,089 – ₹3,180
This zone is expected to act as a resistance barrier.
A rejection from here is possible on the first test, especially if volume doesn’t confirm the breakout.
🟩 Support Zone (Bottom Reversal Area): ₹2,632 – ₹2,755
If rejection occurs at the supply zone, this region may provide buy-on-dip opportunities.
Historically respected as a strong demand zone.
🔺 Major Resistance Levels (Above Breakout):
₹3,410 (first major breakout target)
₹3,690 (medium-term resistance)
₹4,158 (long-term breakout target)
📌 Conclusion
TIINDIA is at a make-or-break juncture on the charts. A decisive breakout above ₹3,180 could drive strong upside momentum toward ₹3,410 and beyond. However, traders should watch for a rejection near the supply zone and possible retest of the lower support band before a confirmed move.
ICICI Bank-Aiming for Double Bottom Breakout?ICICI Bank – Technical Analysis & Trade Plan
📈 Trend Analysis:
Stock is in a strong uptrend with a higher high, higher low (HH-HL) structure intact.
Consolidating since September 2024, forming a base.
Double bottom formation visible, with a potential VCP (Volatility Contraction Pattern) at play.
Trading above key DMAs, confirming strength.
Sectoral strength: Finance & banking showing momentum and could lead the next market move.
📊 Market Context:
Broader market is showing slight improvement but still in a lower low, lower high (LL-LH) structure.
Index closed above 50 DMA, gaining some momentum, but another round of correction cannot be ruled out.
The main reason for selecting this stock is strong sector movement.
🔍 Trade Plan:
✅ Entry: Above ₹1,328
🚨 Immediate Resistance: ₹1,363
📌 Add more: If ₹1,363 is broken with strong volume
🎯 Positional Target: ₹1,555
❌ Stop Loss (SL - Closing Basis): ₹1,180.45
📉 Risk & Reward Calculation:
Risk (SL to Entry): ₹1,328 - ₹1,180.45 = ₹147.55 (~ 11.11% downside risk)
Reward (Entry to Target): ₹1,555 - ₹1,328 = ₹227 (~ 17.1% upside reward)
Risk-to-Reward Ratio (R:R): 1:1.54 (Moderate reward vs. risk)
⚠️ Risk Considerations:
Overall market still in LL-LH structure → Could just be a pullback within a broader downtrend.
Position Sizing Key:
Consider entering only 30% of the usual position size.
Gradual accumulation near ATH (All-Time High) levels is a wise approach.
📢 Disclaimer: This is not financial advice. Trading involves risk, and past performance does not guarantee future results. Always do your own research and use proper risk management .

TUBE INVEST OF INDIA LTD – Double Bottom Pattern
1. Pattern Analysis
The stock is currently showing a confluence of two powerful patterns across the weekly and daily timeframes. On the weekly chart, we identify a Rising Broadening Wedge Pattern that spans over 4.2 years. This is a long-term structure that generally signals trend exhaustion or a pending volatile breakout. The price action has reached the lower support boundary of this pattern, indicating a possible bullish reversal setup from the broader wedge formation.
On the daily chart, a Double Bottom Pattern has formed over the last 3 months. This is a classic bullish reversal pattern, and the recent price action has confirmed a breakout above the neckline, suggesting that the stock may have completed its basing phase and is now moving into a new uptrend. The pattern is well-defined, with two clear troughs and a neckline near ₹2900 that was tested and taken out with strong bullish candles.
2. Volume Analysis
Volume plays a supportive role in this bullish confluence. On the daily timeframe, the breakout above the double bottom neckline was accompanied by a sharp increase in volume, showing buying conviction. This volume expansion further validates the breakout, as it's not occurring on low or average volume. Institutional interest or smart money accumulation can be inferred from this volume burst near the breakout level.
On the weekly chart, the volume trend aligns with the recent bounce from the wedge's lower boundary. While volume has been relatively moderate during the decline, the recent weekly candle shows a significant pickup in traded quantity, especially as the price pushed off the long-term trendline. This indicates fresh demand coming into the stock after a prolonged correction.
3. Candlestick Analysis
The daily chart presents a bullish narrative through a series of strong green candles. The breakout candle from the double bottom formation is a large bullish candle with little to no upper wick, indicating a decisive close near the day’s high. Preceding this, there were several smaller bullish candles with higher lows, indicating growing buyer control.
On the weekly chart, the price has formed a bullish engulfing candle near the support of the broadening wedge. This is a notable candlestick pattern in itself, showing that buyers have decisively stepped in to reject lower levels. The close near the highs of the week adds strength to this signal, suggesting that downside may have been exhausted in the near term.
4. Validation of Signal
The combination of the double bottom breakout on the daily timeframe and the bounce from the wedge support on the weekly timeframe creates a strong bullish confluence. The breakout is well-supported by volume, and the candlestick structure confirms momentum. Moreover, price is now trading above both the double bottom neckline and the broad diagonal support, confirming that the setup has transitioned into a valid bullish trend reversal.
The upward structure aligns with both breakout theory and trendline validation. This dual-timeframe confirmation improves the reliability of the signal and increases the odds of continuation toward higher targets. The alignment of short- and long-term technicals offers conviction to swing traders as well as medium-term investors.
5. Tradable Points Determination
Entry Point Determination
A favorable entry lies in the zone of ₹2850 to ₹2925, close to the neckline breakout level of the double bottom pattern. Since the breakout has occurred recently, minor retracements or consolidations near this level can offer low-risk buying opportunities.
Target Point Determination
Based on the height of the double bottom formation, the breakout projection offers a near-term target of ₹3350, while the broader rising wedge pattern allows for a medium-term target of ₹3650 to ₹3750 if the trend continues. These projections align with previous swing highs and structural resistance zones.
Stop Loss Placement and Trailing SL Follow-Up
A logical stop loss should be placed below the second bottom of the double bottom, around ₹2600. This gives the trade room to breathe while staying below key support. Once the price sustains above ₹3100, traders can trail the stop loss to ₹2850 to protect capital and ride the trend toward upper targets. For positional traders, a weekly closing below the broadening wedge support line would invalidate the current bullish view.

Mazagon Dock| VCP & Double Bottom – Watch for a Breakout!Mazagon Dock ⚓ | VCP & Double Bottom – Watch for a Breakout! 🚀
Mazagon Dock (MAZDOCK) is forming a Volatility Contraction Pattern (VCP) + Double Bottom on the weekly chart. A potential breakout is in play.
📌 Entry: Above 2671 (preferably on a daily close).
📌 Immediate Resistance: 2966 (All-Time High). Watch price action at this level. A strong breakout with volume could signal further upside.
📌 Stop-Loss: 2201 (Daily close). ⚠️ SL is deep (~17.6%), so position sizing is critical.
Trading Strategy & Risk Management 🛡️
🔹Breakout Entry: Small position above 2671 with a tight SL for safety.
🔹Retest Strategy: If a breakout occurs, watch for a retest of 2671 as support.
🔹Volume Confirmation: A strong breakout with volume can signal continuation.
🔹Risk Factor: Already up 1600%+ from lower levels, so profit booking pressure is expected.
🔹 The Broader Market is not in a safe territory yet – gradual accumulation is advised.
🔹 Wait for a clean breakout → Start with a small position.
🔹 Market conditions matter – If the market weakens, even strong setups can fail.
Stock Behavior & Market Context 📈
Mazagon Dock has a history of breakout-consolidation-breakout moves. It has already surged 1600%+, making risk management essential. Many investors are sitting on heavy profits, so expect volatility.
🚢 Defense & Shipbuilding Outlook:
India is heavily investing in defense manufacturing, with Make in India boosting the sector. The naval expansion plans and growing demand for warships & submarines could provide strong tailwinds for MAZDOCK in the long run. Government contracts & global interest could further fuel its growth.
Final Thoughts
2025 is shaping up to be a year where risk management will be key. Early entries help reduce risk, but sticking to the stop-loss is non-negotiable. Keep this on your radar and trade light!
This setup has high potential but requires discipline. Position sizing and SL adherence are key due to the deep stop loss. If the market remains bullish, MAZDOCK could see a multi-month breakout.
🔥 Will history repeat? Can MAZDOCK deliver another breakout rally? Let’s see!

Mangalore chemical:(Ready to shoot up); Take a look; Min 50% RoiHuge potential is there.
For short term investment ;
Leave a " Like If you agree ". 👍
.
.
Wait for Breakout & then Daily candle to close above - "135"
.
If you want to enter now "Go for it with stoploss".
.
.
Enter after Price Breaks
"Yellow box" mentioned.
.
Don't make complicated trade set-up.📈📉
Keep it " simple, focus on consistency " 💹
Refer our old ideas for accuracy rate🧑💻
Valuable comments are welcomed-✌️
.
Follow for regular updates.👍
MLong

TATACONSUM – Cup & Handle Breakout | VCP Formation🔍 Technical Overview:
The stock has broken out of a classic Cup & Handle pattern.
Early bird entry was around ₹1143.45.
Currently trading near the 1-year ATH resistance at ₹1253.85.
A Volume Contraction Pattern (VCP) might be playing out, with visible contractions and tight price action in the handle.
Strong volume spikes seen during recent upmoves—indicating institutional interest.
📊 Price Levels:
📍 Entry Zone: ₹1143.45 – CMP
📍 Resistance to watch: ₹1253.85 – Breakout above this with volume can propel the stock higher.
📉 Stop Loss: ₹993.50 (on closing basis)
✅ Trading well above key DMAs (50, 100, and 200)
🌐 Market Context:
While Nifty is holding above its 50 & 200 DMA, the Nifty 500 index is still below the 200 DMA, indicating broader market caution.
Expect volatility and shakeouts in the near term.
Market breadth is improving but risk management remains crucial.
⚠️ Risk Note: The current setup is promising, but given the broader market's fragile structure, strict SL adherence and position sizing is key.

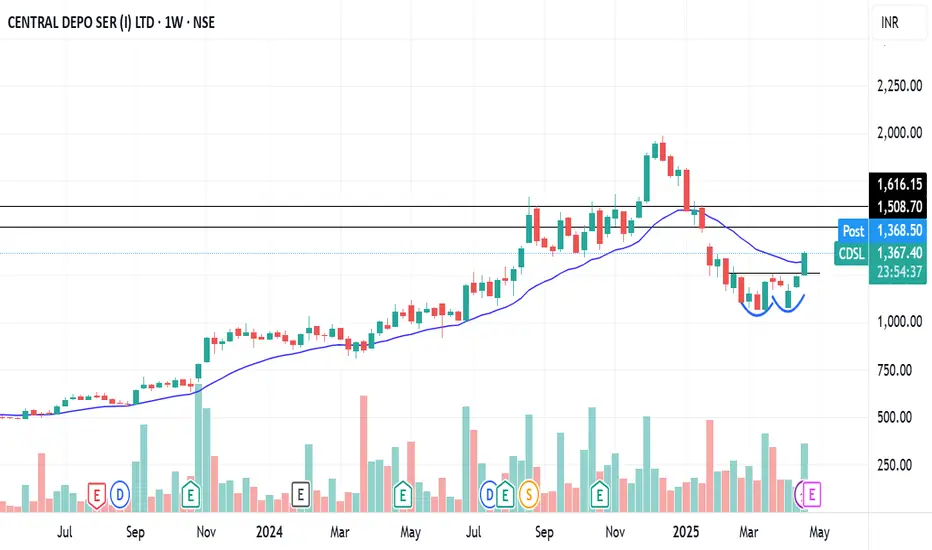
CDSL DOUBLE BOTTOM BREAKOUTCDSL breaking double bottom reversal pattern weekly
with huge volume,rsi positive zone
on the verge of MACD crossover
breaking 20 ema
after breaking 1400 with good volume
#target 1500 then 1600
NO BUY/SELL RECOMENDATION
M$M DOUBLE BOTTOM BREAKOUT M&M breaking double bottom weekly
with good volume since few week
RSI good, RSI divergence
breaking 20 ema also
#target1 3100 breaking it
will reach #target2 3230
NO BUY/SELL RECOMENDATION

ASHOKLEYLAND DOUBLE BOTTOM BREAKOUTAshokleyland breaking double bottom reversal pattern
with good volume buildingup
bullish rsi,rsi divergence
#target 228,after breaking 228 only
#target 236
NO BUY/SELL RECOMENDATION

TATA CHEMICALPrice has formed a double bottom in the daily timeframe. Currently, the price is trying to break resistance moreover there’s an ascending triangle, cup and handle pattern in 15 mins TF. We can go long if price breaks this level.

Fino payment bank is on bullish reversal mode.Fino payment bank is on bullish reversal mode.
As per chart it forms double bottom pattern with divergence and also showing confirmation of morning star on monthly chart.
It may test level 444 soon, 80% returns.

Muthoot Microfin LTD – Major Breakout in Play!🟦 Blue Line: 200 DEMA
Still overhead, but the recent price action indicates a potential shift in trend. Price reclaiming above this zone will be another bullish confirmation.
📌 Breakout Highlights:
Counter Trendline Breakout: Price shattered the CT-based trendline with high volume.
W-Bottom Formation: A textbook double bottom structure is visible with neckline breakout.
Green Path: Illustrates the bullish trajectory already played out post breakout.
Red Zone: Key resistance turned support — now a potential demand zone on retest.
Yellow Path: A healthy retest scenario could play out, offering better R:R entries. A pullback to the neckline before continuation would be ideal.
🔔 Keep it on your radar — structure, volume, and trend all align for a bullish bias.

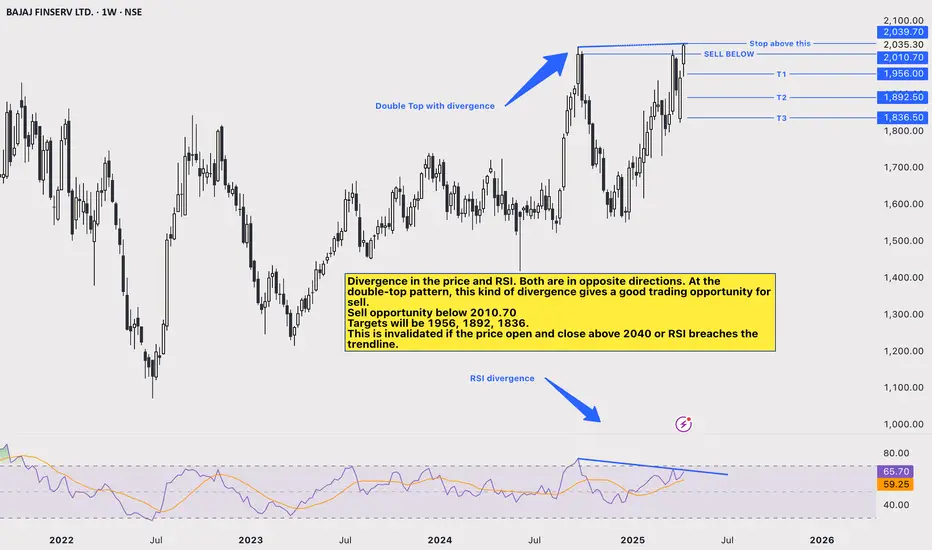
Bajajfinserv Double Top: Bearish Divergence in the price and RSI. Both are in opposite directions. At the double-top pattern, this kind of divergence gives a good trading opportunity to sell.
Sell opportunity below 2010.70
Targets will be 1956, 1892, 1836.
Stop loss is a few points above high at around 2042-45
This is invalidated if the price opens and closes above 2040 or RSI breaches the trendline.
Breakout in Banknifty Bnaknifty index has given breakout above 52100 mark with good short covering and closed at days high. After making double bottom at 47800 range, banknifty is heading towards 53400-53500 mark. Above 53700, attempt to make new all time highs will be there.

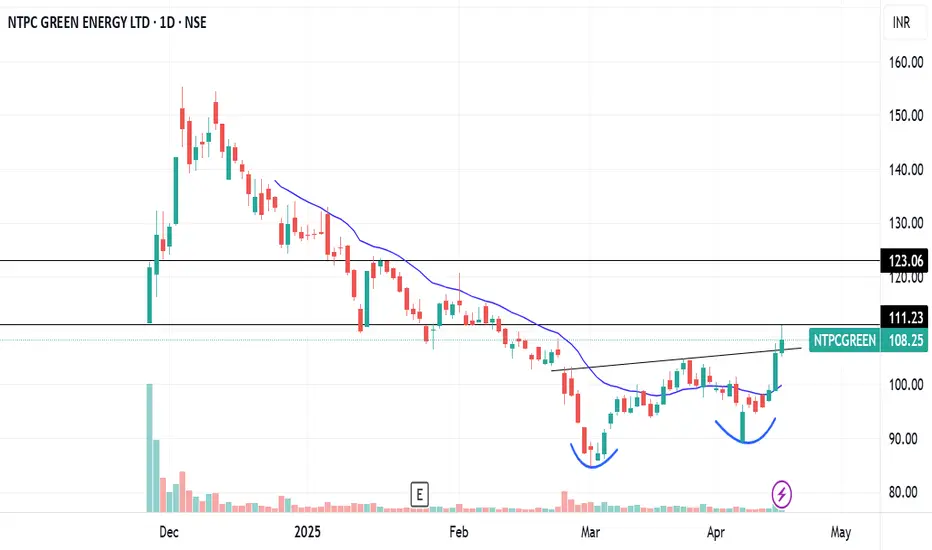
NTPCGREENENERGY DOUBLE BOTTOM BREKOUTNtpcgreenenergy breking double bottom reversal pattern
with huge volume builtup, bullish rsi
macd crossover completed
breaking 111 can give upmove
#target 123 after 111
NO BUY/SELL RECOMENDATION
E-Commerce - Still BearishRe-publishing chart after updating zomato as eternal ltd. After double top formation, e-commerce still looking bearish. So far HH-HL formation not formed even in daily chart. Trendline hasn't broken out. Technical indicators are weak with no momentum. 12431 would be pivot point.

ACI - Double Bottom (Bullish)Archean chemical industries is a leading specialty marine chemical manufacturer in India focused on producing and exporting bromine, industrial salt, and sulphate of potash across the world. Archean is the largest exporter of bromine and industrial salt in India and has amongst the lowest cost of production globally in both bromine and industrial salt.
Fundamentally sound company with PEG 0.79, ROE, ROCE, ROIC > 15%.
Technicals: Price is above 200MA. Double bottom formation after bearish Head & Shoulder. Trendline is about to breakout. Volumes have been steady in daily chart over the last 5D. Both DII, FII institutions have been increasing the stakes steadily in every quarter. 161.8% fib level would be long term target of 1069 which is also pivot R3 in weekly timeframe. Pivot targets are shown on chart.
Disclaimer: Educational purpose.
