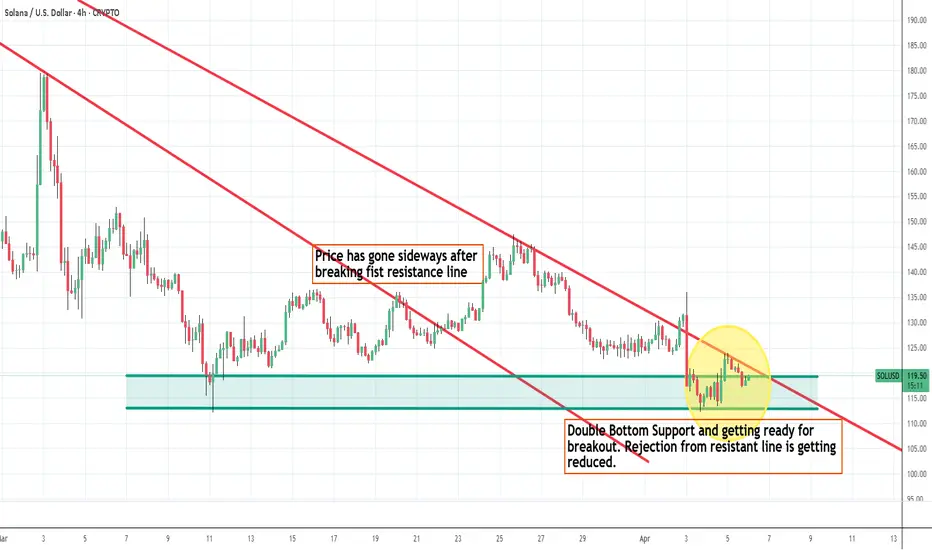
SOL - Getting ready for Big Breakout.Price has taken double bottom support. Price rejection from second resistance line is getting reduced. Any up move from BTC, SOL will give bigger breakout for sure. So trend will follow in whichever side price breaks the lines. I think not much downside can be seen in SOL since it has fallen from 250 levels to this low. SOL is next to BTC and ETH right now and its widely used. Price is at very attractive levels keeping ETF approvals in few weeks or 2 months this year. SOL is also one of the coins for strategic reserve.
Double Top or Bottom
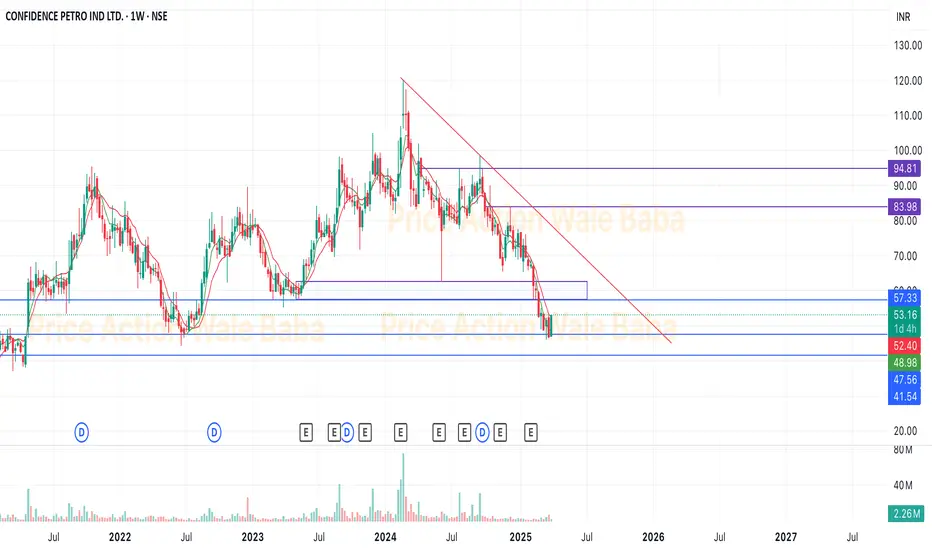
Confipet - 1W TimeframeConfipet looks like a bottom out and good to buy here.
Making a W pattern on 1-day timeframe and as we know crude oil price also going down so it will help in the growth of company.
Buy and hold for the next 1-2 year will give you better profit.
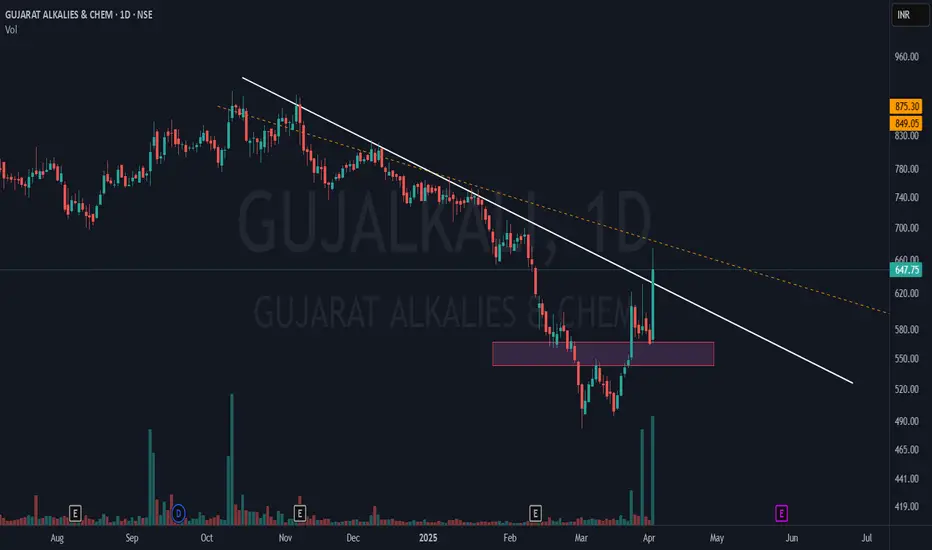
Gujarat Alkalies | Explosive Double Bottom Breakout!📈 Stock: Gujarat Alkalies & Chem (NSE)
💰 CMP: ₹647.75 (+14.50%)
🚀 Why This Chart Stands Out?
✅ Double Bottom Breakout: A textbook bullish reversal pattern with a strong retest.
✅ Supply-Demand Flip: The red zone acted as a resistance, now turning into support.
✅ DTF CT Resistance (White Line): Broken! A major trendline breakout signals momentum shift.
✅ WTF Resistance (Yellow Line) Next: The last hurdle before a potential strong rally.
✅ Volume Confirmation: Increasing volumes validate the breakout, showing buyer confidence.
🔥 A perfect mix of breakout, volume, and price action! Ready for the next leg up? Comment below! 👇
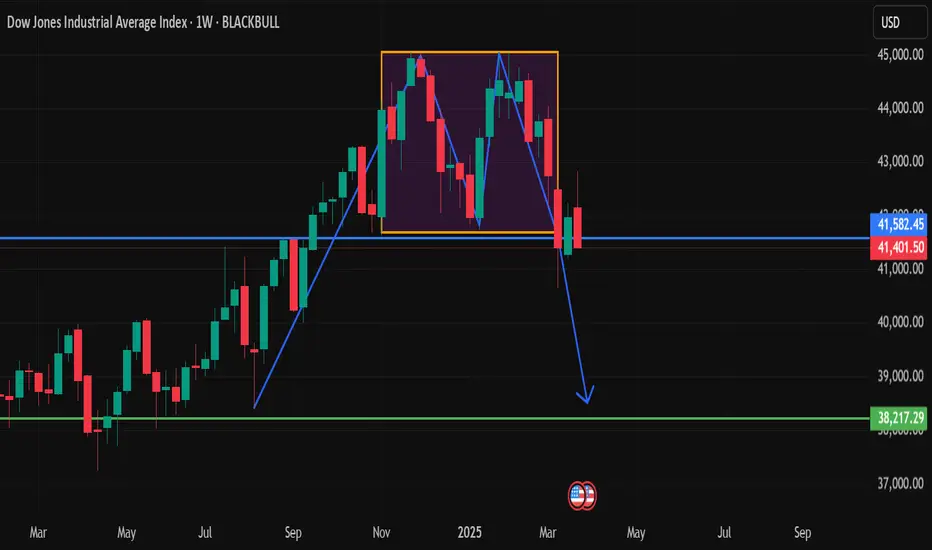
US30 Weekly Analysis: Double Top Breakdown and Bearish OutlookThe Dow Jones Industrial Average (US30) has exhibited a clear double top formation on the weekly timeframe, signaling a potential bearish reversal. The price recently broke below the neckline support around 41,400, confirming the pattern and suggesting further downside movement.
Price action
Analysis
1. Double Top Formation
• A double top is a classic reversal pattern that occurs after an extended uptrend.
• The two peaks were formed around 42,819.50, where bullish momentum failed to sustain further highs.
• The rejection from this level indicated that buyers were losing strength.
2. Neckline Break and Confirmation
• The neckline support at 41,400 was a critical level that held price consolidation for some time.
• A break below the neckline has confirmed the bearish structure, signaling further downside potential.
• If the price retests 41,400 and rejects, it could provide another opportunity for short positions.
3. Bearish Target Projection
• The double top pattern suggests a measured move equal to the distance between the peaks and neckline (approximately 1,400-1,500 points).
• This projects a downside target of 38,217, aligning with the next major support zone (green line on the chart).
Trading Strategy: Bearish Continuation
• Entry: Wait for a retest of 41,400 and a rejection with a bearish confirmation candle.
• Stop Loss: Place above 41,800, as a break above invalidates the bearish setup.
• Take Profit: First target 39,500, final target 38,217.
• Risk Management: Use proper position sizing to manage risk in case of a false breakout.
Conclusion
US30 is showing strong bearish momentum after confirming the double top breakdown. A successful retest of 41,400 as resistance will likely accelerate selling pressure towards 38,217. We should watch price action closely for confirmation before entering short positions.
Zomato is showing weakness it may test 170 soon.Zomato is weak on monthly and weakly chart. It forms Fake breakout with double top pattern on monthly chart.
As per chart showing weakness on daily chart also as RSI drag below 40. It can short on any rise or here for target 170 soon.

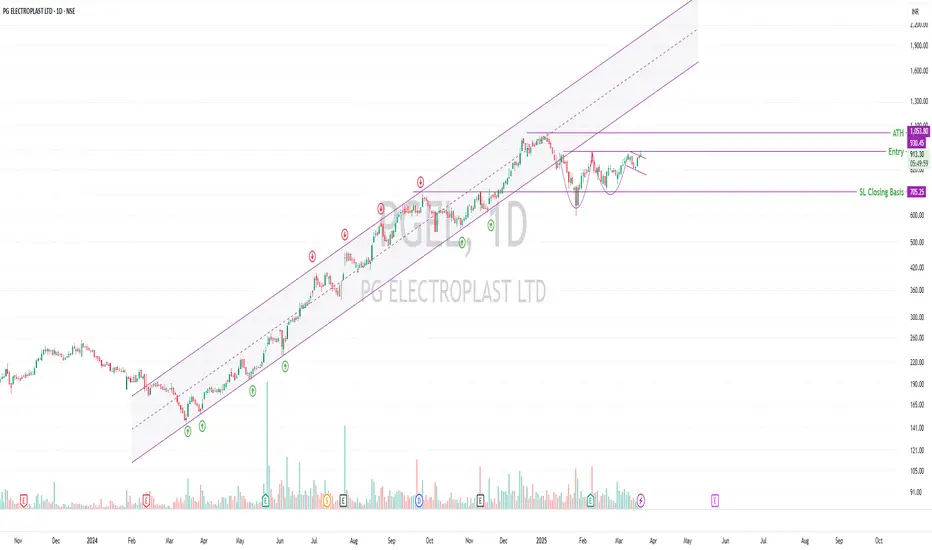
PG ELECTROPLAST LTD (NSE: PGEL):Double Bottom & CNH📈 PG ELECTROPLAST LTD (NSE: PGEL) – Trade Setup & Analysis
🔹 Trend: Stock is in an uptrend, previously a cycle winner. Corrected significantly in the recent market fall but is now recovering and trading close to ATH.
🔹 Technical Highlights:
Trading above key DMAs ✅
Double bottom, VCP, and CNH formation (not textbook-perfect but forming)
Volume missing but RSI improving 📈
Price action near ATH to watch – a high-volume breakout could signal a strong move.
🔹 Key Levels:
Entry: ₹925.70
SL (Closing Basis): ₹705.25 🛑
ATH Resistance: ₹1,053.80
🔹 Market Structure:
LL-LH trend in the broader market, so caution advised ⚠️
Gradual accumulation suggested, wait for confirmation on breakout with volume.
Breakouts are prone to failure in weak markets – risk management is key.
🔹 Fundamentals:
Market Cap: ₹26,226 Cr
Stock P/E: 124 (High Valuation ⚠️)
Book Value: ₹40.5
Dividend Yield: 0.02%
ROCE: 18.7% | ROE: 18.9% ✅
Sales Improving YoY but OPM% needs improvement
EPS Improving, Profits Rising ✅
📌 Final Thoughts:
Monitor price action near ATH – strong volume breakout = potential buy.
Weak market structure means all setups carry a higher failure risk.
Company fundamentals are decent, but valuations are stretched.
🔍 Do your own research before committing capital. This is a potential mover but needs confirmation!
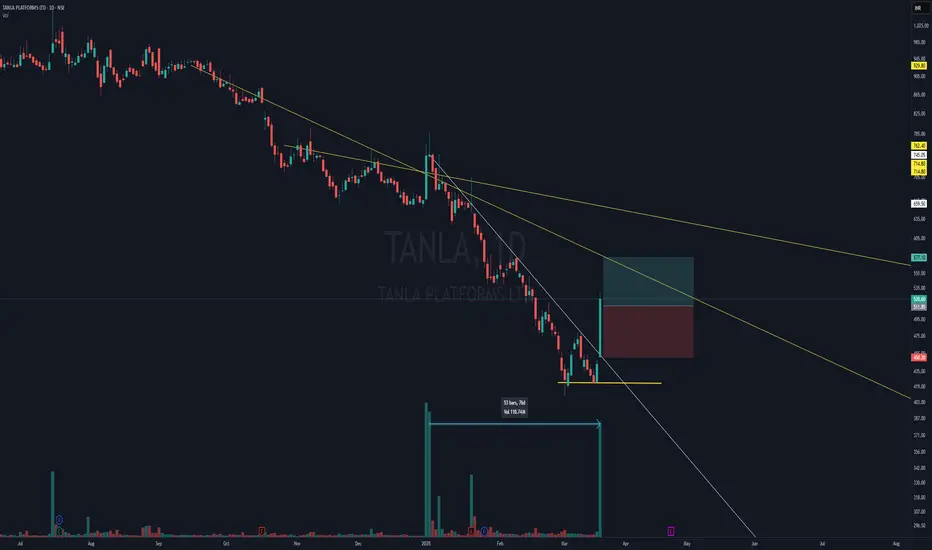
Tanla Platforms Swing -Double Bottom + CT Breakout with Volumes 📈 Technical Breakdown:
Double Bottom Formation at the base, signaling a potential reversal (though weak).
CT Breakout on the Daily Timeframe (DTF) (White Line).
Higher Timeframe (WTF) Resistance Zones marked by Yellow Lines, acting as hidden reactive resistances.
Massive Volume Spike Today – the highest in recent times, confirming strong breakout momentum.
🎯 Trade Idea:
A clean breakout from the CT with blasting volumes suggests a 1:1 trade opportunity at max for now.
Price might face resistance at higher levels, aligning with the yellow CT lines.
Need to watch if price sustains above the breakout zone for further continuation.
💬 Huge volumes—smart money stepping in or a trap? What’s your view? Let me know in the comments! 👇
HAVELLS DOUBLE BOTTOM REVERSALHavells breaking double bottom reversal
with good volume building up
bullish rsi,macd crossover done
#resistance at 1670-1700
NO BUY SELL RECOMENDATION

xagusd double bottom with divergenceXAGUSD create double bottom with morning diji star with rsi divergence if it goes and susstain above nechline then superb bull run can seen.
buy xagusd above 29.88 add more 29 closing sl below 28.75 tg 31.9-33.78

Pearl Global Industries Ltd – Stock Worth Watching!🔹 Why is it Interesting?
✅ Uptrend Intact – Stock continues to move higher.
✅ Higher Highs & Higher Lows (HH-HL) Structure – Bullish price action remains strong.
✅ Respecting Trend Channel – Trading within an ascending channel, bouncing off key levels.
✅ Above Key Moving Averages (DMAs) – Staying strong above critical supports.
✅ Bullish Patterns Forming –
📍 Triple Bottom – A strong base for a potential breakout.
📍 VCP (Volatility Contraction Pattern) & Cup & Handle – Classic bullish setups on the daily timeframe.
🎯 Trading Plan
🔹 Entry: Small test position above ₹1500 on a daily close.
🔹 Safer Entry: Wait for a weekly close above ₹1500 for confirmation.
🔹 Stop-Loss (SL): ₹1162 (closing basis)
🔹 Risk per Trade: ₹1500 - ₹1162 = ₹338 (~22.53%)
🔹 Key Condition: Volume should improve—wait for a clean breakout.
📊 Key Fundamentals
💰 Market Cap: ₹6,842 Cr
📈 Stock P/E: 31.8
📊 ROCE: 21.4% | ROE: 21.9%
📊 Sales & EPS Improving YoY – Strong growth trend
⚠️ Why Small Position?
🚨 Market is in a downtrend – We are trading against the broader trend.
🚨 Deep SL (~22.53%) – If the market falls further, stop-loss might get hit.
🔥 Why Consider It?
👉 Stocks like these can be potential winners once the market stabilizes. Keeping it on the watchlist is worthwhile!
📊 Monitor price action closely before committing fully!

Bearish pattern in InfosysIt is a clear neckline breakout with strong displacement candle. This confirms that the price will fall in upcoming days upto D point. This is for educational purposes only.

Godrej Properties good to go long
Godrej Properties On Double Bottom + 61.8 Fibo ratio + RSI Diversion (clearly Show on 4 hrs & Daily)
Good to Go long for Positional buy.
Infra Sector is on good move in last 2years - this stock also correct perfectly
i thing this stock will give good returns in Next few months.

Bitcoin showing weakness. It may test 76076Bitcoin chart is weak now. weakly RSI below 60 MACD also negative. Double top pattern form and correction showing. As per chart it may test 76076 soon. It can short on any bounce up to 92000.
These is Neckline place near 76076 of Inverse H&S pattern. It would be retest of neckline.

Amber Enterprises Breaks Out from Double Bottom – Bullish ViewHello Everyone , i hope you all will be doing good in your life and your trading as well. Today i have brought a trading idea on the double bottom chart pattern. Stock name is Amber Enterprises. So let's start guy's
Amber Enterprises (NSE) has given a strong bullish breakout from a double bottom pattern on the daily chart, indicating a potential trend reversal . The breakout has been accompanied by strong volume , confirming buyers’ dominance at current levels. If the stock sustains above the entry zone of 6190-6135, it could gain further momentum towards the first target of 6663, followed by 7171, and a long-term target of 8094. A stop loss should be placed below 5473 to manage risk effectively. This setup presents a good risk-to-reward opportunity for swing traders, but proper risk management is crucial before entering the trade.
Fundamental Ratios
Market Cap
₹ 20,886 Cr.
Current Price
₹ 6,175
High / Low
₹ 8,177 / 2,991
Stock P/E
94.0
Book Value
₹ 624
Dividend Yield
0.00 %
ROCE
10.2 %
ROE
6.74 %
Face Value
₹ 10.0
Industry PE
42.4
Debt
₹ 2,032 Cr.
EPS
₹ 65.9
Promoter holding
39.7 %
Intrinsic Value
₹ 1,819
Return over 5years
33.5 %
Debt to equity
0.96
Net profit
₹ 232 Cr.
Disclaimer: This analysis is for educational purposes only. Please consult a financial advisor before making investment decisions.
If you Found this helpful? Don’t forget to like, share, and drop your thoughts in the comments below.

COALINDIA DOUBLE BOTTOM REVERSALCoalindia breaking double bottom reversal pattern
good volume building up strong rsi
after breaking target1 395 immediate traget 410+
no buy/sell recomendation

Bank nifty48000 is acting as double bottom and bulls are trying to gain strength here. Bulls and bears will try to gain at 47900 - 48100 zone.
Buy above 48100 with the stop loss of 48020 for the targets 48180, 48260, 48400, 48520 and 48660. Price will be testing the trend line around 48600 and volume strength is needed to move up further. Price can move another 700 to 1000 points if it gain bullish strength.
Sell below 47900 with the stop loss of 47980 for the targets 47820, 47700, 47620, 47500, 47420 and 47340.
Always do you own analysis before taking any trade.

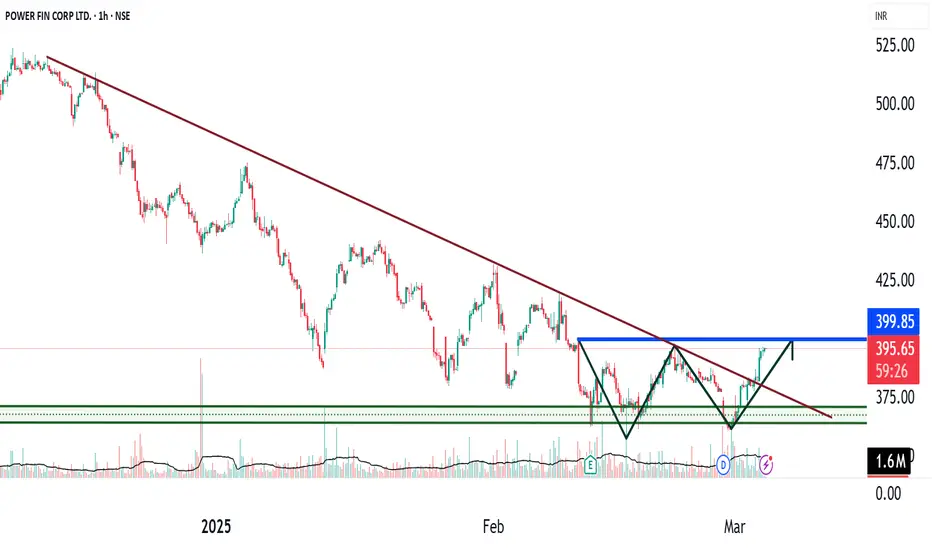
Double Bottom - Power Finance Corporation (PFC)PFC is currently in the process of forming a Double Bottom chart pattern at a strong support zone, indicating a potential reversal from a downtrend to an uptrend. The price is testing the support area, and the second bottom confirms strong demand in this region. A key signal for a bullish outlook is the breakout of the minor downtrend line, which suggests a shift in market sentiment from bearish to bullish.
Key Observations:
1. The Double Bottom pattern aligns with the psychological support level around ₹400, a significant price point for PFC. A breakout above this level is likely to confirm the continuation of the upward momentum.
2. Expectation of a Higher High and Higher Low series post-breakout, signaling the start of a new uptrend.
3. Strong demand at the current level suggests the probability of a positive breakout that will push the price above ₹400 and possibly higher.
Strategy:
Entry: Look for a clear breakout above ₹400 for confirmation of the pattern's activation.
Stop Loss (SL): Adjust stop loss according to the **measurement rule or follow your preferred trailing method to protect gains.
Target: Expecting an upside move, but avoid setting fixed profit-booking levels. Stay flexible with your exit strategy based on market dynamics.
Conclusion:
The formation of the Double Bottom at strong support, coupled with the breakout above the minor downtrend line, presents an opportunity for a positive price action move. A close above ₹400 could trigger further upside momentum, and staying disciplined with stop losses and trailing profits will help manage the trade efficiently.
BTC Double Top (M Pattern) - further downside possibleBTC has formed an almost perfect Double Top, with the ATH resistance around 108,500 . The bottom of M pattern is signified by a double bottom formation around 91,400 . Price broke that level, retested as resistance on 3rd March, forming a lower high - lower low pattern.
The M pattern's range shows further downside to 74,000 , which is also a good resistance from previous year's consolidation (March to November 2024).
Expecting BTC to reach this price around April 2025, which may be a good time to accumulate.

MAX HEALTHCARE - Bearish after breaking down from Double Top
DOUBLE TOP PATTERN -
market has broken down from perfect double top pattern indicating potential downward fall for the stock
VOLUME SURGE -
market has shown sudden volume surge recently indicating downward fall is coupled with strong volume
NEARING 100D SMA -
market is hovering above 100D sma. In past, it had touched the 100D sma whenever it has come close to it indicating market may soon fall to touch this moving average
TARGET -
price may fall till the target of 1008

RENDER TECHNICAL ANALYSIS - WEEKLY🗣️The #render Network has shown significant price movement, reflecting both the volatile nature of #cryptocurrencies and specific developments within its ecosystem.
👉As of the latest updates, the price of RENDER is around $4.50 USD, with a 24-hour trading volume hovering around $64 million.
❣️Here's a brief #Chart overview based on recent data

DOLLAR INDEX - WILL IT BREAK DOWN OR CLIMB HIGHER?Symbol - DXY
The U.S. Dollar Index (DXY) is currently trading within a key support zone, which has historically acted as a pivotal level for price action. A clear double top pattern has emerged on the larger time frame, signaling a potential bearish reversal. A breakdown below this support area would likely signify a shift in the short-term trend of the U.S. Dollar, with the potential for a move lower.
Despite this, there remains an underlying expectation in the global markets that the U.S. Dollar will stay elevated in the medium term due to factors such as President Trump’s policies, tariffs, and rising geopolitical fragmentation. However, much of this has already been priced into the currency, and the current price action is showing signs of weakness, suggesting that the Dollar may be poised for a pullback.
From a technical perspective, a decisive breakdown below the support zone would imply a trend change, with further downside potential. Traders and investors may need to reassess their outlook for the U.S. Dollar if this level is breached.
Key support levels: 107.60, 107.40
Key resistance levels: 108.35, 108.50
On the other hand, if the price holds above the support area and key upcoming data, such as the Non-Farm Payrolls (NFP) and Consumer Price Index (CPI), continue to support the Dollar’s strength, there is potential for the index to continue its upward trajectory. In this alternate scenario, the previous bullish trend for the U.S. Dollar could resume, especially if these data points align with expectations and signal ongoing economic strength. Therefore, the outlook for the U.S. Dollar remains contingent on the price action at the current support level and upcoming economic data releases.

RBL BANK TECHNICAL - Monthly RBL Bank, formerly known as Ratnakar Bank Limited, is a private sector bank in India established in 1943. Here are a key technical points about RBL in the chart for your reference based on recent information available

Oil India Double bottom Bullish TradeBuy oil india
Entry- 430
Support- 410
Target- 460 470
Pattern- Double bottom at support and a bullish engulfing candlestick pattern.
Note- It has result tomorrow so Keep this in Mind.
Disclaimer- This is just for educational purpose please take advice from your financial advisor before making any decision.
Jai Shree Ram.
