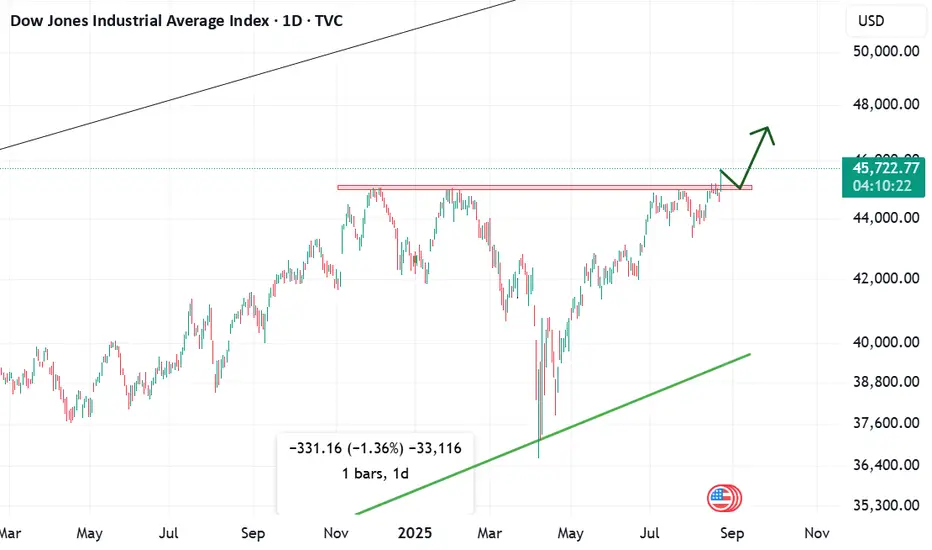
Bearish Signal in Dow Jones: Will 45,000 Hold?Dow Jones Analysis – Bearish Signal Emerges
The Dow Jones Industrial Average (DJI) has shown signs of weakness over the past couple of sessions. On Tuesday, the index formed a shooting star candlestick pattern — a classic reversal signal that often indicates exhaustion in the uptrend.
Yesterday, the shooting star was confirmed by a follow-up bearish candle, which strengthens the case that a short-term top may be in place for the index. This suggests that buyers are losing control, and sellers are stepping in at higher levels.
Key Support Zone – 45,000
The immediate and crucial support for DJI is placed around 45,000, a level that has held strong in the past. However, the index is now testing this zone again, and the price action shows clear weakness.
Trend Breakdown Adds to Bearish Bias
Looking at the chart, the trendline support is also at risk of breaking. If the index fails to hold 45,000 decisively, this breakdown could open the door for deeper correction, leading to further downside targets in the short term.
Conclusion
Bearish pattern confirmed: Shooting star + follow-up candle.
45,000 is key support: A breakdown here confirms bearish momentum.
Short-term top likely: Weakness could extend further if supports fail.
📉 For now, traders should stay cautious on DJI until it either reclaims higher levels or establishes fresh support below.
DOW

Chart Analysis - Dow Jones (Breaking Important Resistance)The US30 index has successfully broken through an important resistance level today, which is a key technical development. This breakout suggests the potential beginning of a strong bullish trend, provided the index is able to sustain itself above the red zone. If it continues to hold above this zone, buyers will likely remain in control, paving the way for higher upside targets in the coming sessions.
However, if the index fails to stay above this red zone and falls back below it, the breakout will be considered a false breakout, which could lead to renewed selling pressure and possible downside movement. In short, the red zone is the make-or-break level that will decide whether the trend continues upward or reverses.
Dow theroy - NIfty50 !!NSE:NIFTY
This chart represents a technical analysis of the Nifty 50 Index in the I-hour time frame, showing key
phases and levels that traders monitor for decision-making. Here's the explanation in simpler terms:
1. Accumulation Zone:
This is the area marked in the first shaded box where the price is moving sideways within a
range (between support and resistance levels).
• In this phase, big players (institutions) are likely accumulating (buying) before the next move.
2. Breakout to Manipulation:
After the accumulation, the price broke out above the resistance level. However, this was
followed by a sharp reversal downward.
The sharp drop is labeled "Manipulation," where the market may have tricked traders into
thinking the price was going higher, only to push it down.
3. Support Levels:
• Several support levels are marked where the price found temporary stability and reversed
upward. These areas indicate where buying pressure overcame selling.
4. Distribution Zone:
• In the next shaded area, the price moved sideways again. This could indicate a "distribution"
phase where institutions are selling off positions after the price increased.
5. Future Projection:
The dotted line shows a possible future path where the price could rise again toward the
distribution area (marked as potential resistance).
Key Takeaways:
Sideways Movement: Indicates areas of balance between buyers and sellers.
Manipulation: A sharp move designed to trigger stop-loss orders or mislead traders.
• Future Trend: The chart suggests a bullish (upward) move if the price sustains above current
support levels.
Traders can use these observations to plan entries or exits around support/resistance levels while
being cautious of potential false breakouts.

US100Dow has been reeling upwards post Trump Victory..
Can the rally extend upto 47K+ before Mr. Trump attains his office...
Probability are more...
But chances of being in a range bound trade are likely....
On a daily basis every dip near 43940 (CB) will be bought into.....
If closes below 43940 then possibility of lower levels (as marked)
watch out for more update....
Like.... Share... Comment

DOW BREAKS THE SUPPORT/TREND LINE ON 25TH JUL2024DOW HAS BROKEN THE SUPPORT LINE AND IN BEARISH MODE. WHEN EVER IT BREAKS THE SUPPORT LINE IT EASILY GIVE 500 TO 1000 POINTS.
sell only if it breaks 39800 with stop loss at 40120 (close of one hour candle).

PricaAction in NitinSpinning1) Stock made Higher High,
2) Retracement is over
3) Priceaction is done
4) Entry above the Pin Bar
50 Stop loss and target in charts

Reliance Price Action.Reliance is taking support of trend line. If it sustain above 2585,it will come in bullish mode and next target would be 2929 soon.

DJI target 48000 to be touched in june 2024DJI wave theory analysis on weekly basis: presently Dow in wave 1 & making triangle pattern or complex (clue; Dow making HH & HL). whenever DOW will break it BD base trend line ,that time wave 3 has to be started & it should first target 1.68% of wave 1. than it to be take time & correction downside unto 38% of wave 3. again when 4th wave to be completed once its target to be 48000 in 5th wave.
This is educational purpose only

dax gernmanyThe German index is just 3% away from an all-time high
strong outperformer against global peers.
now at 15875, can move beyond the 16300 mark
on the downside good as long as hold the 15250-15300 area

Dow Target 32000once again Dow price rejection at previously discussed several times as resistance and distribution area as shown in chart. Rejection is very clear with diamond pattern indicating bearish trend towards target of 32000 which is previous seen support.

How to read long term short term market structureHow to read long term short term market structure. Many time we confused with short term moves and start planning long term trades so both must be read separately.

Dow Jones Analysis - Short Position Opportunity at Resistance LeI would like to share my analysis on the Dow Jones stock. Currently, Dow is facing stress at the 32587 level which is acting as a resistance. Based on my analysis, I believe it is a good time to take a short position from here. I predict that Dow is moving towards the 29534 level.
Thank you for considering my analysis. Best of luck with your trading.

us 30 dowjones indexus30 (dow jones) right now forming reciprocal ab=cd with butterfly formation
below b point 32529 more fall can seen up to 30980-30780
on 30980-90780 2 pattern will active reciprocal ab=cd and butterfly for bull run till 34000-35000

Dow JonesDow Jones have managed to be range bound
amidst all the negative news and sentiments...
Still investors have managed to keep it afloat
without any major fall..
Now Dow is approaching Trendline Support...
Crucial reversal zone....
Is a Pull Back and bounce on the anvil ???

Market Analysis of Dow Jones and NiftyDow Jones trading in a range, a breakout will determine further market movement.
Whereas Indian markets have broken the #trend today by making a new higher low.
Having a bullish bias for the upcoming week.

the DOW moveBPCL is making a lower low with a lower high. The simple logic is going to trigger a possible short position in the upcoming days.
My bet is on BPCL Jan 320 PE on 5.5 CMP.

Dow JonesAmid fear of Inflation and rate hikes Dow has actually performed very well ignoring last to last hawkish commentary of FED.
Well we focus on price only and my algorithm has churned out some important levels for the month of Dec 2022.
I have marked those levels on the chart for ur perusal..
Happy Trading...
Like... Share... Comment...

DOW MONTHLY CHART ANALYSISI Tried to brief analysis of DOW of USA market. If DOW breakout at present level than it may go far.

Dow JonesDow Jones rallied nicely in last 3-4 trading sessions..
Dow Jones waiting for direction as per Fed rate hike news...
In any adverse news identified support levels.
32168 is a very good supp. below that we can see more red on Dow.


Dow Looking Week On The Chart Follow Lower LowDow Jones Industrial Average Index View Spot Cmp - 29941
Dow Looking Week On The Chart Follow Lower Low Pattern In The Chart
Important Levels
Above 30572 Go Long For Target 32000 ++
Below 30428 Go Short For Target 28000 ++

Dow JonesDow jones will revert back of area between 28500-28000.
There is a huge demand zone. As mention in chart

DowDow Trading setup
closing above resistance will trigger buying and forming temporary bottom
closing below support will trigger more selling pressure
I'm thing Dow is making a temporary bottom
Good R:R
