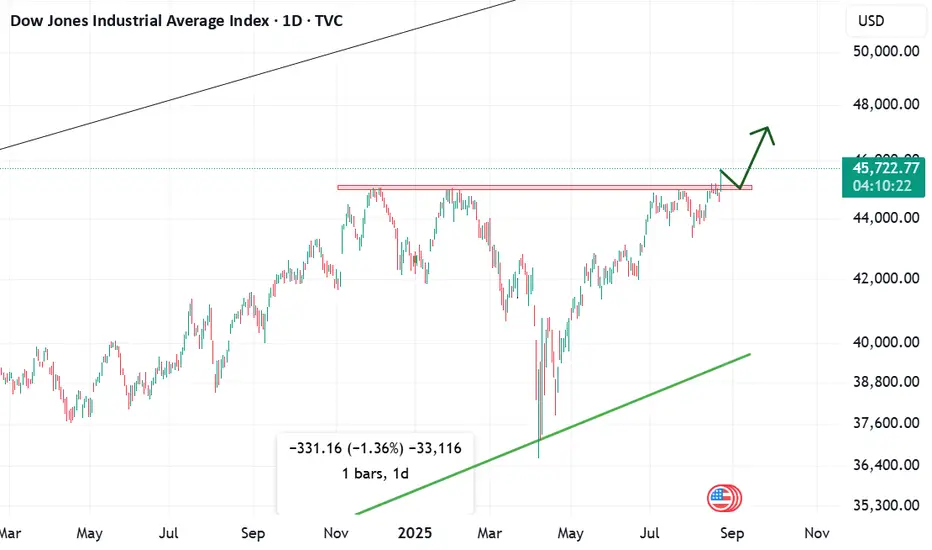
Dow Jones Ind. Weekly UpdatedDJI Indices in now going Wave 3 super cycle degree target 60,000 USD minor correction possible so enter 43,000 - 40,000 level is good for long entry
Dowjones

Dow Jones Crash - 2026 Analysis (Elliott Wave)DJI Indices crash possible up to minimum 50 to 61.8% starts on Feb - mar 2026 forming leading diagonal pattern 5th wave completed soon last up move around 1000 points only then stars correction so traders and investors go short don't try long at this time

6000 is good for trendSP:SPX
6000 is good for trend.
10% Retracement also trap pattern repetition actual down trend in previous trend is around 20% but any assume 10% for good economic via trump 😅
always do your own research
i am not financial advisor.
please feel free to ask any questions

Bearish Signal in Dow Jones: Will 45,000 Hold?Dow Jones Analysis – Bearish Signal Emerges
The Dow Jones Industrial Average (DJI) has shown signs of weakness over the past couple of sessions. On Tuesday, the index formed a shooting star candlestick pattern — a classic reversal signal that often indicates exhaustion in the uptrend.
Yesterday, the shooting star was confirmed by a follow-up bearish candle, which strengthens the case that a short-term top may be in place for the index. This suggests that buyers are losing control, and sellers are stepping in at higher levels.
Key Support Zone – 45,000
The immediate and crucial support for DJI is placed around 45,000, a level that has held strong in the past. However, the index is now testing this zone again, and the price action shows clear weakness.
Trend Breakdown Adds to Bearish Bias
Looking at the chart, the trendline support is also at risk of breaking. If the index fails to hold 45,000 decisively, this breakdown could open the door for deeper correction, leading to further downside targets in the short term.
Conclusion
Bearish pattern confirmed: Shooting star + follow-up candle.
45,000 is key support: A breakdown here confirms bearish momentum.
Short-term top likely: Weakness could extend further if supports fail.
📉 For now, traders should stay cautious on DJI until it either reclaims higher levels or establishes fresh support below.

Dow Jones (DJI) – 4H Chart AnalysisMarket Structure:
Price grabbed liquidity (Liq) below recent lows.
A Market Structure Shift (MSS) occurred, confirming bullish intent.
Price rallied strongly after liquidity sweep, indicating smart money accumulation.
Entry Zone:
Entry placed near 45,305.93 (demand zone after MSS).
This aligns with bullish order block / demand zone where buyers previously stepped in.
Stop Loss:
SL at 44,566.45 (below liquidity sweep).
Protects against deeper liquidity hunts.
Target / Take Profit:
TP at 45,764.89 (recent swing high).
Clear liquidity resting above, providing a logical target.
Risk-to-Reward (RR):
Approx 1:2 RR (Risking ~740 points for a potential gain of ~460 points).
Good balance between safety and profitability.
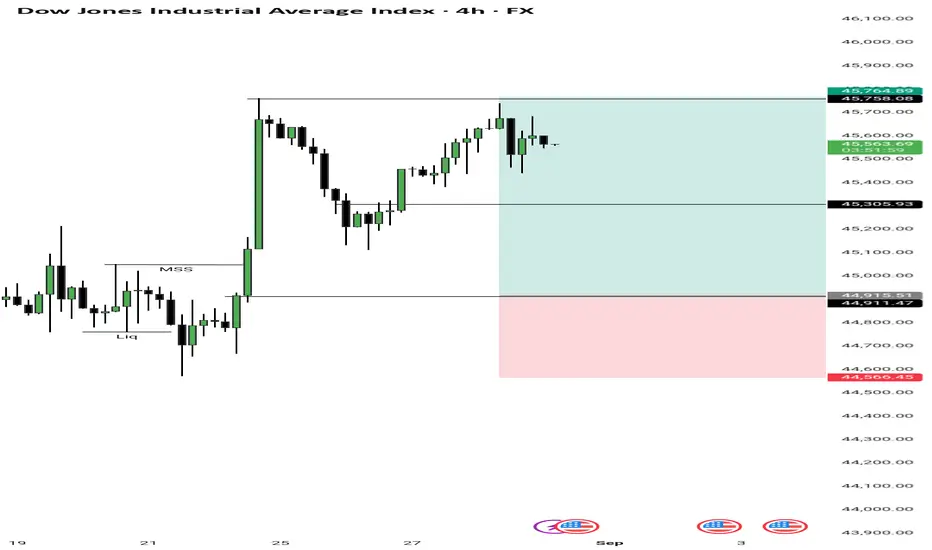
Chart Analysis - Dow Jones (Breaking Important Resistance)The US30 index has successfully broken through an important resistance level today, which is a key technical development. This breakout suggests the potential beginning of a strong bullish trend, provided the index is able to sustain itself above the red zone. If it continues to hold above this zone, buyers will likely remain in control, paving the way for higher upside targets in the coming sessions.
However, if the index fails to stay above this red zone and falls back below it, the breakout will be considered a false breakout, which could lead to renewed selling pressure and possible downside movement. In short, the red zone is the make-or-break level that will decide whether the trend continues upward or reverses.
Dow Futures E-mini Dow Jones Industrial Average Index Futures Completed its wave 5 in 1 htf. A complex correction is expected.

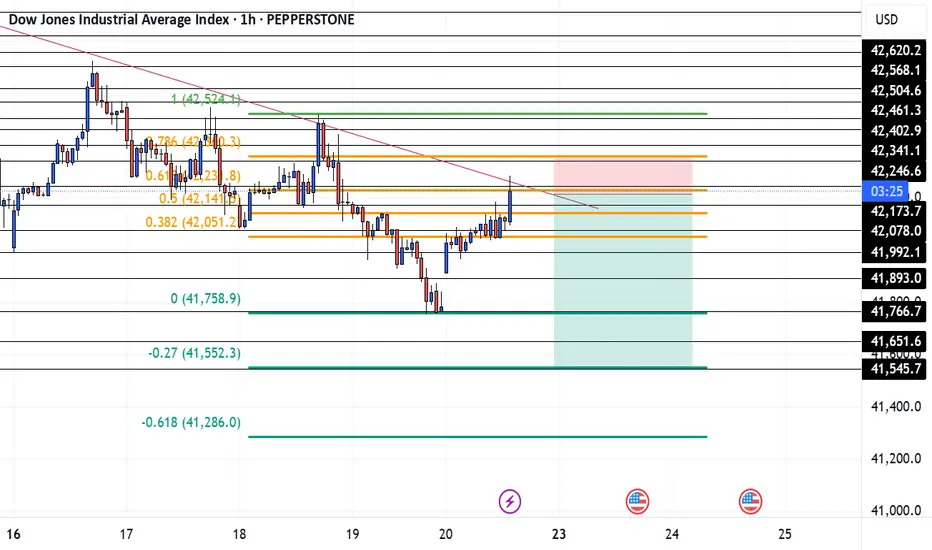
US30 JUNE 20Happy Friday, I see that price is around my key area, the top of the trendline and on my Fib extension. Everything about this trade is telling me to sell. But at the end of the day price does what she wants. So be careful and wait for a break and retest of the key level or trendline before you get in. If you have any questions don't be afraid to ask. Have fun and trust yourself
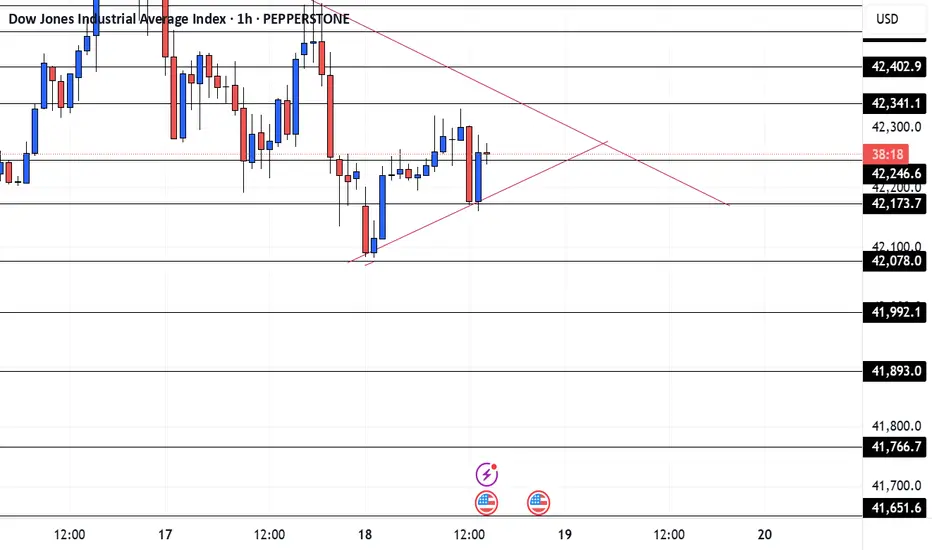
US30 JUNE 18Price looking fine like lemon lime in the summertime. I am just going to follow the trendlines today. I'm either going to wait for a bounce to sell or buy or a break and retest through the trendline. And my take profit will just be the next key area.
I hope this helps. LMK is you don't understand.
Stay safe and have fun
US 30 / Dow Jones / DJI forming bullish patternLooking at US30 US market is forming a bullish pattern called inverted Head and shoulder breakout can lead to a target of all time high.
I was right about Dow📉 Chart Analysis: Dow Jones Industrial Average (DJI)
🔻 The Crash Pattern
The Dow peaked near 45,000, and that “Trumpcession” label marks what I saw as a major turning point — likely due to political or economic shifts that were brewing at the time.
After that peak, the market took a massive dive, dropping sharply to below 36,000 at the worst point.
I had drawn Fibonacci retracement levels from the low (~35,680) to the high (~45,038), and as I expected, the price sliced through all the key retracement levels:
0.236 (43,345.95)
0.382 (42,298.65)
0.5 (41,452.19)
0.618 (40,605.74)
Right now, it's hovering around 0.786 (39,400.62), which tells me the market is hanging on by a thread — support here is weak.
📍 Current Position
As I look at it, the DJI is sitting around 39,142, just below the 0.786 Fib level — not a great sign for bulls.
The RSI is still below 40, showing bearish momentum is in play, though I am starting to see early hints that it might be trying to recover.
📅 What I Saw in December 2024
Back in December 2024, I noticed the market was topping out. The signs were all there.
There was a double top formation — a textbook distribution pattern. Momentum was stalling, volume was drying up, and the RSI started showing bearish divergence.
While most were still riding the hype, I saw this setup as a clear warning — the market was exhausted and ready to correct.
🔧 Technical Breakdown
Once price started breaking down and sliced through those key Fib levels without a fight, I knew the correction was serious.
This wasn’t just a pullback — this mirrored past 20%+ corrections, and I could feel something systemic or macro-driven behind it.
The term "Trumpcession" made sense to me — policies, election concerns, rate hike fears, and geopolitical tensions were all weighing on sentiment.
✅ Why I Was Right
I based my call on:
Bearish divergence on the RSI (price making higher highs, RSI making lower highs)
Flattening trendlines
Weakening volume
Repeated failure to break resistance
And, of course, the growing political/economic uncertainty
All those factors told me a crash was not only likely — it was inevitable.
💡 What's Next (My View)
If the Dow can’t reclaim the 0.786 level (~39,400), I believe we could:
Retest 37,865
Or even see further drops to 36,000 or 35,680
On the flip side, if RSI pushes above 50 and price climbs back over 40,600, we could see a recovery rally start. But as of now, the trend remains fragile, and caution is still my base case.

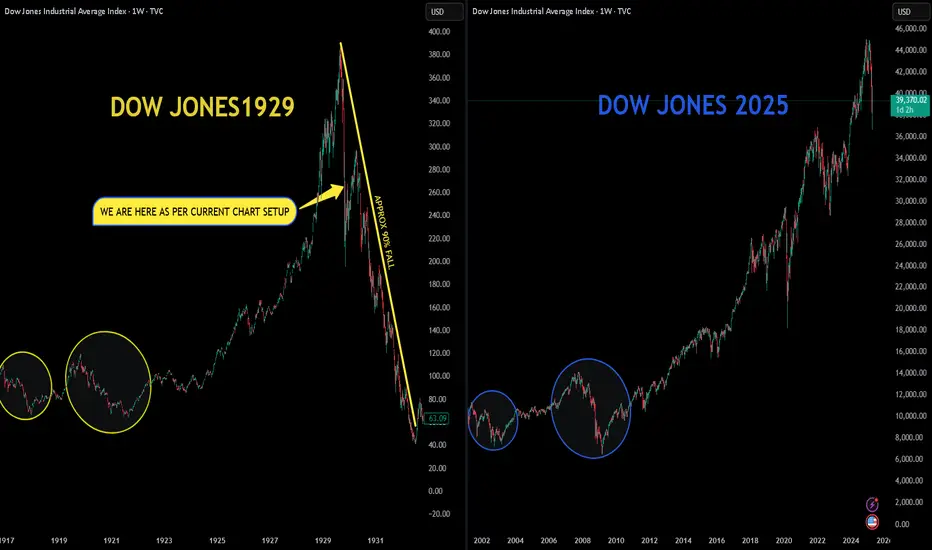
The 1929 Trade Tariff Vs The 2025 Trade Tariff (DOW JONES)Charts are self explanatory.
This is a simple comparison of the 1929 Dow Jones with the 2025 Dow Jones. As you can observe, there are many similarities.
Big Question: Can the Dow Jones again experience a 90% correction, similar to the one between 1929 and 1932 ?
NOTE: This is just an observation/correlation.
Disclaimer: This is for demonstration and educational purpose only. This is not buying or selling recommendations. Please consult your financial advisor before taking any trade.
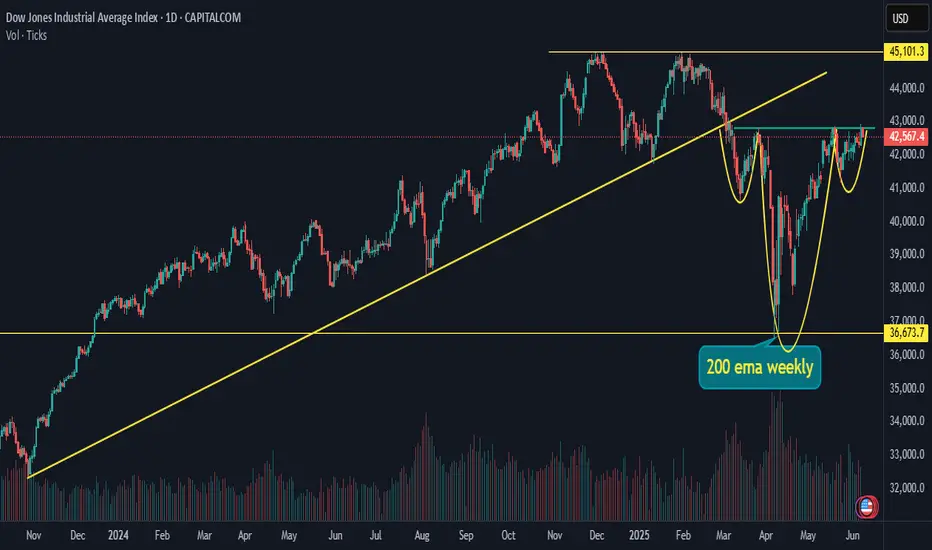
DJI Dow Jones US futuresUS30 futures are currently on a support of weekly 200 EMA.
also this is a retest of previous breakout range 36600- 36800.
This can be a good level to bounce if market wants to reverse so accumulation can be done in small quantity.
But everything is in hands of Trump chacha.

Strategy: Short US30 from 44,000 to 42,100 – Weekly Trade Plan1. Market Overview & Context
US30 (Dow Jones) is recovering but still faces pressure from macroeconomic factors:
U.S. bond yields: The 10-year yield is slightly rising, putting pressure on stocks.
Monetary policy: The Fed maintains a cautious stance on rate cuts, limiting strong market rallies.
Investor sentiment: Signs of profit-taking after the recent rebound.
Given these factors, the strategy of shorting US30 from the 44,000 - 44,484 zone down to 42,100 is highly feasible.
2. Trading Strategy
Entry Point:
Sell in the 44,000 - 44,484 zone, a key resistance area likely to trigger strong selling pressure.
Stop Loss (SL):
Above 44,850, as a break above this level could invalidate the short setup.
Take Profit (TP):
Target 1: 43,664 - 43,765 (Take 50% profit to secure gains).
Target 2: 42,100 - 42,132 (Fully close the trade to capitalize on the expected drop).
Risk Management:
Minimum Risk/Reward (R:R) ratio of 1:3, ensuring an effective trade setup.
Use a trailing stop to maximize profits if the price moves in the desired direction.
Alternative Scenarios
If US30 breaks above 44,850, the short setup is invalid. Wait for a new confirmation signal.
If the price drops quickly to 43,664 before entry, wait for a rebound near 44,000 before shorting again.

US 30 - What Next ?Since November 2023, the index has been moving in a rising parallel channel. This time, again, it comes to the lower edge of the channel.
If shows a reversal from the lower edge, may go into a bullish phase. MACD shows a reversal sign too. But merely this is not enough. should wait for some more confirmations. However, this is a good time to exercise a position with a low risk.
If gives a bounceback around these levels, may go around 44500 or more..
This illustration is only for learning and sharing purposes, it is neither a prediction nor a trading advice in any way.
All the best for your trading plans.

Dow Jones: Ready for a Bull Run?! Dow Jones is testing critical levels as it approaches a descending trendline. With strong support below and bullish momentum building, the question remains—will it break out for a rally or face resistance again?
Key levels:
1. Resistance Zones:
- 43,400.00
- 43,346.03
- 43,063.60
2. Support Levels:
- 42,815.04
- 42,450.00
- 42,229.91
3. Current Setup:
- The price is moving within a defined structure and testing the trendline resistance.
- A successful breakout above the trendline could signal the start of a bullish run.
- On the flip side, rejection at the resistance might lead to a retest of lower support zones.
How to Trade This:
- Bullish Strategy:
- Watch for a breakout above 43,063.60 with strong volume.
- Targets: 43,346.03 and 43,400.00.
- Stop Loss: Below 42,815.04.
- Bearish Strategy:
- If the price gets rejected near 43,063.60, consider short positions.
- Targets: 42,815.04 and 42,450.00.
- Stop Loss: Above 43,063.60.
Bottom Line:
Dow Jones is at a critical juncture. A breakout could lead to a significant upward rally, while failure to clear the trendline resistance may bring the price back into its support range. Stay alert and trade the breakout or rejection based on confirmation! 📈📉
DJ:DJI BLACKBULL:US30 DJ:DJI TVC:DJI

DOW JONES - SWING TRADESymbol - DJI
DJI is currently trading at 42545
Dow Jones is making double bottom at larger time frame & I'm seeing a trading opportunity on buying side.
Buying DJI Futures at CMP 42545
I will add more position if 42345 comes & will hold with SL 42100
Targets I'm expecting are 43100 - 43340 - 43580 & 42820
Disclaimer - Do not consider this as a buy/sell recommendation. I'm sharing my analysis & my trading position. You can track it for educational purposes. Thanks!

Dow Futures Trading Levels and Strategy for 09th December 2024Dow Futures Trading Levels and Strategy
Market Context
Dow Futures is showing potential for a breakout, and this strategy focuses on confirmation by waiting for candle closures to minimize false signals. Adjust position sizing according to your risk tolerance.
Buy Setup
Entry:
Wait for a 15-minute candle to close above 44,900.
Place a buy order above the high of that candle.
Targets:
45,050
45,150
45,300
Stop Loss: Place a stop loss below the low of the breakout candle.
Sell Setup
Entry:
Wait for a 15-minute candle to close below 44,600.
Place a sell order below the low of that candle.
Targets:
44,450
44,300
44,100
Stop Loss: Place a stop loss above the high of the breakdown candle.
Market Context
Dow Futures is showing potential for a breakout, and this strategy focuses on confirmation by waiting for candle closures to minimize false signals. Adjust position sizing according to your risk tolerance.
Disclaimer
The above analysis is provided for educational purposes only and does not constitute financial or investment advice.
Trading in futures involves significant risks, including the loss of capital.
Always conduct your own research or consult with a certified financial professional before making trading decisions.
Use proper risk management, including stop-loss and position sizing, to safeguard your investments.

Dow Futures Trading Strategy 05th December 2024Trading Strategy for Dow Futures:
Buy Strategy:
Entry Point: Enter a long position (buy) above the high of the candle that closes above 45230 on a one-hour timeframe. This means if a one-hour candle closes above 45230, you will buy once the price exceeds the high of that candle.
Stop Loss: Set a stop loss slightly below the low of the breakout candle to manage risk. For instance, if the breakout candle has a low of 45100, you might set your stop loss at 45090 to protect your capital.
Target: Determine your target based on historical resistance levels or a risk-reward ratio. For example, if you're risking 140 points (45230 to 45090), aim for a reward of at least 280 points (e.g., a target of 45510).
Sell Strategy:
Entry Point: Enter a short position (sell) below the low of the candle that closes below 44870 on a one-hour timeframe. This means if a one-hour candle closes below 44870, you will sell once the price drops below the low of that candle.
Stop Loss: Set a stop loss slightly above the high of the breakdown candle. For example, if the breakdown candle has a high of 45000, you might set your stop loss at 45010 to mitigate risk.
Target: Determine your target based on historical support levels or a risk-reward ratio. For example, if you're risking 140 points (44870 to 45010), aim for a reward of at least 280 points (e.g., a target of 44600).
Risk Management:
Use Stop Losses: Always use stop losses to protect your capital and limit potential losses.
Position Sizing: Never risk more than a small percentage (e.g., 1-2%) of your trading capital on a single trade.
Regular Review: Continuously monitor the market and adjust your strategy based on evolving conditions and new information.
Market Context:
Economic Indicators: Pay attention to key economic indicators such as employment data, GDP figures, and interest rate announcements that can impact Dow futures.
Geopolitical Events: Be aware of geopolitical events and developments that can cause significant market volatility.
Disclaimer:
Trading in financial markets involves substantial risk of loss and is not suitable for every investor. The strategies and opinions expressed are those of the author and do not necessarily reflect the views of Microsoft. Users should perform their own research and consult with a financial advisor before making trading decisions. Past performance is not indicative of future results.

Dow Future Trading Strategy for 04th December 2024Trading Strategy:
Buy Strategy:
Entry Point: Enter a long position (buy) above the high of the candle that closes above 44980 on a one-hour timeframe. This means if a candle on the one-hour chart closes above 44980, you will buy once the price exceeds the high of that candle.
Stop Loss: Set a stop loss below the low of the breakout candle or a significant support level to manage risk. For instance, if the breakout candle has a low of 44850, you might set your stop loss slightly below this level to protect your capital.
Target: Determine your target based on historical resistance levels or a specific risk-reward ratio. For example, if you risk 100 points (from 44980 to 44880), aim for a reward of at least 200 points (e.g., a target of 45180).
Sell Strategy:
Entry Point: Enter a short position (sell) below the low of the candle that closes below 44670 on a one-hour timeframe. This means if a candle on the one-hour chart closes below 44670, you will sell once the price drops below the low of that candle.
Stop Loss: Set a stop loss above the high of the breakdown candle or a significant resistance level. For example, if the breakdown candle has a high of 44800, you might set your stop loss slightly above this level to mitigate risk.
Target: Determine your target based on historical support levels or a specific risk-reward ratio. For example, if you risk 100 points (from 44670 to 44770), aim for a reward of at least 200 points (e.g., a target of 44470).
Risk Management:
Use Stop Losses: Always use stop losses to protect your capital and limit potential losses.
Position Sizing: Never risk more than a small percentage (e.g., 1-2%) of your trading capital on a single trade.
Regularly Review: Continuously monitor the market and adjust your strategy based on evolving conditions and new information.
Market Context:
Economic Indicators: Keep an eye on key economic indicators such as employment data, GDP figures, and interest rate announcements that can impact Dow futures.
Geopolitical Events: Be aware of geopolitical events and developments that can cause significant market volatility.
Disclaimer:
Trading in financial markets involves substantial risk of loss and is not suitable for every investor. The strategies and opinions expressed are those of the author. Users should perform their own research and consult with a financial advisor before making trading decisions. Past performance is not indicative of future results.
Trade wisely and stay informed! 📈💼

Dow Futures Trading Strategy for 03rd December 2024Dow Futures Trading Strategy
Buy Strategy:
Condition: Look for the price of Dow futures to close above 45050 on a one-hour candle.
Entry Point: Identify the high of the candle that closes above 45050.
Action: Place a buy order above this high once the one-hour candle has closed above 45050. This confirms that the market is trending upward and you’re looking to ride the momentum.
Sell Strategy:
Condition: Look for the price of Dow futures to close below 44800 on a one-hour candle.
Entry Point: Identify the low of the candle that closes below 44800.
Action: Place a sell order below this low once the one-hour candle has closed below 44800. This confirms a downward trend, signaling a bearish market.
Current Price: The current price of Dow futures is 44880.
Disclaimer: This strategy is for informational purposes only and should not be considered financial advice. Trading involves risk, and you should do your own research or consult with a financial advisor before making any investment decisions.

Dow Futures Trading Strategy 29th November 2024Dow Futures Trading Strategy
Buy above the high of the one-hour candle which breaks and closes above 44980: Consider entering a buy position if the price breaks and sustains above the high of the one-hour candle and closes above 44980, indicating potential bullish momentum.
Sell below the low of the one-hour candle which breaks and closes below 44840: Consider entering a sell position if the price drops and closes below the low of the one-hour candle and breaks below 44840, indicating potential bearish momentum.
Example Analysis
Given the current price of 44930:
Buying above the high of the one-hour candle which breaks and closes above 44980: If the price breaks the high of the one-hour candle and closes above 44980, it suggests a potential upward trend.
Selling below the low of the one-hour candle which breaks and closes below 44840: If the price breaks the low of the one-hour candle and closes below 44840, it indicates a potential downward trend.
Disclaimer
Trading in financial markets involves significant risk and can result in the loss of your invested capital. It is crucial to conduct thorough research and consult with a financial advisor to understand the risks and develop a sound strategy.

Dow Trading Strategy for 28th November 2024Trade Strategy for Dow Futures
Buy: Enter a long position when the price moves above 45000 on a one-hour candle close.
Sell: Enter a short position when the price drops below 44780 on a one-hour candle close.
Current Price: 44879
Support and Resistance Levels
Support Levels:
44780: This is the first line of defense where the price might find support and potentially reverse upwards.
44500: If the price falls below 44780, 44500 acts as the next significant support level.
44000: This is a major psychological level that could provide strong support.
Resistance Levels:
45000: The initial barrier where the price might encounter resistance and potentially reverse downwards.
45200: If the price breaks above 45000, 45200 becomes the next key resistance level.
45500: This is a significant resistance level that could pose a challenge for further upward movement.
Disclaimer
Trading involves significant risk and it's important to do your own thorough research or consult with a professional financial advisor before making any investment decisions. The information provided here is for educational purposes only and should not be considered as financial advice. Always consider your risk tolerance and investment goals before engaging in trading activities.
