Dowjones
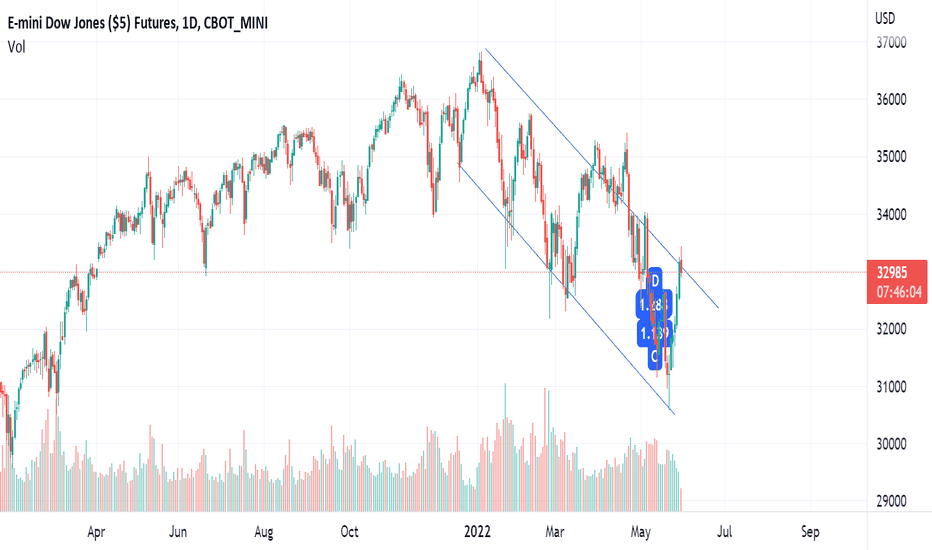
US30 DowJonestoday crossed above make or break level 31069
now this level becomes a crucial support.
Trading channel and levels marked
Happy trading.
THE DOLLAR INDEX MIGHT SEE A CORRECTION OR EVEN A REVERSALthe dollar index might see a sell-off for quite a few while the reasons for it is
REASONS
1. on a 1week time frame we are seeing a strong resistance.
2. on the 1day time frame we are seeing double top on the resistance.
3. and on 15 min time frame, we can see a head and shoulder pattern and a descending triangle pattern.
4. if the US market stays positive today we could see and in verse affect the dollar index.
so, my suggestion is to stay against the dollar and you could eventually capture a big move
LONG OPPORTUNITY ON EUR/USD the EUR/USD can see a rally for some time
REASONS
1. we are at a very crucial weekly support.
2. we made a double bottom on such crucial support.
3. on 1h time frame we broke a trend that had been tested quite a few times.
4. the dollar index is at its all-time high and made a double top.
so, as the USD depreciates we will see a rally in EUR/USD.
NOTE: IF THE US STOCKMARKET CLOSES IN GREEN OR MAKE SIGNS OF RECOVERY WE MIGHT SEE A HUGE RALLY IN THIS FOREX SO KEEP A TRACK OF US MARKET AS WELL
Dow Jones - Buy - Sl day low - Targets follow FibonacciDow Jones - Buy - Sl day low - Targets follow Fibonacci
DOW JONES: A leading diagonalIndex is unfolding as a leading diagonal of which 4th wave is already concluded and right now we are into the last stages to complete the 5th wave of this leading diagonal which will bring the index below the level of 30635 in the near term. Traders should remain short for the minimum target region of 30600-30000 in the coming weeks with stop loss of 32600.
Russell 2000 | At 0.5 Fibonacci RetracementRussell 2000 We can see this has already corrected to 0.5 Fibonacci Levels, and also we can see 2 previous Highs made in 2018 and 2020, As shared in the analysis of S&P 500 previously that we could notice further breakdown but after some pullback makes more sense looking at Russell 2000's chart.
S&P 500 | Bearish Head & Shoulder PatternOn the Weekly chart in S&P 500 , I can notice Bearish Head and Shoulder Pattern , but coming week after this drastic fall maybe we can see some pullback to the neckline and then further collapse on the downside at least till the level I have marked that is 3491.25 SP:SPX
IS DOW GETTING READY FOR 2300 POINTS FALL?We have seen confirmation of the Head & Shoulders pattern in Dow and it couldn't go above the right shoulder. We may see Dow coming near to 31000 in coming sessions.
To motivate me, Please like the idea If you agree with the analysis.
Happy Trading!
InvestPro India Team
HUGE Weekly CUP and handle formation on the DXY chartThe DXY chart shows the value of the Dollar against all assets, it is said that if the value of the dollar goes up the value of assets goes down and vice versa.
If this plays out we can expect some red days around all assets.
I hope it doesn't play out, else 2022 will be a bear market.


