IGL: DOWNTREND RESUMINGIGL 194 is looking to test 170 to 150 levels. Stock is in downtrend and now ascending triangle breakdown happening. Multiple support at 150 zone which can be testing.
View invalid above 205 levels reclaimed again.
Downtrend

JSW ENERGY : TRINAGULAR BREAKDOWNJSW ENERGY (W) 481. Stock moving towards 450 to 380 levels.
Ascending triangle breakdown in downtrend happening. Bigger timeframe and multiple resistance on higher zone. View invalid if sustain above 505 on weekly basis.

6000 is good for trendSP:SPX
6000 is good for trend.
10% Retracement also trap pattern repetition actual down trend in previous trend is around 20% but any assume 10% for good economic via trump 😅
always do your own research
i am not financial advisor.
please feel free to ask any questions

FVG Retracement in a Downtrend📈 Solana Chart – Fair Value Gap Retracement in a Bearish Market Structure
This chart highlights a clear bearish sequence, defined by a repeated formation of Lower Highs (LH) and Lower Lows (LL) with some Higher Highs (HH) and Higher Lows (HL). Throughout this downtrend, multiple Fair Value Gaps (FVGs) have emerged — each representing price inefficiencies created by strong institutional sell-side displacement.
As price continues to decline, these historical FVGs above the current market reveal a consistent pattern:
price retraces into previous imbalances, rebalances them, and then resumes the downward trajectory.
In the current setup, two active bearish FVGs have formed. The upper zone carries greater priority due to its alignment with a major LH, while the lower FVG — although not high priority — can still generate a corrective pullback.
⸻⸻⸻⸻⸻⸻⸻⸻⸻⸻
📊 Key Observations
1️⃣ Prior FVG Mitigation
A previous FVG was cleanly filled, followed by a sharp rejection — a textbook example of institutional rebalancing.
The reaction confirms the efficiency of using FVGs to anticipate retracement zones in a downtrend.
2️⃣ High-Priority FVG
The upper FVG holds greater importance as it aligns with a major Lower High.
This confluence increases the likelihood of a meaningful rejection should price retrace into this imbalance.
3️⃣ Secondary FVG Reaction Zone
A lower FVG also exists beneath the primary one.
Though not a high-priority inefficiency, it may still trigger a pullback if price interacts with it during corrective movement.
4️⃣ Support Line Liquidity Zone
The descending trendline beneath price may function as a liquidity attractor.
Stops often accumulate below such diagonal structures, making it a potential sweep area before a reaction.
5️⃣ Structural Context
The broader price structure remains decisively bearish.
As long as price trades below the upper FVG, sellers maintain control and retracements serve primarily as rebalancing moves rather than reversal attempts.
⸻⸻⸻⸻⸻⸻⸻⸻⸻⸻
📊 Chart Explanation
Symbol → COINBASE:SOLUSD
Timeframe → 1D
This visualization demonstrates how Fair Value Gaps continue to guide price behavior throughout the downtrend.
Each historical FVG above current price acted as a magnet for retracement, followed by rejection once the inefficiency was filled.
The current structure shows:
A clean downtrend defined by Lower Highs and Lower Lows
A previously filled FVG leading to immediate continuation
A new high-priority FVG near a major LH
A secondary FVG capable of producing a corrective bounce
A descending support line acting as a liquidity pool
Together, these elements showcase classic Smart Money concepts:
inefficiency → retracement → rebalancing → continuation.
Price remains under bearish control unless a decisive break above the primary FVG occurs.
⸻⸻⸻⸻⸻⸻⸻⸻⸻⸻
✅ Summary
Market structure shows a series of LH–LL sequences, confirming a strong downtrend.
Previous FVGs were filled and rejected cleanly, validating order-flow-driven rebalancing.
The upper FVG is the highest-priority reaction zone due to its alignment with a major LH.
A lower FVG may still generate a pullback but carries less structural importance.
The descending support line highlights a potential liquidity sweep before any larger rebound.
⸻⸻⸻⸻⸻⸻⸻⸻⸻⸻
⚠️ Disclaimer
📘 For educational purposes only.
🙅 Not SEBI registered.
❌ Not a buy/sell recommendation.
🧠 Purely a learning resource.
📊 Not Financial Advice.

ETH/USD - Fair Value Gap Retracement with Historical Reactions📈 ETH/USD – Fair Value Gap Retracement and Support Line Interaction
Ethereum’s daily chart showcases a clear bearish market structure, marked by a consistent series of lower highs and lower lows.
Throughout this decline, multiple Fair Value Gaps (FVGs) have emerged, each reflecting price inefficiencies created by strong institutional sell-side displacement.
These historical FVGs — now visible above the current price — reveal how ETH has repeatedly retraced to fill prior imbalances before resuming its downward trajectory.
The latest setup forms yet another bearish FVG, potentially acting as a retracement zone before continuation.
⸻⸻⸻⸻⸻⸻⸻⸻⸻⸻
📊 Key Observations
1️⃣ Historic FVG Reaction – The previous FVG (around the mid-October region) acted as a powerful supply zone. Price retraced deeply into that imbalance, filled it almost completely, and then reversed sharply — validating the concept of FVG-based rebalancing before continuation.
2️⃣ Current FVG Setup – A new bearish Fair Value Gap has now formed following another strong sell-side impulse. This zone represents a fresh inefficiency that may attract retracement before the next move down.
3️⃣ Optimal Confirmation Depth – The best confirmation typically occurs when price retraces toward the high of the FVG.
Reaching the upper boundary indicates that buy-side liquidity has been tapped and unfilled institutional sell orders have likely been triggered, often preceding a sharp rejection.
4️⃣ Descending Support Line – The trendline below price continues to act as a liquidity attractor. Stops often accumulate beneath it, making it a potential sweep zone before reversal.
5️⃣ Structural Context – The broader structure remains bearish. As long as price trades below the most recent FVG, sellers maintain full control.
⸻⸻⸻⸻⸻⸻⸻⸻⸻⸻
📊 Chart Explanation
Symbol → BINANCE:ETHUSD
Timeframe → 1D
This chart highlights the continuity of Fair Value Gap behavior throughout Ethereum’s bearish cycle.
The earlier FVGs (visible above current price) acted as magnets for retracement and then rejection — clear evidence of institutional rebalancing in action.
Each time ETH filled a previous FVG, the market found equilibrium before continuing downward.
Now, a fresh bearish FVG has formed, marking the next potential reaction area.
If price retraces deeper — ideally up to the high of this new FVG — it would offer the most reliable confirmation of a likely rejection. A shallower retracement, on the other hand, could signal weaker corrective intent.
Below current price, the descending support line identifies a possible liquidity pool. Price may sweep below this line to collect liquidity before any larger reversal attempt.
This confluence of historic and active FVGs, combined with the trendline structure, perfectly captures Smart Money’s rebalancing logic — inefficiency, retracement, rejection, and continuation.
The chart structure clearly displays a sequence of Lower Highs (LH) and Lower Lows (LL), confirming the ongoing bearish trend. This repeating HH–HL–LH–LL rhythm reflects controlled market structure and institutional rebalancing behavior.
⸻⸻⸻⸻⸻⸻⸻⸻⸻⸻
✅ Summary
• Ethereum continues to form lower highs and lower lows, maintaining its bearish structure.
• Historic FVGs show how price repeatedly retraced, filled inefficiencies, and reversed lower.
• A deeper retracement toward the high of the current FVG provides stronger confirmation for a rejection setup.
• The descending support line may act as a liquidity sweep zone before reversal.
• The overall sentiment remains bearish unless price closes above the FVG zone.
⸻⸻⸻⸻⸻⸻⸻⸻⸻⸻
⚠️ Disclaimer
📘 For educational purposes only.
🙅 Not SEBI registered.
❌ Not a buy/sell recommendation.
🧠 Purely a learning resource.
📊 Not Financial Advice.

Fair Value Gap Retracements in a Downtrend📈 BTC/USD – Understanding Fair Value Gap Retracements in a Downtrend
The current market structure on the daily timeframe highlights a clear bearish trend, where price continues to form lower highs and lower lows.
After a strong downward impulse, a Fair Value Gap (FVG) has formed — representing an area of imbalance that price may eventually retrace to before deciding its next move.
This setup reflects a potential rebalancing phase within the ongoing downtrend.
⸻⸻⸻⸻⸻⸻⸻⸻⸻⸻
📊 Key Observations
1️⃣ FVG Formation — A bearish Fair Value Gap has emerged following a strong sell-side move, signaling a region of inefficiency left behind by aggressive sellers.
2️⃣ Retracement Possibility — Price may attempt to retrace into the FVG zone to rebalance this inefficiency before continuing its primary downtrend.
3️⃣ Potential Rejection Zone — If price reacts negatively from the FVG, it could confirm continued bearish sentiment and lead to another lower low.
4️⃣ Trend Context — The overall market remains under a descending structure, with sellers maintaining control as long as price stays below the FVG zone.
⸻⸻⸻⸻⸻⸻⸻⸻⸻⸻
📊 Chart Explanation
Symbol → BINANCE:BTCUSD
Timeframe → 1D
This chart illustrates how a Fair Value Gap (FVG) functions as a key retracement zone within a broader bearish structure. The price action shows a sequence of lower highs and lower lows, confirming a prevailing downtrend.
After a strong downward impulse, price created a bearish FVG — highlighted in red — representing an imbalance area where institutional orders may remain unfilled. Price is now retracing upward, likely to fill this inefficiency.
If the market faces rejection from this FVG zone, it could signal the continuation of the ongoing bearish momentum. However, a clean break and close above it might hint at a short-term structural shift.
Below the current price, a liquidity pool zone is marked — an area where stop-losses likely reside. Price often sweeps such zones to collect liquidity before reversing, aligning with Smart Money behavior.
Overall, this setup showcases how identifying FVGs within market structure helps traders anticipate rebalancing phases, retracements, and potential reaction points in trending markets.
⸻⸻⸻⸻⸻⸻⸻⸻⸻⸻
✅ Summary
• The Fair Value Gap acts as a magnet zone where price may retrace to fill inefficiency.
• A rejection from the FVG could resume bearish continuation.
• A confirmed close above the FVG might hint at short-term strength or structural shift.
• Traders should observe price behavior within this zone for potential rebalancing reactions.
⸻⸻⸻⸻⸻⸻⸻⸻⸻⸻
⚠️ Disclaimer:
📘 For educational purposes only.
🙅 Not SEBI registered.
❌ Not a buy/sell recommendation.
🧠 Purely a learning resource.
📊 Not Financial Advice.

EUR/JPY Sell Momentum BuildsEUR/JPY has officially transitioned into a sell-side trend following clear exhaustion of its previous bullish cycle. The market structure shows consecutive lower highs and strong downside displacement, confirming that sellers are now in control of short-term momentum.
Recent liquidity sweeps above prior highs were quickly rejected, signaling institutional distribution and profit-taking. Order flow dynamics continue to favor the downside, with bearish impulses showing higher efficiency than any corrective rebounds.
Momentum and sentiment both align with sustained selling pressure. The pair is operating within a redistribution phase, and the market tone remains defensive as participants seek lower value zones.
Overall outlook: Bearish bias remains dominant. The market is expected to extend lower while maintaining controlled volatility until meaningful demand re-enters the market.

Nifty 50: Monthly Supply Zone Rejection Signals Bearish Momentum📊 Monthly Timeframe Analysis 📊
Nifty 50 and Nifty 500 have both respected their monthly supply zones, taking a clear rejection from these levels. Interestingly, despite the difference in the number of stocks (50 vs. 500), both indices are showing identical patterns, which the market is currently reflecting as a strong bearish bias.
📉 Weekly Timeframe Analysis
The weekly chart shows a proper rejection from a sloping downtrend line, confirming sellers’ dominance.
This week’s candle has formed a Bearish Marubozu – a long body with tiny wicks – indicating strong selling pressure.
Structurally, this candle aligns with an Evening Star type reversal, reinforcing the bearish bias.
Key takeaway: Weekly chart clearly favors the bears until price sustains above the supply zone.
📉 Daily Timeframe Analysis
On the daily chart, selling pressure has been continuing for the past few sessions.
Today’s candle is a Gap Down Bearish Candle, forming part of a Three Black Crows pattern on Nifty 500.
This confirms a short-term trend reversal and strong bearish momentum.
The next major support lies around the demand zone Nifty (~24475). If price tests this zone and reverses, we may see a bounce.
However, if the daily close is below this demand zone in upcoming sessions, expect further downside.
✅ Final Outlook ✅
Monthly supply zone has triggered a bearish reversal, coinciding with the Weekly Downtrend line.
Strong Bearish Marubozu on weekly close signals a shift in trend toward sellers.
Daily Three Black Crows + Gap Down candle confirms strong selling pressure in the short term.
Overall bias remains bearish until support near the demand zone shows a potential reversal.
“Patience and discipline are your best allies in trading; let the charts guide you, not emotions.”
Lastly, thank you for your support, your likes & comments. 📈 Keep analyzing, keep learning, and let the charts teach you every day!
This analysis is purely for educational purposes and is not a trading or investment recommendation. I am not a SEBI registered analyst.

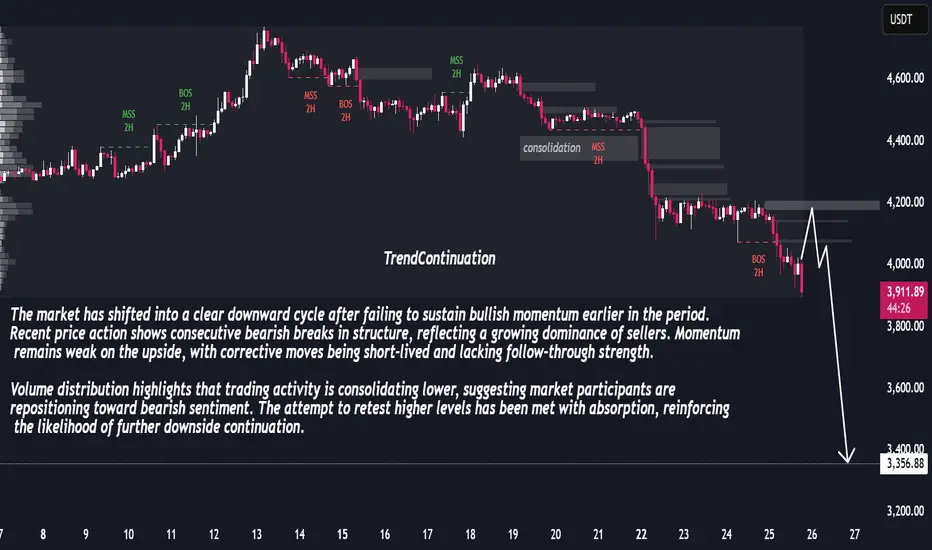
Liquidity Shift Suggests Extended Bearish CycleThe market is showing a progressive decline after losing upward strength. Recent swings indicate a decisive bearish control, with successive shifts in structure confirming the downward pressure. Attempts to recover higher levels have been shallow, reflecting exhaustion on the buy side and stronger liquidity flow toward sellers.
Market behavior suggests that rallies are being used as opportunities to exit or reposition short rather than initiate sustained bullish momentum. This is consistent with the overall weakening tone across the chart, where volatility spikes have favored downward extensions.
Looking ahead, if the current pace of distribution continues, the market is likely to maintain a bearish trajectory with potential for deeper declines as liquidity seeks out lower price ranges.
#Nifty may see fall on Monday?Nifty appears to be in its minuette wave 4 and may resume its downtrend move on September 1 to complete wave 5.

Bearish ADA/USD Trade Idea: Downtrend Continues1. Market Analysis:
The ADA/USD pair is currently in a strong downtrend. A downward-sloping resistance line is clearly visible, highlighting the continuing pressure on price. The pattern forming is a descending triangle, which is typically a bearish signal when the price breaks below the lower support level.
2. Entry Point:
Our entry point is at 0.8292. This is based on the price action within the triangle pattern, as the market is struggling to break the resistance and is testing the lower boundary multiple times. A breakdown below this level is anticipated, continuing the bearish momentum.
3. Stop Loss:
The stop loss is set at 0.88768. This level represents a recent swing high within the triangle pattern. If price moves back above this level, the trend reversal could be signaled, so it’s crucial to manage risk with this stop.
4. Target:
The target price is set at 0.74165. This is a key support area, previously tested, and the price action indicates that it could act as the next major level of demand. This aligns with our trade objective of riding the trend toward the next significant support.
5. Rationale:
The descending triangle is a bearish continuation pattern, and the breakout below the lower support confirms the downtrend.
Volume has been decreasing as the price approaches the triangle's apex, a common sign that the market is getting ready for a breakout.
The overall trend is bearish, and this setup aligns with the prevailing market sentiment.
6. Conclusion:
This trade idea is based on a well-formed technical pattern, with clear entry, stop loss, and target levels. By entering at 0.8292, setting a stop loss at 0.88768, and targeting 0.74165, we are positioning ourselves to profit from the continuation of the current downtrend in ADA/USD.
Make sure to monitor price action closely, as any deviation from the expected pattern might require adjustments to the trade.

XAUUSD – Short-Term Bearish Momentum Strengthens After US DataOANDA:XAUUSD is under clear short-term selling pressure after yesterday’s stronger-than-expected US data. Both PPI and Core PPI for July rose by 0.9% month-on-month, far above the 0.2% forecast, signaling higher producer inflation. At the same time, Initial Jobless Claims fell to 224K, better than the 225K estimate, showing a resilient labor market.
This combination has strengthened expectations that the Fed will stay cautious on rate cuts, boosting the USD and weighing on gold.
Technical picture:
Price has broken out of its previous uptrend and is now moving entirely inside a descending price channel.
The 3,358 USD zone is acting as dynamic resistance, aligned with the upper boundary of the channel and EMA 34/89.
Current structure favors selling on rallies towards resistance, with a target at 3,320 USD – near the recent swing low and lower channel boundary.
If bearish momentum holds, a further drop towards 3,300 USD remains possible in the short term.
Short-term idea: Sell zone 3,355–3,358 USD, stop above 3,365 USD, take profit around 3,320 USD.

#AUBANK entering 4th Wave – Downtrend likely ahead?Technical analysis suggests AU Small Finance Bank is currently in Wave 4 structure, indicating a potential correction phase. Investors should brace for a possible decline. Caution is advised in the short term.
**This is an educational market outlook, not investment advice. Please consult a SEBI-registered advisor before taking any investment decisions.**

Is Nifty 50 going down and down?What seems to be impulse wave 3, Nifty may see more downfall in the coming week. However, for an alternative count, we may also be in a wave C. But for either scenario, we can observe more downward movement ahead.

Gold can go Down anytime soon#gold CAPITALCOM:GOLD very soon Wave B to be Completed will come down in Wave C, safe traders wait until for confirmation i.e. it needs to break 3117 level, then good to enter for sell trade.

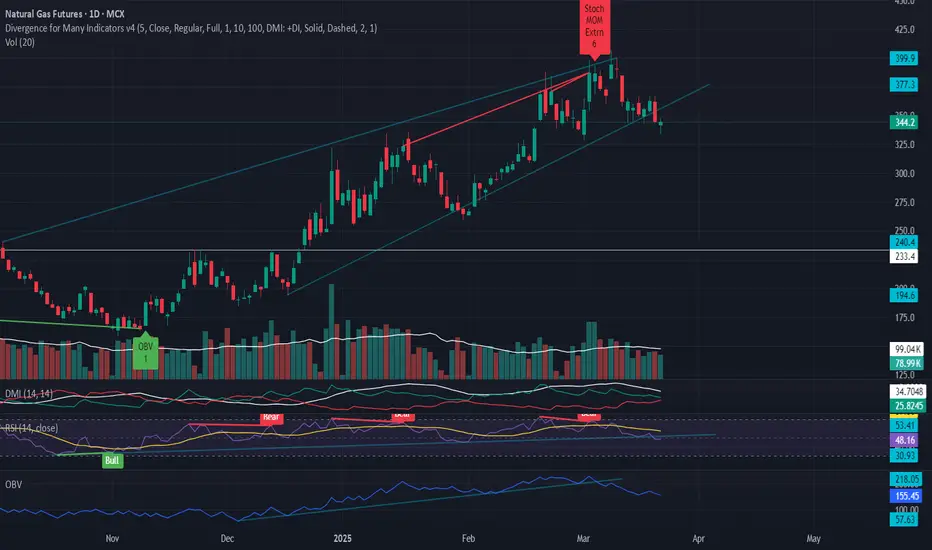
Natural Gas Breakdown from the rising trend lineNatural Gas Breakdown from the rising trend line After making high of 408. Natural Gas in reversing downwards and breaking down from the rising trend line with strong volume and
RSI,OBV also breaking down from the rising trend line. which shows strong downtrend
Entry Price < 333.00
Target @ 236.00
Stoploss @ 366.00
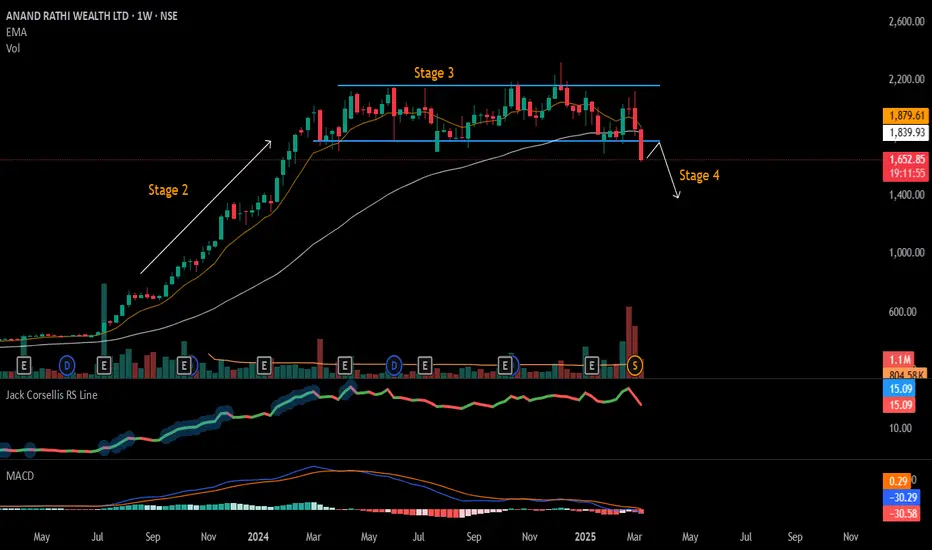
#ANANDRATHI - Stage 4 / Decline The was was in Stage 2 / Growth Stage - Up Trend
Stock entered Stage 3 / Distribution - Side Trend
Now stock entered Stage 4 / Decline - Down Trend
Stage 4 is when we need to exit our investment and protect our capital.
Gold Faces Strong Resistance – Is a Drop Coming?Hello everyone , i hope you all will be doing good in your life and your trading as well. Let's discuss about Gold (XAU/USD) which is facing strong resistance at the upper boundary of a descending channel on the 1H timeframe, indicating a potential bearish move ahead. After multiple attempts to break above, the price has been rejected, signaling that sellers are stepping in at higher levels. If the price sustains below 2,905, we could see further downside towards 2,880, followed by 2,840, and eventually 2,813. The stop loss for this trade setup is placed at 2,935, above the recent resistance. Volume analysis also confirms selling pressure, adding conviction to the bearish outlook. If the price fails to hold support, this could lead to a deeper correction within the channel. Stay cautious and manage risk accordingly!
Disclaimer: This analysis is for educational purposes only. Please consult a financial advisor before making investment decisions.
If you Found this helpful? Don’t forget to like, share, and drop your thoughts in the comments below.

Alkem Broke Swing Low, Downtrend Resumes again, King CandleNSE:ALKEM today made a King Candle broke the swing lows and continued its classical downtrend on the back of below-estimated Q3 Results.
Con-Call Updates:
5.2% YoY increase in quarterly net profit and a 1.5% rise in revenue during the quarter, revenue growth was led by domestic business. Profitability improved due to cost-efficient measures undertaken by the company. The supply chain issue in the US continued to improve. The company reiterated its EBITDA margin guidance of ~19% for FY25, despite a sluggish Q4 due to increased spending. Concerns remain due to weak Indian growth and lacklustre U.S. portfolio.
About:
NSE:ALKEM is engaged in the pharmaceutical business with global operations. The Company is engaged in developing, manufacturing and selling pharmaceutical and nutraceutical products.
F&O Activity:
Short Buildup in Futures with 5000 CE Gaining Significant OI.
Trade Setup:
It looks like a good 1:1 trade setup, with the recent swing high as a strong resistance zone, the RSI and 100 DSMA are Trending Down, and the downtrend continues unless it makes a higher high.
Target(Take Profit):
Around 4650 Levels for Swing & 4346 for Positional Trader.
Stop Loss:
Entry Candle Low for Swing Trader and Recent Swing High for Positional Trader.
📌Thank you for exploring my idea! I hope you found it valuable.
🙏FLLOW for more
👍BOOST if useful
✍️COMMENT Below your views.
Meanwhile, check out my other stock ideas on the right side until this trade is activated. I would love your feedback.
Disclaimer: "I am not SEBI REGISTERED RESEARCH ANALYST AND INVESTMENT ADVISER."
This analysis is intended solely for informational and educational purposes only and should not be interpreted as financial advice. It is advisable to consult a qualified financial advisor or conduct thorough research before making investment decisions.

Dow Theory on Nifty50 chartDOW THEORY UPDATE-
After New Dow Bottom "X", now we have made new Dow Top "Y" as well. By seeing market condition, I feel X can be broken soon but if we cross the Dow top "Y" first then that will ends the downside officially.
W is the previous significant swing high here.
X is the current significant swing low here.
Y is the current significant swing high here.

Nifty Bearish Reversal to 21800 and 19900. If May fall if 24500 is broken , Targets are based on fib extension. on weekly 23.6 % retracement and Fib extension meeting at 21800. This is likely to happen in coming few weeks or months.
once 21800 is broken next target would be 19900. This seems too much however this can be used as best time and level to invest for long term. 19900 is 23.8 % retracement from all time high. This is ideal level for long term investment for 4-5 year horizon.

Dow Futures Trading Strategy 29th November 2024Dow Futures Trading Strategy
Buy above the high of the one-hour candle which breaks and closes above 44980: Consider entering a buy position if the price breaks and sustains above the high of the one-hour candle and closes above 44980, indicating potential bullish momentum.
Sell below the low of the one-hour candle which breaks and closes below 44840: Consider entering a sell position if the price drops and closes below the low of the one-hour candle and breaks below 44840, indicating potential bearish momentum.
Example Analysis
Given the current price of 44930:
Buying above the high of the one-hour candle which breaks and closes above 44980: If the price breaks the high of the one-hour candle and closes above 44980, it suggests a potential upward trend.
Selling below the low of the one-hour candle which breaks and closes below 44840: If the price breaks the low of the one-hour candle and closes below 44840, it indicates a potential downward trend.
Disclaimer
Trading in financial markets involves significant risk and can result in the loss of your invested capital. It is crucial to conduct thorough research and consult with a financial advisor to understand the risks and develop a sound strategy.

Dow Futures Trading Strategy for 22nd November 2024Dow Futures Trading Strategy
Current Price: 43953
Trading Levels:
Buy Above 44150
Action: Wait for a one-hour candle to close above 44150 before entering a long position.
Target 1: 44280
Target 2: 44400
Stop Loss: 44000
Rationale: A breakout above 44150 indicates bullish momentum and the potential for an upward move.
Sell Below 43750
Action: Wait for a one-hour candle to close below 43750 before entering a short position.
Target 1: 43620
Target 2: 43500
Stop Loss: 43900
Rationale: A breakdown below 43750 signals bearish sentiment and potential for further downside.
Support and Resistance Levels:
Resistance Levels:
44150 (Immediate resistance and breakout level)
44280 (First target)
44400 (Major resistance)
Support Levels:
43750 (Immediate support and breakdown level)
43620 (First target)
43500 (Strong support level)
Important Notes for Traders
Candle Confirmation: Always wait for a confirmed one-hour candle close above or below the defined levels to avoid false breakouts.
Risk Management: Ensure your position size aligns with your risk tolerance. Use stop-loss orders to protect your capital.
Market Volatility: Monitor economic news, earnings announcements, and geopolitical events as they can significantly impact Dow Futures prices.
Disclaimer
This analysis is for educational and informational purposes only and does not constitute financial advice. Futures trading involves significant risk and is not suitable for every investor. You may incur losses greater than your initial investment. Always consult a licensed financial advisor or perform your own due diligence before making trading decisions. The author assumes no responsibility for any trading outcomes based on this information.
