DrReddy - Last chance to buy before another runDrReddy is getting support at 0.618 fib level and the traded volume is also decreasing. In 1-2 days we may see a spike in volume and which will start another bull run. It is also forming a Flag and Pole pattern. If Flag and Pole breakout happens than Target is 5900++ in coming weeks.
DRREDDY

heading 6200 ++I am looking for levels of 6200 + in DRL. 4000 on daily closing basis is my SL . 4500-4550 is the level to enter in stock.
Disc : It's not an investment advise to buy or sell

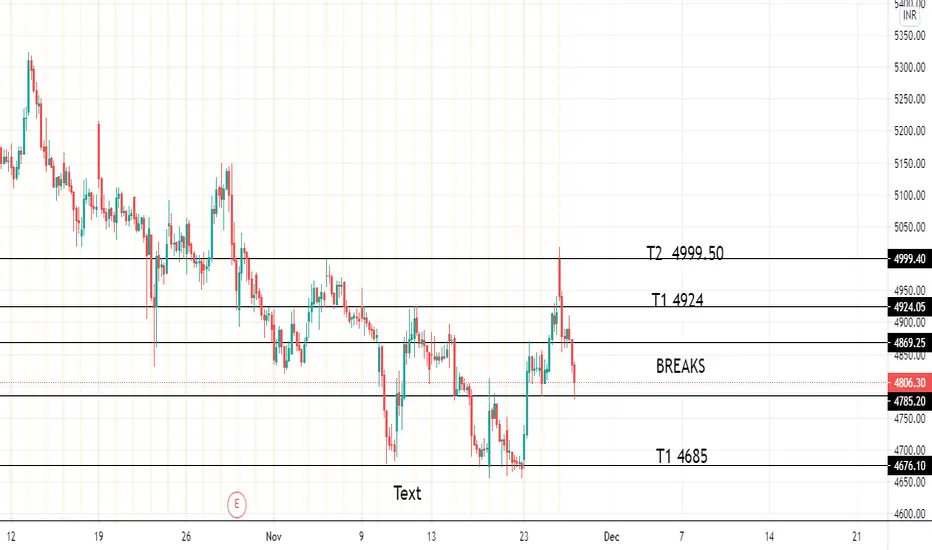
Breakout from falling Wedge Pattern in Dr ReddyThere is a breakout from falling wedge pattern in Dr Reddy on hourly chart today. Volumes of 3X (Compared to 10 day EMA) were seen on the breakout candle.
After the breakout, Dr Reddy is now coming back to test the trend line.
If we observe the daily chart bulls ahas made an attempt on 19/11/2020 for breakout but was unsuccessful. Today bulls were successful in taking the prices higher.
We can initiate buy between 4810-4830 and targets would be 4999/5080/5200.
SL would be very small i.e. below the low of breakout candle i.e. 4770.
Risk/Reward will be pretty good around 2.7 if trade works out.

once agains after failing twiceDrreddy give decent bounce from support and forming bullish wedge. good to get in here again

DRREDDY Levels for 23-NOV-20(Intraday) Buy above 4690 for 15,40,70++
Sell below 4655 for 15,40,70++
Can comment or ping me for any query
All views for Educational purpose, Trade at your own risk


DrreddyShort if it breaks 5110 , safe players short. Below 5085 or 5050.
Big gap to be filled.
Looks weak for me


DR REDDY LOOK OUT FOR THESE LEVELS!!! ALL THE LEVELS ARE MARKED ON CHART, RED ZONES DENOTES SUPPLY ZONES AND GREEN IS FOR DEMAND ZONE .
STOCK HAS EARLIER TAKEN SUPPORT FROM 50 DAILY EMA BUT IT WAS NOT ABLE TO MAKE HIGHER HIGH
The indicator used:
1) Daily Lines plots Daily 20 & 50 EMA on lower time frame charts
2) TE-REKAB
- PB : PULLBACK
If you like the analysis, do leave a like and follow for more such content coming up.
The analysis is my POV, hope you got bucks in your pocket to consult a financial advisor before investing :P :)
HAPPY TRADING!

Dr Reddy LongBuy after 1 week. let the price correct bit more buy 2 or 3%.
Buy @ 4850
with target of 25% return in a month or two month.
Reason:
1. Support at 50 EMA
2. Trendline support (Demand zone)
3. Results are better than expected.


#DRREDDY bullish triangle to bearish rectangleDRREDDY's triangle setup shown earlier triggered its stop levels and now has shaped up to be a rectangle that has broken on the downside. Expect a downmove towards 4770 which is the normal target out of a rectangle. support and caution can be expected at 4845 which is the gap support


DRREDDY HEADING NORTHDrrreddy is moving towards 5185, 5282, 5397. A pullback and a confirmation can be usefull to make a better R:R
Regards

DR REDDY LOOK OUT FOR THESE LEVELS!!! - UPDATEDALL THE LEVELS ARE MARKED ON CHART;
PRICE BROKE ALL THE LEVELS WITH GOOD VOLUME
BUYING CAN BE EXPECTED AROUND 4860-4875 LEVEL
The indicator used:
1) Daily Lines plots Daily 20 EMA on lower time frame charts
If you like the analysis, do leave a like and follow for more such content coming up.
The analysis is my POV, hope you got bucks in your pocket to consult a financial advisor before investing :P :)
HAPPY TRADING!!

DR REDDY LOOK OUT FOR THESE LEVELS!!! ALL THE LEVELS ARE MARKED ON CHART;
PRICE WAS STRUGGLING TO BREAK DAILY 20 EMA, IT HAS BROKEN IT WITH GOOD VOLUME
IT MIGHT COME BACK TO THE EMA FOR CONSOLIDATION.
The indicator used:
1) Daily Lines plots Daily 20 EMA on lower time frame charts
If you like the analysis, do leave a like and follow for more such content coming up.
The analysis is my POV, hope you got bucks in your pocket to consult a financial advisor before investing :P :)
HAPPY TRADING!!


symmetrical triangle pattern in DRREDDY....Above 5260--5510-- and more
below 5056--5000--4810
i will prefer bullish trade as structure is bullish
sitting above all important moving average in daily timeframe
currently under consolidation phase

