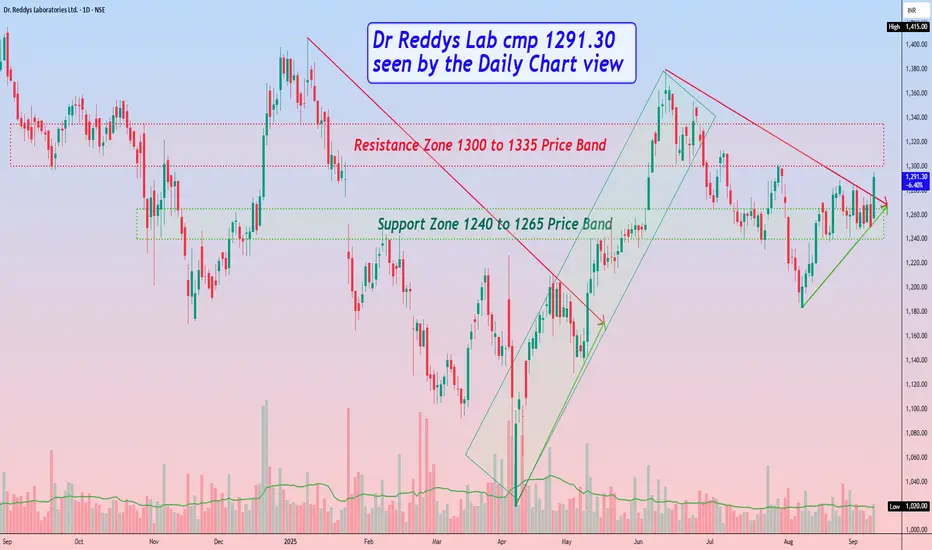
Dr Reddys Lab cmp 1291.30 by Daily Chart viewDr Reddys Lab cmp 1291.30 by Daily Chart view
- Support Zone 1240 to 1265 Price Band
- Resistance Zone 1300 to 1335 Price Band
- Breakout from Falling Resistance Trendline
- Bullish Rising Price Channel with intermittent highs and lows
- Recent history repeating by Breakout from Falling Resistance Trendline
- *Will we see a repeat Bullish Rising Price Channel with intermittent highs and lows*
Drreddylaboratories
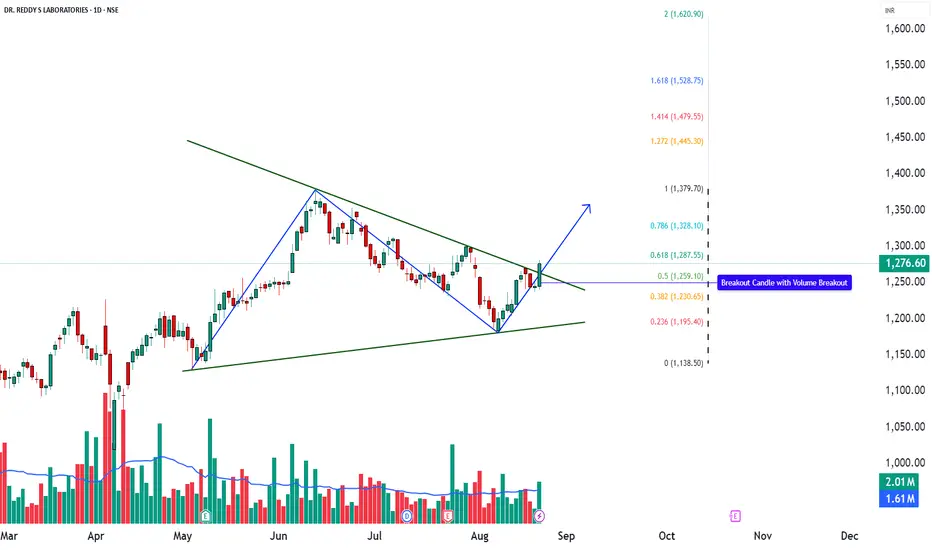
DRREDDY – Triangle Breakout in Play📊 DRREDDY – Technical & Educational Snapshot
Ticker: NSE: DRREDDY | Sector: 💊 Pharma
CMP: ₹1,276.60 ▲ (+2.51% | 22 Aug 2025)
Rating (for learning purpose): ⭐⭐⭐⭐ (Moderately Bullish)
Pattern Observed: 📈 Triangle Breakout with Volume Confirmation
📰 Sentiment Analysis
👉 Overall Sentiment: Positive ✅
• Bullish Drivers: Breakout from triangle formation, Morning Star on daily, bullish PinBar on monthly, strong Q1 results with revenue & profit growth, and renewed interest in pharma sector due to healthcare demand.
• Risks (Bearish Case): Any failure to sustain above ₹1,250 or renewed pressure from regulatory issues/patent challenges could trigger pullbacks.
• Short-term Outlook: Strong breakout with momentum, but some cooling-off likely due to Stochastic overbought levels.
• Long-term Outlook: Positive — consistent financial performance, strong pharma pipeline, and robust technical structure suggest higher upside potential.
📊 Technical Snapshot
DRREDDY has broken out from a triangle formation, supported by a Morning Star candlestick on the daily timeframe and a Bullish PinBar on the monthly chart — both strong reversal cues. A bullish Supertrend, RSI breakout, and Bollinger Band expansion signal renewed buying interest. Volume above the 20-SMA average further validates the breakout, suggesting institutional participation. While momentum is strong, Stochastic is near overbought, which means short-term pullbacks cannot be ruled out. However, as long as price sustains above key support zones, the broader trend bias remains upward.
📊 Volume Check
🔹 Current Volume: 2.01M
🔹 20 SMA Volume: 1.61M ✅
💥 Above-average participation → confirms breakout reliability with demand expansion.
💡 Interpretation: Higher-than-average volumes in breakout zones indicate broader market participation and improve the chances of trend continuation.
💡 Learnings
Breakouts from consolidation patterns like triangles tend to extend into trending moves when supported by momentum indicators (RSI + MACD). Elevated CCI levels indicate consistent buying pressure, but traders should remain alert to possible short pullbacks, especially when Stochastic enters the overbought zone. Defining a stop-loss and invalidation level is key for disciplined trade management.
📌 Key Levels
Resistance: 1292 | 1308 | 1334
Support: 1251 | 1225 | 1209
Fibonacci Levels: 1138.50 | 1195.40 | 1230.65 | 1259.10 | 1287.55 | 1328.10 | 1379.70
🎯 STWP Learning Reference
• Observed breakout zone: ~1281.8
• Key support level: ~1236
• Upside reference zones (if momentum continues): 1327 | 1372
• Pullback watch zone: 1224–1230 (where demand has earlier emerged)
• Invalidation reference: Below 1195 (trend may weaken)
⚠️ Disclaimer – Please Read Carefully
The information shared here is meant purely for learning and awareness. It is not a buy or sell recommendation and should not be taken as investment advice. I am not a SEBI-registered investment advisor, and all views expressed are based on personal study, chart patterns, and publicly available market data.
Trading — whether in stocks or options — carries risk. Markets can move unexpectedly, and losses can sometimes exceed the money you have invested. Past performance or past setups do not guarantee future results.
If you are a beginner, treat this as a guide to understand how the market works — practice on paper trades before risking real money. If you are experienced, always assess your own risk, position sizing, and strategy suitability before entering trades.
Consult a SEBI-registered financial advisor before making any real trading decision. By engaging with this content, you acknowledge full responsibility for your trades and investments.
💬 Found this useful?
🔼 Give this post a Boost to help more traders discover clean, structured learning.
✍️ Drop your thoughts, questions, or setups in the comments — let’s grow together!
🔁 Share with fellow traders and beginners to spread awareness.
✅ Follow simpletradewithpatience for beginner-friendly setups, price action insights & disciplined trading content.
🚀 Stay Calm. Stay Clean. Trade With Patience.
Trade Smart | Learn Zones | Be Self-Reliant 📊
DR Reddy's - Two Possible ScenarioCurrently Stock in mild down trend to sideways
Area 1310 - 1330 become crucial
Any close above 1330 will take the stock back to 1400 & higher
Any close below 1310 will make it bearish for quite some time
Then it will give an opportunity to sell on pull back
Downside targets of 1270 & 1250 may follow
Will wait for close in both the scenario

DR. REDDY Strong Candle FormationNSE:DRREDDY made a strong candle today Crossing Key Levels with volumes and closing above 100 DEMA.
MACD Still Showing a BUY Signal, I have drawn support and resistance levels. If it breaks the resistance level it Will Cross ATM. Small Quantity can be added at the current Level for a Swing.
📌Thank you for exploring my idea! I hope you found it valuable.
🙏FLLOW for more
👍BOOST if useful
✍️COMMENT Below your views.
Meanwhile, check out my other stock ideas below until this trade is activated. I would love your feedback.
Disclaimer: This analysis is intended solely for informational and educational purposes and should not be interpreted as financial advice. It is advisable to consult a qualified financial advisor or conduct thorough research before making investment decisions.

DRREDDY Decent long term investment for higher levelsDRREDDY looks good enough buy for few months for 7500 levels as price looks to go up after creating a h&s bottom .
Cheers

DRREDDY For 12%(approx..) Gain DR REDDYS LABS making a symmetrical triangle breakout and may give a profit of 12% and above.
One can wait for Volume as well as weekly closing on chart
CMP : 4650
TG : 5200
SL : Below 20 EMA
Disclaimer : It is my personal view as a trader and for educational purpose only. Equity market involves risk . Please consult your financial adviser before taking any decision.

DRREDDY - Buy on BreakoutBuy on Flag Breakout on 15m
Entry - on Flag Breakout
SL - 4440
Tgt - 4544
Disclaimer - I am not sebi register analysis

DRREADY - Buy near 4400Trendline support near 4400
Buy near 4400
Disclaimer: I am not SEBI register analysist

DRREDDYKey highlights: 💡⚡
✅On 1D Time Frame Stock Showing Breakout of Channel pattern .
✅ Strong bullish Candlestick Form on this timeframe.
✅ Buy above 4400
✅It can give movement up to the Breakout target of 4800.
✅Can Go long in this stock by placing a stop loss above 4310.
✅ breakout this can give risk:reward upto 10 %+

DR REDDY LAB CHART ANALYSISDr.Reddy Lab showing at 4380 is Major Resistance where we can clearly see Long Long Wicks and rejecting the price from same level
At the same time we get Trendline Support and formed Ascending Tringle Chart Pattern.
In coming session we can see such big rally either side of breakout or breakdown.
KEEP AN EYE ON IT….!!!!

DR REDDY LABS CHART ANALYSISDr Reddy Labs Created Ascending Chart Pattern where its Major Resistance where as showing long long wicks and Rejecting Again & Again from Same Point is Considering such Nodt Important point where again it reaches the same level
If it will break in upcoming session We Can see such Big Rally in Reddy Labs
KEEP AN EYE ON IT….!!!!

DRREDDY MAY NEED A DOCTOR FOR ITSELF!1. After a decline from 5600 odd levels to 3700 odd levels, stock is in short term uptrend.
2. As we can see, a Bearish Flag is in making. Currently it's consolidating and a decisive Break Down (most probably) may happen anytime soon.
3. Rejection is also evident from the RSI, suggesting a strong decline in coming weeks.
4. For short term, stock is entering supply zone of 4450-4600. If manages to cross it, may see a rise till 4800 levels to meet the TL, and face resistance.
5. At the same time, it's also possible that may not give the Break Down and the pattern fails. For that to happen, we need a weekly closing above 4800. It'd break the Higher High - Higher Low Structure, and may see a new ATH in coming days.
6. However, if the pattern is respected and we see a decline around 4750-4800 levels, 4250-4400 would act as decisive support breaking of which we may see a decline to 3600-3200 levels.
7. Verdict: Sell on Rise as long as below 4800 WCB.
8. Should you invest?: Why not! These are just short term things which shouldn't matter to investors as well. Invest using Monthly SIP Mode.

DR REDDY Long Swing Trade DRREDDY is forming a double bottom on 1D timeframe, there could be a bullish rally after the breakout of neckline of the Double Bottom. There is also a confluence of 200 EMA on daily timeframe. You can go long after a good breakout of 4440/4435. Place Stop-loss according to you risks, suggested targets : 1st Target: 4680 2nd Target : 4890 .
At 4Hour timeframe we can see a formation of Double Top. The stock has given a breakout of the Double Top which is a good sign for bullishness.

Drreddyhigh : 07/07/2021 : 5,614.60
low : 18/02/2019 : 1,872.95
75 % : 4679.18
50% : 3743.77
25% : 2808.36

Dr Reddy's target for 1-2 month. stop loss 4731
target 4990
target 5130
delivery investment.
buy if stock move above 4862.
reversal trend.

Dr reddy : Bullish outlookone should go long on current levels with SL of 4730 for the tgt of 5000/ 5150

DRREDDY - Inverse Head & ShouldersNote: This is for educational purpose only. Please do not trade in F&O based on this analysis.
There seems to be formation of Inverse Head & Shoulders. If the neck line is broken, we can initiate a buy in cash. RSI above 65 indicates bullish momentum. Moreover, the stock has more relative strength as compared to Nifty 50.
SL: ₹4825

Levels for - 27 Sep 2021EXPLANATION : This is a 15 min time frame chart of DRREDDY . It has formed Symmetrical Triangle Pattern , both side levels marked in chart .
If you like this analysis of Stock give a Like // Follow for more updates , let me know in comments below :)

REVERSE HEAD & SHOULDER PATTERN IN DRREDDYDRREDDY formed reverse Head & Shoulder pattern in daily TF.
Its safe to enter above 5515, for targets of 6000, with SL of 5400.
Thanks
Yuvaa Trades

Dr Reddys lab - wait for tomorrow's breakoutDr Reddys lab is in the triangle pattern and going to take its breakout, so give an entry with appropriate Stop loss only after the breakout
🔴DISCLAIMER
***** It's just for an educational purpose and so you must also follow your own technical analysis before taking up the trade ******
Aggressive traders enter at the breakout and conservative traders may give entry after retracement (Retracement is optional, we cannot expect every stock to take a retest after the breakout, it may also continue to have its bullish pressure after the breakout)
After reaching our targets, trail your stop loss to get maximum profit from the stock in a single trade

DR REDDY LABSooks good for a quick option.
Take trade as per the values given in Fibonacci. always trail the stop loss. do your own analysis before taking trade
Check these Upcoming ideas - STILL ACTIVE
Check these successful trades & approach on Britannia , Mothersonsumi , DLF , Biocon , Daawat , Infosys , HBL power , HDFC life , Hind ZINC given below
If you like my analysis do like & follow me as a token of appreciation. If you have any queries on any stock let me know.
Leave a comment that is helpful or encouraging. Let's master the markets together

DR REDDY LABS CUP AND HANDLE PATTERN WATCH WITH EAGLE EYEDR REDDY LABS CUP AND HANDLE ENJOY YOUR COFFEE OR TEA WHAT EVER YOU PREFERRED

DRREDDY - Positional Trade May & JuneExecute Long above 5250 levels only after the trend line broke in Awesome Indicator and Price chart in 1 hour candle close to avoid false signals.
Maintain Strict Stop loss below the strong support zone as mentioned in the chart for a Target of minimum 80 points.
Kindly share your valuable feedback.
Disclaimer: Please do your own analysis or consult your Advisor before taking any trade. This view is for educational purposes only.
