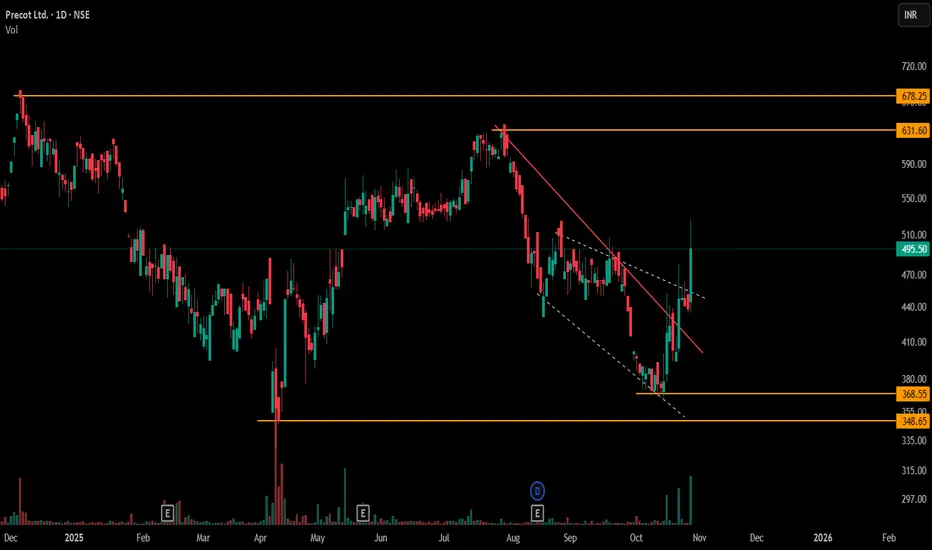
Objective Observation in Sideways Markets1) Sideways market action is clearly depicted here, with price oscillating between well-defined resistance and support bands (marked by orange horizontal lines). The presence of both multiple resistance and support levels typifies a range-bound environment, where relying solely on single breakout/CT patterns may lead to inconsistent observations.
2) To supplement this, a solid red counter-trendline has been drawn across recent swing highs/lows, offering a direct visual of shifting momentum pockets. In sideways phases, such counter-trendlines might limit or expand their analytical usefulness, depending on whether price respects or ignores these boundaries within the broader “box”.
3) Further, layering a secondary dotted formation—a small broadening pattern—provides additional observation reference points. Using both counter-trend and minor broadening structures together helps in mapping probable price responses at key junctions, especially when horizontal supports/resistances cluster.
4) By objectively tracking these intersections and reactions—rather than expecting a directional resolution—traders gain more nuanced insight for potential tactical responses on future moves. No forecasts here; just systematic, multi-pattern observation.
DTF
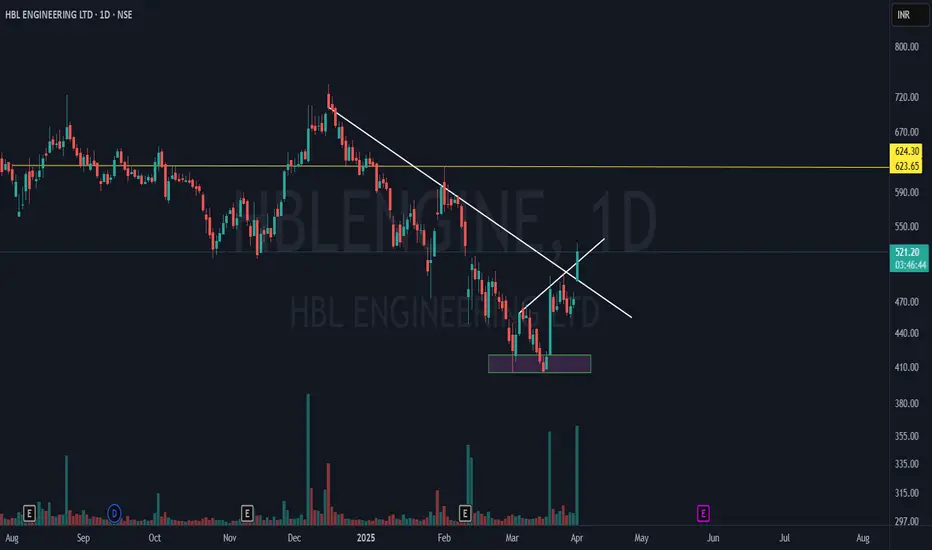
Hbl Engineering | Multi-Timeframe Breakout & Hidden Hurdles📈 Stock: HBL ENGINEERING LTD (NSE)
💰 CMP: ₹520.10 (+10.07%) - While making this Post
Key Highlights:
✅ Breakaway Gap: Opened above Critical Trendline (CT) resistance, confirming strength.
✅ Hidden Hurdle Cleared: The smaller trendline helped identify fakeouts vs. real breakouts.
✅ Strong Volume: High buying interest signals institutional participation.
✅ Next Resistance: ₹624.30 (MTF Hurdle) – a key level to watch.
🚀 Now watch for follow-through! Thoughts? Drop them below! 👇
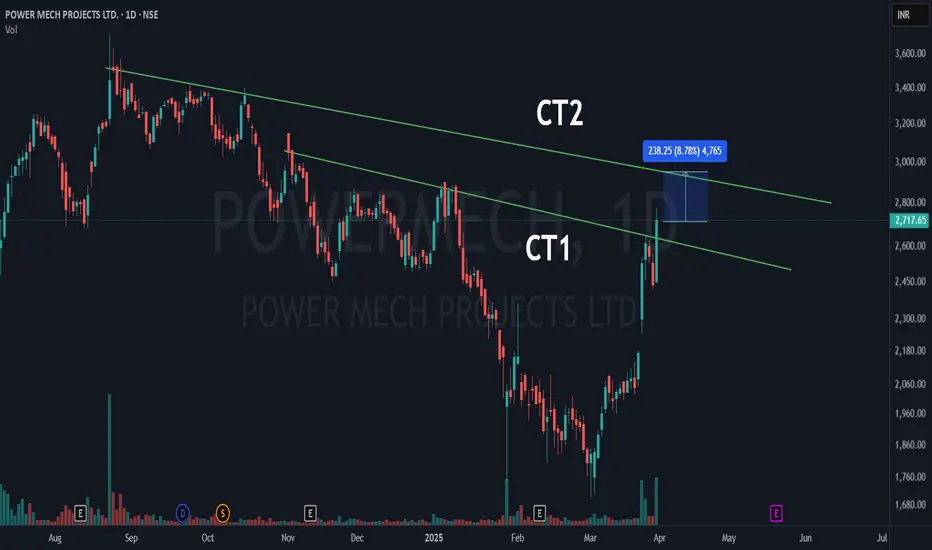
power mech projects ltd | unique DTF trade setup unfolding!📌 counter trendline 1 (ct1) – The first counter trendline (marked in green) has been successfully broken, indicating an early breakout and a shift in trend.
📌 counter trendline 2 (ct2) – The second counter trendline is the next key resistance. If the stock clears this level.
📌 two patterns in play – One pattern has already seen a breakout, while the second pattern’s resistance (ct2) still holds .
📊 volume confirmation – Increased volume supports the breakout, indicating strong participation from buyers.
Will ct2 break, or will it act as a resistance? 🤔📈
Revered from B Leg, Will it Form a Shark?HDFCBANK, A major contributor for NSE: NIFTY50 may see a little downfall considering harmonic analysis on Daily, Weekly Time Frames.
At this Juncture Let us consider Daily Time Frame, and as drawn on charts it is about to form a Bullish Shark Pattern which is reversed from B Leg.
Expected Behavior can be as represented in Red Color path.
As price comes down from 1775, Price may reach to 1690.80 which is PRZ1 Level.
on Weekly Time Frame(WTF), Price is expected to reach 1425-1400 Levels as major shark pattern completes its D Leg.

2 Amazing swing trading ideas for 24 December MarketsI daily make educational content videos for swing / positional trading
The first stock which is Raymond, is making a symmetrical triangle pattern, It is a volume-based price action and pattern trade idea, its also making a parallel channel which is important to watch before the big breakout candle comes ( if at all )
The second stock, Star Cement, is making a random pattern but more of a solid volumes and price movement type trade. It needs the breakout of my hidden line resistance to be on a weekly time frame.
Follow the Risk management rules and good luck trading.

INDIAN BANK forming an triangle patternINDIAN BANK (INDIANB) stock is forming a triangle pattern on DTF. Wait for triangle BREAKOUT and go LONG (BUY) OR SHORT (SELL) based on the breakout
