U.S Doller Index ( DXY ) - EW Analysis Doller Index weekly analysis forming leading diagonal pattern completed now in correction phase and C wave (impulse) target possible at $ 87.5
Dxyanalysis

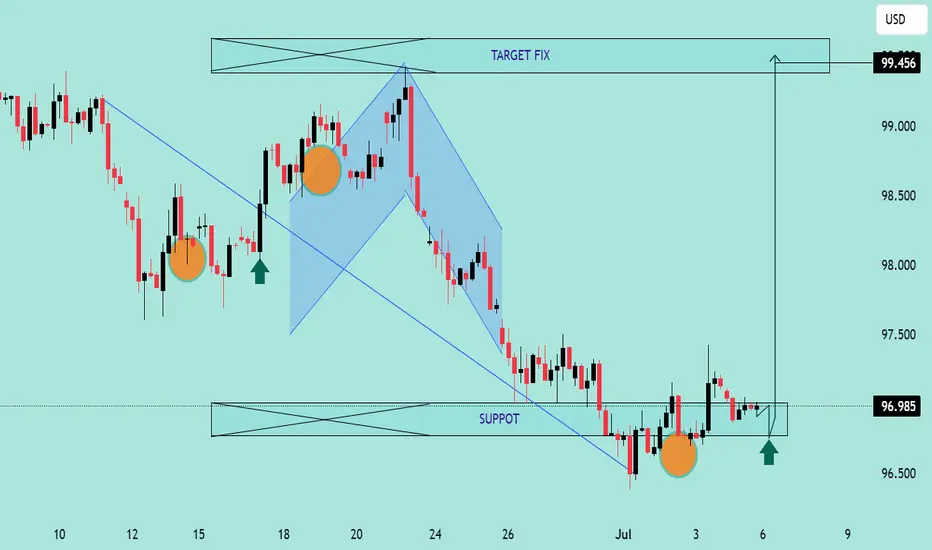
DXY Potential Bullish Reversal – Target 99.456DXY Potential Bullish Reversal – Target 99.456 🎯
Technical Analysis Overview:
🔹 Trend Structure:
The chart illustrates a recent downtrend, which has been broken as price moved above the descending trendline, signaling a potential trend reversal.
🔹 Pattern Insight:
A bullish harmonic pattern is visible (possibly a bullish Bat or Gartley), with the price reacting from the PRZ (Potential Reversal Zone), aligning with key support near 96.500. The market has respected this zone multiple times, evident from the orange highlighted circles showing price rejections.
🔹 Support & Resistance:
Support Zone: ~96.500
Breakout Zone: ~96.985 (current consolidation near this resistance)
Target Zone: Marked at 99.456, which aligns with previous structure and fib projection.
🔹 Market Sentiment:
Price is consolidating after breaking the downtrend, forming a bullish rectangle (accumulation). The green arrows indicate bullish intent from buyers defending support levels.
🔹 Price Action Signal:
Formation of higher lows.
Break of structure and close above previous highs.
Possible breakout pending above consolidation box.
📊 Conclusion:
DXY shows bullish potential as it builds a base around strong support. A confirmed breakout above the rectangle could fuel a rally toward 99.456. Keep an eye on volume and confirmation candles for entry. ✅
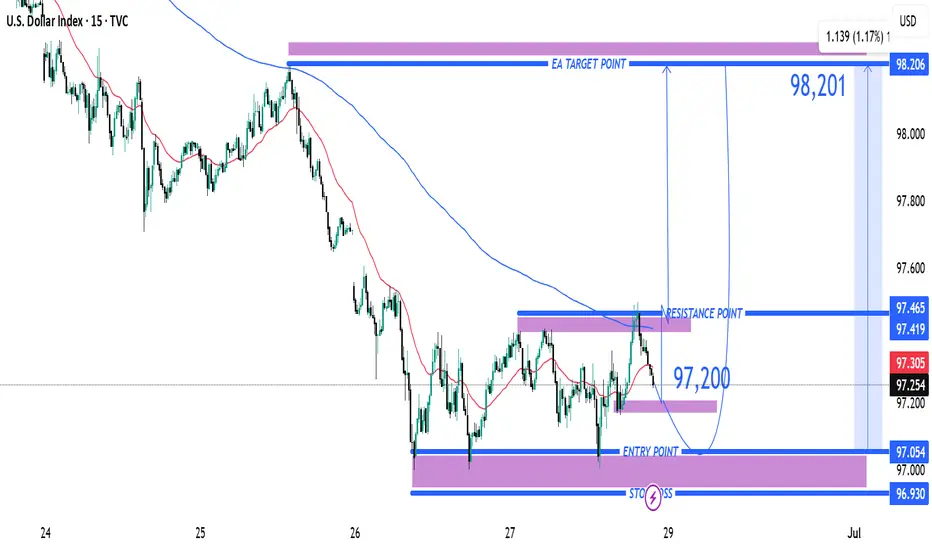
Entry Point Marked at: ~97.200 The price has already reacted m Entry Point
Marked at: ~97.200
The price has already reacted multiple times around this level, suggesting it's a key support zone.
🛑 Stop Loss
Placed at: ~96.930
Just below the support zone, protecting against a breakdown below recent lows.
This implies a risk of about 27 pips from the entry.
🎯 Target Point (TP)
Marked at: ~98.201
Strong resistance zone from previous price action.
Target implies a potential reward of 100+ pips, offering a risk-reward ratio (RRR) of ~3.7:1, which is favorable.
📊 Resistance Area
Around 97.419–97.465
This is the first obstacle the price must break through to confirm bullish continuation.
The 200 EMA (blue curve) is currently acting as dynamic resistance, aligning near this zone.
📉 Indicators
Moving Averages:
Red: Likely 50 EMA
Blue: Likely 200 EMA
Price is currently below both EMAs — so trend is still bearish, but trying to shift.
📌 Strategy Insight
The setup anticipates a bullish reversal from 97.200, aiming for a breakout above the 200 EMA and resistance to reach the 98.201 zone.
For confirmation, watch for a strong bullish candle close above 97.465, which would validate upside continuation.
⚠️ Risks
Price is still under both moving averages → downward momentum may persist.
If support at 97.00 breaks, downside acceleration could occur.
✅ Conclusion:
This is a bullish breakout setup on DXY with:
Defined entry and stop-loss.
Clear target.
High RRR.
But it’s crucial to wait for confirmation above resistance (97.465) before full conviction on the long trade.
DXY Bullish Reversal & Cup FormationThe DXY (US Dollar Index) is exhibiting a strong bullish reversal pattern, with multiple technical signals suggesting upward momentum:
🔍 Technical Analysis Summary:
✅ Support Holding Strong:
Price has respected the horizontal support zone around 98.00–98.50 on multiple occasions (highlighted by orange circles and green arrows), forming a solid base.
✅ Breakout from Downtrend:
A clear breakout above two descending trendlines (black and blue) indicates a shift from bearish to bullish sentiment.
✅ Cup Pattern Formation ☕:
A textbook Cup pattern is visible, where price formed a rounded bottom — a bullish continuation formation. The handle is minor and price has broken above the neckline (around 99.00), signaling a potential continuation toward the target.
✅ Bullish Target 🎯:
Based on the cup pattern and prior resistance, the projected target is around 101.846, aligning with previous major resistance.
📌 Key Levels to Watch:
Support Zone: 98.00 – 98.50
Immediate Resistance: 99.50 – 100.00
Major Resistance/Target: 101.846
🧭 Outlook:
As long as the price remains above the 98.50 zone, the bullish scenario remains intact. The cup breakout indicates strong buying pressure, and momentum could push DXY toward the 101.846 target in the coming sessions.

U.S. Dollar Index (DXY) Bearish Setup – Supply Zone Rejection & 🔹 Trend Overview
📊 Overall Trend: Bearish (Downtrend)
📉 Price is forming lower highs and lower lows within a descending channel.
🔻 Recently bounced off a support zone, now heading toward a potential pullback.
🔵 Supply Zone (Resistance Area)
📍 Zone Range: 100.049 – 100.601
🧱 Acts as a resistance block where sellers might step in.
📏 Confluent with EMA 70 at 100.178, strengthening its validity.
🔸 Trade Setup – Short Position
🟠 ENTRY POINT: 100.088
❌ STOP LOSS: 100.587 – 100.595 (Just above supply zone)
🎯 TARGET: 98.000 (With intermediate support levels)
📌 Support Levels
🔹 98.112 – First minor support
🔹 98.106 – Close-range confirmation
🔹 97.885 – Additional support zone
🟦 Main Target: 98.000
⚖️ Risk/Reward Ratio
🟧 Small risk above supply zone
🟩 Large reward to downside = Favorable R:R
📌 Summary
📈 Expecting a pullback into supply zone.
🧨 Look for bearish confirmation around 100.088.
🎯 Target the downside at 98.000 for profit.

DXY Technical Outlook – Strong Support Test and Bullish Reversa Chart Summary
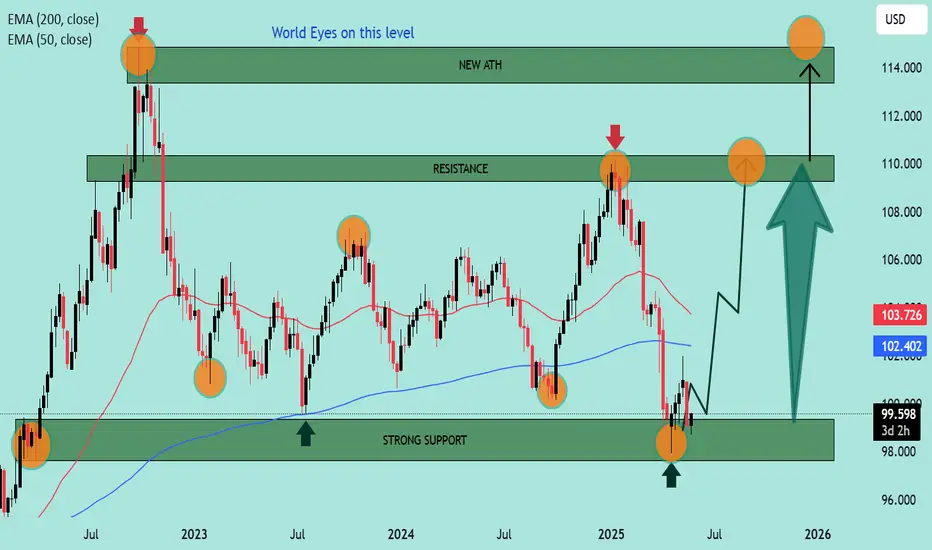
The DXY (U.S. Dollar Index) chart illustrates a significant technical structure between strong historical support and resistance zones, with potential for a bullish reversal after a key level retest.
🟢 Key Support Zone: 99.000 – 98.000
📍 Labeled as "STRONG SUPPORT", this zone has held multiple times:
Previous bounce: Early 2023 ✅
Mid-2024 rebound ✅
Current price action once again shows a reaction from this level with a bullish candle forming 🔥
📌 EMA Confluence:
The 200 EMA (blue) sits at 102.401
The 50 EMA (red) at 103.725
Price is currently below both EMAs but near the 200 EMA, suggesting potential for a mean reversion bounce 📈
🔴 Resistance Zones to Watch:
Resistance Zone: 109.000 – 110.000
⛔ Historically rejected in late 2023 and again in early 2025
🧱 Acting as a supply zone — watch for rejection or breakout
ATH Supply Zone: 113.000 – 114.000
🚨 This is a major psychological and technical barrier
🫡 Marked as “NEW ATH” – would need strong momentum and fundamentals for a breakout above this level
📈 Price Action Expectations:
With strong support respected again, a bullish reversal toward 109.000 – 110.000 appears likely (as illustrated by the arrow).
If momentum continues, a retest of ATH zone is on the cards 🔭
However, a failure to hold support could lead to breakdown below 98.000 – watch closely 🔍
🧭 Strategic Insight
Bullish Bias while above support (98.000 zone)
Reversal Confirmation needed above 102.401 (200 EMA) and 103.725 (50 EMA)
Watch for rejection near 110.000 resistance before ATH test
📌 Final Note:
🧊 World Eyes on this Level – As highlighted on the chart, the current support area is under global observation, reinforcing its importance.
🕵️♂️ Stay alert for breakout volume and fundamental catalysts (e.g., Fed decisions, CPI, jobs data).
Technical Analysis of DXY (US Dollar Index) for the Week of May # Current Price Action and Market Context
Recent Price Movement: As of May 23, 2025, the DXY closed at approximately 99.11, down 0.85% from the previous session's close of 99.96. The index has been trending downward, testing two-week lows near 99.14 after failing to reclaim the 100.50 level.
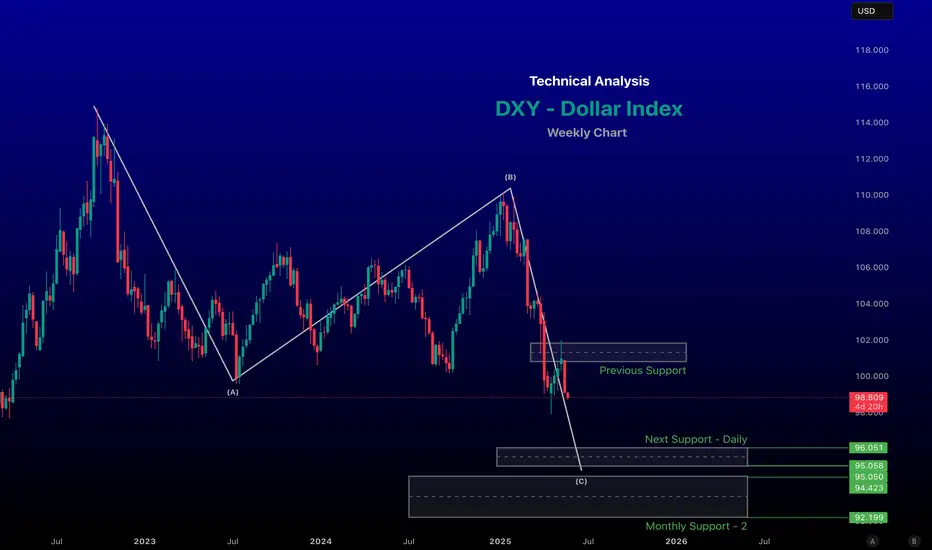
Bearish Momentum: The break below 97.50 on the monthly chart signals a bearish structure with lower highs and lower lows, suggesting continued selling pressure. The next major downside target is around 96.00, with a potential longer-term target near 92.00.
Key Fundamental Drivers: Recent weakness in the DXY is attributed to President Trump’s proposed 50% tariffs on European imports, which have undermined bullish momentum in the dollar. Additionally, anticipation of Federal Reserve interest rate decisions, upcoming US inflation data, and employment reports (e.g., Non-Farm Payrolls) will play a significant role in the DXY’s direction.
-- Chart for your reference --
-- Disclaimer --
This analysis is based on recent technical data and market sentiment from web sources and X posts. It is for informational purposes only and not financial advice. Trading involves high risks, and past performance does not guarantee future results. Always conduct your own research or consult a SEBI-registered advisor before trading.
DXY Bearish Setup: Sell from Supply Zone to 99.100 TargetTrend: 📉 Bearish Bias
Key Zones & Strategy:
🔶 Supply Zone (Sell Area)
📍 100.584 – 100.906
⚠️ Price may face selling pressure here
🔵 Entry Point:
🎯 100.584 (bottom of supply zone)
🔴 Stop Loss:
❌ 100.906 (just above resistance)
🟢 Target Point:
✅ 99.100
📉 Aligned with lower support line
Technical Indicators:
📏 Descending Channel
🔽 Price moving within parallel downward trend lines
📊 EMA (70) – Orange Line
🔁 Acting as dynamic resistance
Trade Setup Summary:
📌 Sell in the Supply Zone
🛑 Stop Loss: 100.906
🎯 Target: 99.100
⚖️ Good Risk-Reward Ratio
Warnings & Tips:
⚡ Watch for Breakouts:
If price breaks above 100.906 ➡️ 📈 Bearish idea invalid
📰 Check News Events:
FOMC, CPI, or other USD events may cause volatility

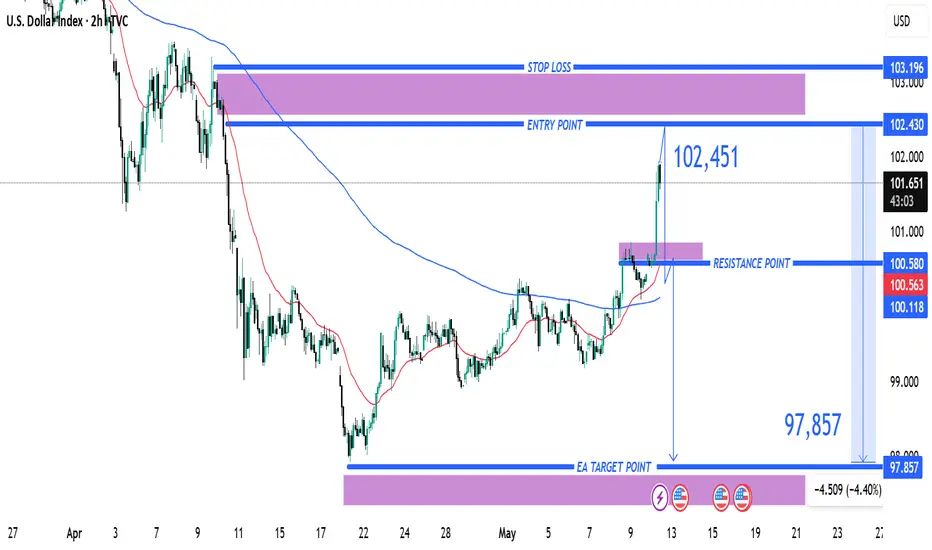
(DXY) Short Setup: Reversal Expected from Resistance Zone1. Entry Point: ~102.430
The price is currently below this level at 101.583, suggesting a potential short setup once the entry level is reached or confirmed.
2. Stop Loss: ~103.196
This is the price level where losses are limited if the trade moves against the intended direction. It's placed above a strong resistance zone.
3. Resistance Point: ~100.580
This was a previous resistance level which has now been broken, indicating a bullish push. The current price is above this, which may signal a breakout.
4. EA Target Point: ~97.857
The take-profit level, significantly lower, indicating a bearish target. This suggests a short position is intended from the entry point.
Indicators and Signals
The chart uses moving averages (likely 50 EMA and 200 EMA), and the price has surged above them, often a bullish signal.
However, the analysis seems to anticipate a reversal from the 102.430 level, expecting a drop back down toward 97.857.
The move from the current price to the target would be a 4.40% decline, a significant move for an index.
Trade Plan Summary
Trade Type: Likely a short/sell from the 102.430 level.
Risk: ~0.77 (103.196 - 102.430)
Reward: ~4.57 (102.430 - 97.857)
Risk-to-Reward Ratio: Approx. 1:6, which is favorable if the setup works out.
"Plan the Short: DXY Targeting 98.004 "2. Current Price:
Around 99.587 💵
3. Indicators:
EMA 70 (Exponential Moving Average) ➡️ 99.442 📈
Price is dancing around the EMA, meaning trend is a bit bullish for now.
4. Chart Pattern:
Price moving inside an ascending channel 📈➰
Bouncing between channel support and resistance levels ⚡
5. Trading Plan:
Wait for price to reach the blue resistance zone ⬛ (around 100.5 to 100.9)
Look for sell (short) signals after reaching there ⛔
Expecting a reversal and drop down to target 98.004 🎯
6. Stop Loss & Target:
STOP LOSS: 🔴 100.870 (above resistance zone)
TARGET: 🎯 98.004
7. Key Observations:
Current Trend: Short-term bullish 📈 inside channel
Expected Move: Reach blue box ➡️ sell ➡️ fall toward 98.004 📉
News Events: Upcoming 📅🔔 (could create volatility)
Summary:
* 📈 Uptrend inside a channel.
* ⬛ Wait for price to hit the blue zone (100.5–100.9).
* ⛔ Look for short signals in the zone.
* 🔴 Stop Loss: 100.870.
* 🎯 Target: 98.004.
* ⚡ Watch out for news events that can move the market!

"DXY Bearish Setup: Sell from SBR Zone with Target at 97.800"1. Trendline Support Break:
🟡🟡🟡🟡
These yellow dots mark previous higher lows on the ascending trendline — now broken, hinting at a possible bearish reversal.
2. EMA (7):
🟠 ➖
This orange line is the 7-period EMA, hovering above the price, showing bearish momentum in the short term.
3. SBR + DBD Zone (Sell Zone):
🔵 SBR/DBD Zone
📍 Entry Point: 99.880
❌ Stoploss: 100.390
This blue zone is a Sell on Rally area. The chart suggests price might revisit this zone and then face rejection.
4. Price Projection Path:
↗️🔁📉
A potential retest of resistance followed by a strong drop is projected. The zigzag line drawn shows the expected movement.
5. Target Point:
🎯 Target: 97.800
📉 Expected drop of 2.04% from entry.
This is the price where the trade aims to take profit.
6. Summary:
🔽 Bearish Bias
🎯 Sell near 99.880
❌ SL at 100.390
✅ TP at 97.800

EMA 30 (Red Line): Currently at 99.700 — tracks short-term trendEMA 30 (Red Line): Currently at 99.700 — tracks short-term trend, and price is hovering near this level.
EMA 200 (Blue Line): At 100.935 — indicates long-term trend, acting as dynamic resistance above.
📈 Trade Setup
✅ Entry Point:
Price: 99.699
Rationale: This level has been tested multiple times, forming a support zone. A bounce here signals a potential long entry.
🎯 Target Point (Take Profit):
Price: 102.738
Distance: ~3.04 points or 3.43% potential move upward.
Note: Marked as EA TARGET POINT, which suggests a calculated area possibly based on previous resistance or algorithmic strategy.
🛑 Stop Loss:
Price: 98.624
Reasoning: Just below the defined support zone (highlighted purple area), ensuring protection against downside breakouts.
📊 Risk-to-Reward Ratio
Entry: 99.699
Target: 102.738 → Gain of ~3.04
Stop: 98.624 → Risk of ~1.08
R/R Ratio: ~2.8:1 — favorable setup
📌 Overall Sentiment
This chart indicates a bullish reversal setup from a strong support zone, possibly targeting a mean reversion or trend reversal toward the 200 EMA and beyond.
However, keep in mind:
The price is currently below both EMAs, so the trend is still bearish.
The trade is counter-trend, relying on support holding and momentum shifting.

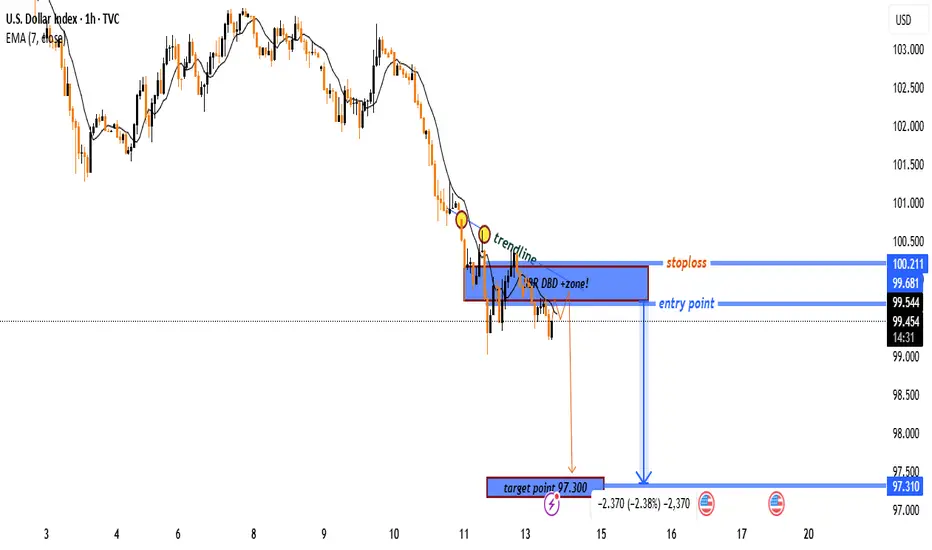
"USD Index Short Setup – Bearish Rejection from Supply Zone (DBD📉 Downtrend confirmed
➖ Lower highs and lower lows
➖ EMA (7) is sloping downward and acting as resistance
➖ Bearish momentum continues
Key Zones & Levels
🔵 Supply Zone (DBD)
🔹 Zone: 99.540 – 99.681
🔹 Label: “Drop-Base-Drop”
🔹 This is where sellers stepped in before – price is retesting it
🔹 Expecting a rejection from this area.
Trade Setup
📍 Entry Point:
🔹 Enter short around 99.540 – 99.681
❌ Stop Loss:
🔺 Set above the zone at 100.211
🚫 Protects against fakeouts
🎯 Target Point:
🔻 Target at 97.300
💰 Risk-Reward: 1:2.4 (Good!)
Visual Summary
📍 Entry: 99.540
❌ Stop Loss: 100.211
🎯 Target: 97.300
📉 Overall Bias: Bearish
✅ Strong RR setup with trend confirmation
U.S. Dollar Index (DXY) –Key Resistance& Bearish Target Analysis📊 Key Observations:
🔵 Resistance Zone (📍~103.5 Level)
A strong resistance area (🔵 blue box) is marked, indicating potential selling pressure if the price reaches this level.
The price is moving upwards (📈) towards this resistance, so watch for rejection or breakout.
🔵 Support/Target Zone (📍~101.5 Level)
A lower support zone (🔵 blue box) is marked as the bearish target 🎯.
If the price fails at resistance, it may head downwards (📉) to this level.
📉 Recent Price Action:
🚀 Sharp drop followed by a rebound (📈).
The price is currently moving back up (🔼), possibly forming a lower high before another drop.
📌 Exponential Moving Average (DEMA 9 - 102.488)
The price is hovering above the 9-period DEMA (📏), showing short-term bullish momentum.
If the price rejects resistance and falls below the DEMA, a bearish continuation (📉) is likely.
🚀 Potential Scenarios:
✅ Bullish Breakout: If price breaks above 🔵 resistance, it may continue rising (📈) to higher levels.
❌ Bearish Rejection: If price fails at resistance, expect a drop (📉) towards 101.5 🎯.

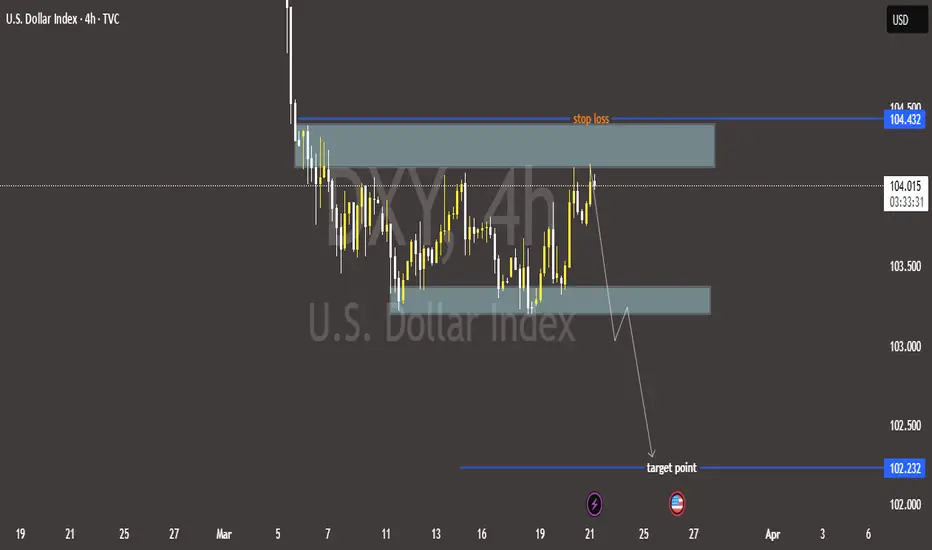
U.S. Dollar Index (DXY) – Bearish Outlook with Key Levels📉 Bearish Bias on U.S. Dollar Index (DXY) – 4H Chart
🔹 Resistance Zone & Stop Loss 🚫
📍 Resistance: 104.200 - 104.432
🛑 Stop Loss: 104.432 (Above resistance zone)
🔸 Support Zone 🛠️
📍 Intermediate Support: 103.300 (Possible bounce)
🔻 Target Point 🎯
📍 Target Price: 102.232 (Expected downside)
📊 Price Action Outlook:
✅ Bearish Scenario:
Price rejected from resistance 🔽
Lower highs forming ⚡
Breakdown expected toward 102.232 🎯
❌ Invalidation:
If price breaks above 104.432, bearish setup fails 🚫
🔥 Conclusion:
⬇️ Sell Bias below 104.200 targeting 102.232
❌ Cut losses if price closes above 104.432
DXY (U.S. Dollar Index) Bearish Trade Setup – Potential DowntrenThis chart is a technical analysis of the U.S. Dollar Index (DXY) on a 1-hour timeframe. Here's a breakdown of the analysis:
🔹 Chart Overview:
DXY Price: 103.773
Trend: The price has been in an uptrend, but there's a potential for reversal.
Entry Point: 103.816
Stop Loss: 104.096 (Marked in red)
Take Profit (TP) Levels:
TP1: 103.608
TP2: 103.400
Next Target: 103.133
🔹 Analysis:
Trendline Break: The price had been following an ascending trendline, which appears to be broken. This suggests a potential downtrend continuation.
Bearish Setup: The trade setup suggests a short (sell) position.
Risk-Reward Ratio:
The stop loss (104.096) is placed above the recent resistance.
The take profit levels are set at key support zones.
Market Sentiment: If the price stays below 103.816, it may continue dropping toward TP1, TP2, and the Next Target.
🔹 Conclusion:
Bearish Bias 📉: The market could see further downside if the price stays below the entry point.
Trade Idea: Short below 103.816, with a stop at 104.096, and targets at 103.608, 103.400, and 103.133.

DOLLAR INDEX - WILL IT BREAK DOWN OR CLIMB HIGHER?Symbol - DXY
The U.S. Dollar Index (DXY) is currently trading within a key support zone, which has historically acted as a pivotal level for price action. A clear double top pattern has emerged on the larger time frame, signaling a potential bearish reversal. A breakdown below this support area would likely signify a shift in the short-term trend of the U.S. Dollar, with the potential for a move lower.
Despite this, there remains an underlying expectation in the global markets that the U.S. Dollar will stay elevated in the medium term due to factors such as President Trump’s policies, tariffs, and rising geopolitical fragmentation. However, much of this has already been priced into the currency, and the current price action is showing signs of weakness, suggesting that the Dollar may be poised for a pullback.
From a technical perspective, a decisive breakdown below the support zone would imply a trend change, with further downside potential. Traders and investors may need to reassess their outlook for the U.S. Dollar if this level is breached.
Key support levels: 107.60, 107.40
Key resistance levels: 108.35, 108.50
On the other hand, if the price holds above the support area and key upcoming data, such as the Non-Farm Payrolls (NFP) and Consumer Price Index (CPI), continue to support the Dollar’s strength, there is potential for the index to continue its upward trajectory. In this alternate scenario, the previous bullish trend for the U.S. Dollar could resume, especially if these data points align with expectations and signal ongoing economic strength. Therefore, the outlook for the U.S. Dollar remains contingent on the price action at the current support level and upcoming economic data releases.

TRADE IDEA ON SHORT SIDE - US DOLLAR INDEX (DXY)Symbol - DXY
DXY is currently trading at 109.16
My reversal setup has formed in DXY & I'm seeing a trading opportunity on sell side.
Shorting DXY at CMP 109.16
I will add more position if 109.65 comes & will hold with SL 110.05
Targets I'm expecting are 108.00 - 107.30 & below.
Disclaimer - Do not consider this as a buy/sell recommendation. I'm sharing my analysis & my trading position. You can track it for educational purposes. Thanks!

DXY $ since 1972, FED Pivots and What now for ALTS coins ?DXY $ since 1972 and Rate Cuts
When the FED cuts rates, the $ Drops in value most of the time as can be seen here on the chart below
( I have not "Boxed" the current FED Rate cuts to make it easier to see the PA )
This time it has continued to Rise for a number of reasons.
In Fact, ever since that Banking "Accident" in 2008, the DXY has gained in value, on average, but thats another story.
FED has said that Cuts may not occur in 2025. This Could once again make the $ a more attractive buy if other markets are falling. Then the $ could Stop being propped up !
Normally, as $ rises, Crypto struggles - again, we have seen BTC rise at the same time as the $ since July this year.
It is ALTS that have struggled and this may very well continue.
Normally, we wait for BTC/D to drop and then the Money flows into ALTS.. but if the money remains in Bitcoin, the ALT market requires an alternative source of income.
Could we see the DXY $ loose that money ?
But the pause in Rate Cuts may stop that
That War in Finance continues.
TradFi Lost round 1 and now Bitcoin is accepted, used, alllowed and is King. This is why the $ Will remain in Bitcoin, ETF's etc. We may see outflows every now and then but certainly Not the amount that drives the ALT market normally.
Will we even see a bear market again ?
ALTS however, they are the Minions that may yet suffer
The War continues and DeFi, for example, needs to step up and REALLY make it self a Lot more user friendly, attractive and bigger gains in use, stake cases.
2025 is going to be very interesting and Volatile
Don't Get Burnt. Be Cautious, the gains could be huge....as could the losses

DXY Bearish Setup Update - DXY is currently trading at 105.7 and it exactly got rejected from my POI
- DXY looks all set to mitigate 103.8, bringing more upside to all pairs denominated by USD, risky assets like Crypto, and Stocks.
- Watch out for 103.8 and 101.9 to expect another leg up from
- We have a market structure shift from 103.3 if we flip below that on a weekly TF, we might soon see DXY turning bearish.
- DXY can soon show impulsive moves on Monday post bullish commentaries

DXY PARABOLIC SETUP Update- DXY is currently trading at 107.4
- DXY has made a lot of USD-denominated pairs bleed and they are still getting slaughtered
- DXY is currently at a point where there's a lot of limit sell stops above the buy side liquidity
- Once the orders are consumed we might see another round of Impulse up to the marked displacement of 110-111$
- DXY pumping along with the Equity market, Crypto isn't a good sign there's a negative smart money divergence laying that's trapping and sucking liquidity from retail suckers.
- Sit at the sidelines and keep locking in gains until you see DXY flipping its structure to bearish
- Retail pattern traders might get flushed when they call this a double bottom.

Dollar Looks Vulnerable : Here’s My Take on What’s Coming Next!Price has recently taken out an Old High and has now reached an Imbalanced price range, which is more evident on the Weekly Timeframe.
This move has presented buyside liquidity for sellers by taking out the Old High and simultaneously offered fair value by entering into an imbalanced price range (FVG / SIBI - 1W Timeframe).
From here, price may now head lower towards the Draw on Liquidity, with Sellside Liquidity as the next objective, as shown in the chart.
This is how I see it, though I’d advise you to do your own analysis.

DXY Ready to Soar?📈 DXY Analysis & Forecast (US Dollar Index) 🚀
Current Structure:
The DXY appears to be in the middle of an impulsive wave sequence based on Elliott Wave theory, currently moving within the 4th wave correction phase. The overall structure shows a clear upward trend, supported by a rising trendline that has consistently held as support. We can observe a potential breakout setup, with a contracting triangle pattern indicating a breakout to the upside.
Key Technical Points:
Wave Count Analysis:
🌀 Wave (1) initiated a strong bullish move after breaking out of the downward channel.
🔄 Wave (2) saw a retracement, respecting the previous resistance level that turned into support.
🚀 Wave (3) was an impulsive rally, taking the DXY to new highs and confirming bullish momentum.
📉 Wave (4) is forming a consolidation, resembling a bullish pennant pattern, indicating a continuation of the uptrend.
Key Support & Resistance Levels:
Support: The price is currently holding above the key support zone at 106.20, which aligns with the trendline.
Resistance: The next target for the bulls would be the previous swing high at 107.40, which is the completion zone for Wave (5).
Indicators & Patterns:
📊 The ascending trendline continues to support the bullish bias.
🔼 A breakout above the 106.80 - 107.00 range could trigger a push towards the 107.40 level.
⚡ Watch for potential fake-outs; a break below 106.20 may invalidate the bullish scenario.
📅 Forecast:
The DXY is poised for an upward move as long as the 106.20 support holds. If the breakout above 106.80 is confirmed, we could see the DXY reaching the 107.40 mark, completing the 5th wave of the current bullish cycle. A decisive close above 107.40 might lead to further gains, potentially aiming for the 108.00 level.
📊 What are your thoughts on this setup? Are you bullish on the DXY? Drop yourcomment below! 👇
🔗 Follow for more Forex updates and daily trading insights!
#DXYAnalysis #ForexSignals #ElliottWave #DollarIndex #ForexTrading #TechnicalAnalysis #USD #ForexCommunity #TradingForecast #MarketUpdate
