DXY Bullish Reversal & Cup FormationThe DXY (US Dollar Index) is exhibiting a strong bullish reversal pattern, with multiple technical signals suggesting upward momentum:
🔍 Technical Analysis Summary:
✅ Support Holding Strong:
Price has respected the horizontal support zone around 98.00–98.50 on multiple occasions (highlighted by orange circles and green arrows), forming a solid base.
✅ Breakout from Downtrend:
A clear breakout above two descending trendlines (black and blue) indicates a shift from bearish to bullish sentiment.
✅ Cup Pattern Formation ☕:
A textbook Cup pattern is visible, where price formed a rounded bottom — a bullish continuation formation. The handle is minor and price has broken above the neckline (around 99.00), signaling a potential continuation toward the target.
✅ Bullish Target 🎯:
Based on the cup pattern and prior resistance, the projected target is around 101.846, aligning with previous major resistance.
📌 Key Levels to Watch:
Support Zone: 98.00 – 98.50
Immediate Resistance: 99.50 – 100.00
Major Resistance/Target: 101.846
🧭 Outlook:
As long as the price remains above the 98.50 zone, the bullish scenario remains intact. The cup breakout indicates strong buying pressure, and momentum could push DXY toward the 101.846 target in the coming sessions.
Dxyforecast

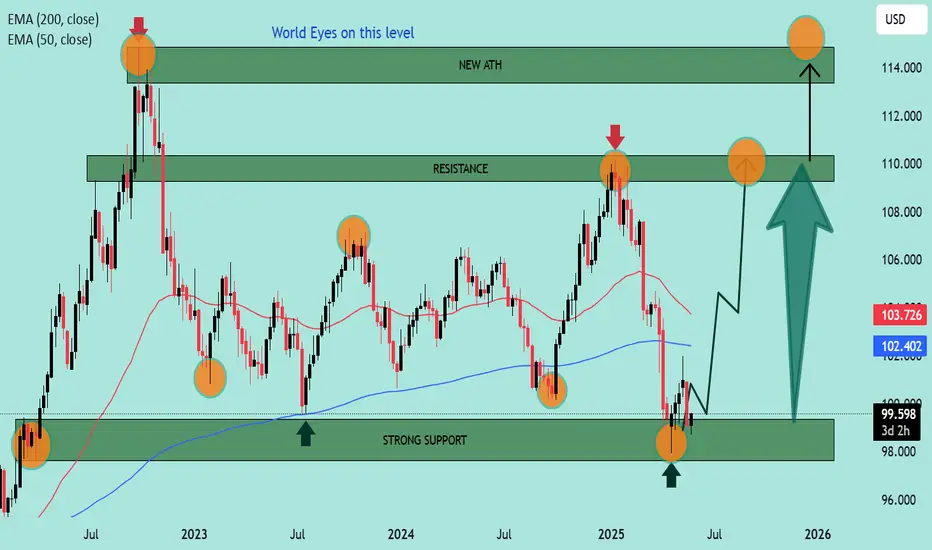
DXY Technical Outlook – Strong Support Test and Bullish Reversa Chart Summary
The DXY (U.S. Dollar Index) chart illustrates a significant technical structure between strong historical support and resistance zones, with potential for a bullish reversal after a key level retest.
🟢 Key Support Zone: 99.000 – 98.000
📍 Labeled as "STRONG SUPPORT", this zone has held multiple times:
Previous bounce: Early 2023 ✅
Mid-2024 rebound ✅
Current price action once again shows a reaction from this level with a bullish candle forming 🔥
📌 EMA Confluence:
The 200 EMA (blue) sits at 102.401
The 50 EMA (red) at 103.725
Price is currently below both EMAs but near the 200 EMA, suggesting potential for a mean reversion bounce 📈
🔴 Resistance Zones to Watch:
Resistance Zone: 109.000 – 110.000
⛔ Historically rejected in late 2023 and again in early 2025
🧱 Acting as a supply zone — watch for rejection or breakout
ATH Supply Zone: 113.000 – 114.000
🚨 This is a major psychological and technical barrier
🫡 Marked as “NEW ATH” – would need strong momentum and fundamentals for a breakout above this level
📈 Price Action Expectations:
With strong support respected again, a bullish reversal toward 109.000 – 110.000 appears likely (as illustrated by the arrow).
If momentum continues, a retest of ATH zone is on the cards 🔭
However, a failure to hold support could lead to breakdown below 98.000 – watch closely 🔍
🧭 Strategic Insight
Bullish Bias while above support (98.000 zone)
Reversal Confirmation needed above 102.401 (200 EMA) and 103.725 (50 EMA)
Watch for rejection near 110.000 resistance before ATH test
📌 Final Note:
🧊 World Eyes on this Level – As highlighted on the chart, the current support area is under global observation, reinforcing its importance.
🕵️♂️ Stay alert for breakout volume and fundamental catalysts (e.g., Fed decisions, CPI, jobs data).
Technical Analysis of DXY (US Dollar Index) for the Week of May # Current Price Action and Market Context
Recent Price Movement: As of May 23, 2025, the DXY closed at approximately 99.11, down 0.85% from the previous session's close of 99.96. The index has been trending downward, testing two-week lows near 99.14 after failing to reclaim the 100.50 level.
Bearish Momentum: The break below 97.50 on the monthly chart signals a bearish structure with lower highs and lower lows, suggesting continued selling pressure. The next major downside target is around 96.00, with a potential longer-term target near 92.00.
Key Fundamental Drivers: Recent weakness in the DXY is attributed to President Trump’s proposed 50% tariffs on European imports, which have undermined bullish momentum in the dollar. Additionally, anticipation of Federal Reserve interest rate decisions, upcoming US inflation data, and employment reports (e.g., Non-Farm Payrolls) will play a significant role in the DXY’s direction.
-- Chart for your reference --
-- Disclaimer --
This analysis is based on recent technical data and market sentiment from web sources and X posts. It is for informational purposes only and not financial advice. Trading involves high risks, and past performance does not guarantee future results. Always conduct your own research or consult a SEBI-registered advisor before trading.
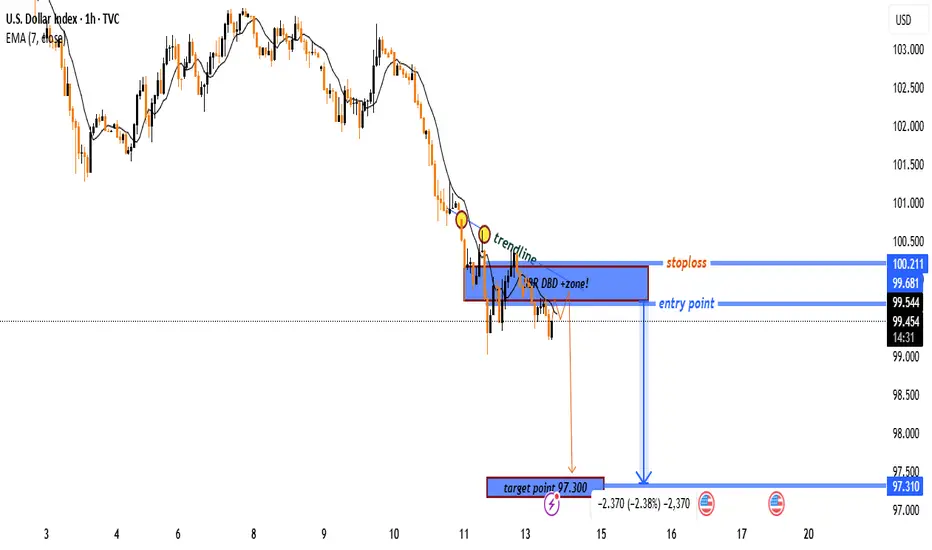
"DXY Bearish Setup: Sell from SBR Zone with Target at 97.800"1. Trendline Support Break:
🟡🟡🟡🟡
These yellow dots mark previous higher lows on the ascending trendline — now broken, hinting at a possible bearish reversal.
2. EMA (7):
🟠 ➖
This orange line is the 7-period EMA, hovering above the price, showing bearish momentum in the short term.
3. SBR + DBD Zone (Sell Zone):
🔵 SBR/DBD Zone
📍 Entry Point: 99.880
❌ Stoploss: 100.390
This blue zone is a Sell on Rally area. The chart suggests price might revisit this zone and then face rejection.
4. Price Projection Path:
↗️🔁📉
A potential retest of resistance followed by a strong drop is projected. The zigzag line drawn shows the expected movement.
5. Target Point:
🎯 Target: 97.800
📉 Expected drop of 2.04% from entry.
This is the price where the trade aims to take profit.
6. Summary:
🔽 Bearish Bias
🎯 Sell near 99.880
❌ SL at 100.390
✅ TP at 97.800

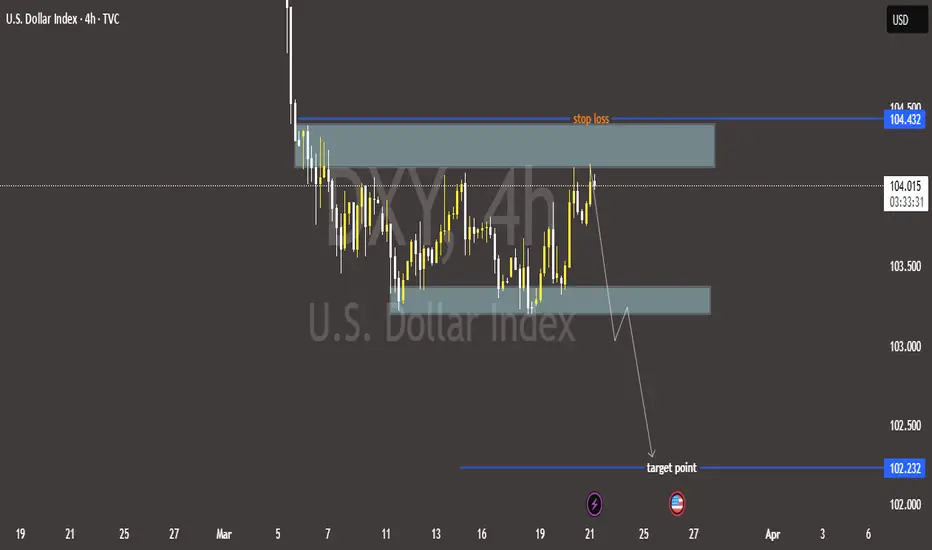
"USD Index Short Setup – Bearish Rejection from Supply Zone (DBD📉 Downtrend confirmed
➖ Lower highs and lower lows
➖ EMA (7) is sloping downward and acting as resistance
➖ Bearish momentum continues
Key Zones & Levels
🔵 Supply Zone (DBD)
🔹 Zone: 99.540 – 99.681
🔹 Label: “Drop-Base-Drop”
🔹 This is where sellers stepped in before – price is retesting it
🔹 Expecting a rejection from this area.
Trade Setup
📍 Entry Point:
🔹 Enter short around 99.540 – 99.681
❌ Stop Loss:
🔺 Set above the zone at 100.211
🚫 Protects against fakeouts
🎯 Target Point:
🔻 Target at 97.300
💰 Risk-Reward: 1:2.4 (Good!)
Visual Summary
📍 Entry: 99.540
❌ Stop Loss: 100.211
🎯 Target: 97.300
📉 Overall Bias: Bearish
✅ Strong RR setup with trend confirmation
U.S. Dollar Index (DXY) –Key Resistance& Bearish Target Analysis📊 Key Observations:
🔵 Resistance Zone (📍~103.5 Level)
A strong resistance area (🔵 blue box) is marked, indicating potential selling pressure if the price reaches this level.
The price is moving upwards (📈) towards this resistance, so watch for rejection or breakout.
🔵 Support/Target Zone (📍~101.5 Level)
A lower support zone (🔵 blue box) is marked as the bearish target 🎯.
If the price fails at resistance, it may head downwards (📉) to this level.
📉 Recent Price Action:
🚀 Sharp drop followed by a rebound (📈).
The price is currently moving back up (🔼), possibly forming a lower high before another drop.
📌 Exponential Moving Average (DEMA 9 - 102.488)
The price is hovering above the 9-period DEMA (📏), showing short-term bullish momentum.
If the price rejects resistance and falls below the DEMA, a bearish continuation (📉) is likely.
🚀 Potential Scenarios:
✅ Bullish Breakout: If price breaks above 🔵 resistance, it may continue rising (📈) to higher levels.
❌ Bearish Rejection: If price fails at resistance, expect a drop (📉) towards 101.5 🎯.

U.S. Dollar Index (DXY) – Bearish Outlook with Key Levels📉 Bearish Bias on U.S. Dollar Index (DXY) – 4H Chart
🔹 Resistance Zone & Stop Loss 🚫
📍 Resistance: 104.200 - 104.432
🛑 Stop Loss: 104.432 (Above resistance zone)
🔸 Support Zone 🛠️
📍 Intermediate Support: 103.300 (Possible bounce)
🔻 Target Point 🎯
📍 Target Price: 102.232 (Expected downside)
📊 Price Action Outlook:
✅ Bearish Scenario:
Price rejected from resistance 🔽
Lower highs forming ⚡
Breakdown expected toward 102.232 🎯
❌ Invalidation:
If price breaks above 104.432, bearish setup fails 🚫
🔥 Conclusion:
⬇️ Sell Bias below 104.200 targeting 102.232
❌ Cut losses if price closes above 104.432
DOLLAR INDEX - WILL IT BREAK DOWN OR CLIMB HIGHER?Symbol - DXY
The U.S. Dollar Index (DXY) is currently trading within a key support zone, which has historically acted as a pivotal level for price action. A clear double top pattern has emerged on the larger time frame, signaling a potential bearish reversal. A breakdown below this support area would likely signify a shift in the short-term trend of the U.S. Dollar, with the potential for a move lower.
Despite this, there remains an underlying expectation in the global markets that the U.S. Dollar will stay elevated in the medium term due to factors such as President Trump’s policies, tariffs, and rising geopolitical fragmentation. However, much of this has already been priced into the currency, and the current price action is showing signs of weakness, suggesting that the Dollar may be poised for a pullback.
From a technical perspective, a decisive breakdown below the support zone would imply a trend change, with further downside potential. Traders and investors may need to reassess their outlook for the U.S. Dollar if this level is breached.
Key support levels: 107.60, 107.40
Key resistance levels: 108.35, 108.50
On the other hand, if the price holds above the support area and key upcoming data, such as the Non-Farm Payrolls (NFP) and Consumer Price Index (CPI), continue to support the Dollar’s strength, there is potential for the index to continue its upward trajectory. In this alternate scenario, the previous bullish trend for the U.S. Dollar could resume, especially if these data points align with expectations and signal ongoing economic strength. Therefore, the outlook for the U.S. Dollar remains contingent on the price action at the current support level and upcoming economic data releases.

TRADE IDEA ON SHORT SIDE - US DOLLAR INDEX (DXY)Symbol - DXY
DXY is currently trading at 109.16
My reversal setup has formed in DXY & I'm seeing a trading opportunity on sell side.
Shorting DXY at CMP 109.16
I will add more position if 109.65 comes & will hold with SL 110.05
Targets I'm expecting are 108.00 - 107.30 & below.
Disclaimer - Do not consider this as a buy/sell recommendation. I'm sharing my analysis & my trading position. You can track it for educational purposes. Thanks!

Dollar Looks Vulnerable : Here’s My Take on What’s Coming Next!Price has recently taken out an Old High and has now reached an Imbalanced price range, which is more evident on the Weekly Timeframe.
This move has presented buyside liquidity for sellers by taking out the Old High and simultaneously offered fair value by entering into an imbalanced price range (FVG / SIBI - 1W Timeframe).
From here, price may now head lower towards the Draw on Liquidity, with Sellside Liquidity as the next objective, as shown in the chart.
This is how I see it, though I’d advise you to do your own analysis.

DXY Ready to Soar?📈 DXY Analysis & Forecast (US Dollar Index) 🚀
Current Structure:
The DXY appears to be in the middle of an impulsive wave sequence based on Elliott Wave theory, currently moving within the 4th wave correction phase. The overall structure shows a clear upward trend, supported by a rising trendline that has consistently held as support. We can observe a potential breakout setup, with a contracting triangle pattern indicating a breakout to the upside.
Key Technical Points:
Wave Count Analysis:
🌀 Wave (1) initiated a strong bullish move after breaking out of the downward channel.
🔄 Wave (2) saw a retracement, respecting the previous resistance level that turned into support.
🚀 Wave (3) was an impulsive rally, taking the DXY to new highs and confirming bullish momentum.
📉 Wave (4) is forming a consolidation, resembling a bullish pennant pattern, indicating a continuation of the uptrend.
Key Support & Resistance Levels:
Support: The price is currently holding above the key support zone at 106.20, which aligns with the trendline.
Resistance: The next target for the bulls would be the previous swing high at 107.40, which is the completion zone for Wave (5).
Indicators & Patterns:
📊 The ascending trendline continues to support the bullish bias.
🔼 A breakout above the 106.80 - 107.00 range could trigger a push towards the 107.40 level.
⚡ Watch for potential fake-outs; a break below 106.20 may invalidate the bullish scenario.
📅 Forecast:
The DXY is poised for an upward move as long as the 106.20 support holds. If the breakout above 106.80 is confirmed, we could see the DXY reaching the 107.40 mark, completing the 5th wave of the current bullish cycle. A decisive close above 107.40 might lead to further gains, potentially aiming for the 108.00 level.
📊 What are your thoughts on this setup? Are you bullish on the DXY? Drop yourcomment below! 👇
🔗 Follow for more Forex updates and daily trading insights!
#DXYAnalysis #ForexSignals #ElliottWave #DollarIndex #ForexTrading #TechnicalAnalysis #USD #ForexCommunity #TradingForecast #MarketUpdate

US DOLLAR INDEX - TRADE IDEA ON SHORT SIDESymbol - DXY
DXY is currently trading at 105.57
My reversal setup has formed in DXY & I'm seeing a trading opportunity on sell side.
Shorting DXY at CMP 105.57
I will add more position if 106.00 comes & will hold with SL 106.30
Targets I'm expecting are 104.75 - 104.30 - 103.73 & below.
Disclaimer - Do not consider this as a buy/sell recommendation. I'm sharing my analysis & my trading position. You can track it for educational purposes. Thanks!

DXY - TRADE OPPORTUNITY ON SHORT SIDESymbol - DXY
DXY is currently trading at 104.72
My reversal setup has formed in DXY & I'm seeing a trading opportunity on sell side.
Shorting DXY at CMP 104.72
I will add more position if 104.45 comes & will hold with SL 104.75
Targets I'm expecting are 103.25 - 102.75 - 102.15
Disclaimer - Do not consider this as a buy/sell recommendation. I'm sharing my analysis & my trading position. You can track it for educational purposes. Thanks!

DXY Analysis: Bearish Trend Signals Potential Drop📊 DXY Analysis (2H Chart) 🧐
The U.S. Dollar Index is currently in a consolidation phase around the 104.50 level after a sharp drop from the recent highs. Let’s break down what the technicals are signaling:
1. Bearish Structure 📉:
• The index has been trading within a descending channel, which indicates a prevailing bearish trend.
• A significant Cross Doji candle at the top hints at a potential reversal, followed by strong bearish momentum.
2. Key Levels to Watch 🔍:
• Resistance Zone: The DXY is consolidating below the 104.60 level, which is acting as a key resistance. Multiple rejections around this area could signify strong selling pressure.
• Support Zone: The next major support lies around the 103.60 level, aligning with the lower boundary of the channel.
3. EMA Dynamic Resistance 💡:
• The 50-period EMA (green line) is currently acting as a dynamic resistance. A sustained move below this EMA can add further downside pressure.
4. Potential Scenario 🔮:
• If the DXY fails to break above the 104.60 resistance, we could see a drop towards the 104.00 level initially.
• A break below the 104.00 support might accelerate the move toward the 103.60 zone, completing the bearish leg.
📉 Bearish Outlook: Unless we see a breakout above the consolidation zone and a close above the descending channel, the bias remains bearish for the DXY in the short term.
🔗 Follow for more daily updates on forex market analysis!
#DXY #DollarIndex #ForexAnalysis #TechnicalAnalysis #USD #TradingSignals #ForexTrading #ForexTrader #PriceAction #TradingStrategy #ForexMarket #USDIndex #CurrencyTrading #MarketAnalysis #TradingView #ForexLife #FinancialMarkets #DayTrading #SwingTrading #ForexCommunity #TraderLife #ChartAnalysis #TradingPsychology #Investing #ForexTips #TradingSetups

DXY gearing up for a big fallDate: 30 Oct’24
Symbol: DXY
Timeframe: Weekly
US Dollar Currency Index currently seems to be in final stages of Wave (e) of B. One more leg up and DXY will be ready to head lower sharply and in a big way. It is likely to head towards 90 and lower. This also means with DXY treading lower, Nifty is likely to witness an up move.
This is not a trade recommendation. Please do your own analysis.
US Dollar Currency Index vartamaan mein Wave B (e) ke antim charan mein lagta hai. Ek aur pair upar aur DXY teji se aur bade paimaane par neeche jaane ke lie taiyaar hoga. Iske 90 aur usase kam kee or badhane kee sambhaavana hai. Iska matalab yah bhee hai ki DXY ke nichale star par chalane se Nifty mein teji dekhne ko mil sakti hai.
Yah koi trade karne ki salah nahin hai. Kripya apana vishleshan khud karen.


#DOLLAR INDEX (DXY)Dollar index is done with upside. Looking good for a tgt of 105.360 in coming days. Chart is self-explanatory.

DXY 1D Timeframe ProjectionDXY 1D Timeframe Projection
DXY - Data Global forecasts say it will decline. Yes, it may, but the dollar is still rising today.
DISCLAIMER: All labelling and wave counts are done by me manually and I will keep changing according to the LIVE MARKET PRICE ACTION. So don't be bias, hope on my trade plans...try to learn, and make your strategy... Following is not that easy...

DXYIt could move upwards to the white trend line 115
Disclaimer:
It's a personal view not a financial advise and I assume no responsibility and liability whatever outcome arises.

DXY next week overview - !06.500 or !03.800 ???the upcoming week ahead bring alot of volatility have days with events and major ones
Recap -
the previous week was more based on sharp turns that has tested important level and broken important level
but left behind some imbalance that given a strong sign or outperformance by DXY
What to Expect - 104.300 the price breakout now the upside potential liquidity would be 105
and there after we have higher time frame (M, W) bearish order block
but the price with big bars has left behind some fair value area
which might holding some good liquidity to fuel if the price expect the upside momentum
Key Area -
keep eye on 103.700 > 103.400 > 102.850
conclusion try to buy with limit order on key area rather than going short

DXY might go down by 3% to 5% After the highs of 107+ price , since price went bearish that has created a monthly bearish FVG that is marked in orange , price after reaching 101 lvl mitigated the open Bullish FVG on higher time frame, which leads to price bouncing back towards the zone of Bearish FVG
currently price is getting rejected and due to higher time frame giving the bearish bias
with run away gap from monthly bearish FVG
DXY need to go down sweep some liquidity and mitigate the 98 lvl which bullish open fvg

Dollar Index In TroubleBig Blow To DXY
Weekly Close Below 105.95 Trouble Will Arise.
SL - 107.35
Stay Cautious With US Market.

EURUSD is ready to fly 100+ PipsThe Reason posting this we have clean SMT Between EURUSD and DXY.
EURUSD did MSB in LTF and hit 1h Demand, possible ready to pump during London Open or NYO
About DXY price could drop below original consolidation.
More update you can find later
