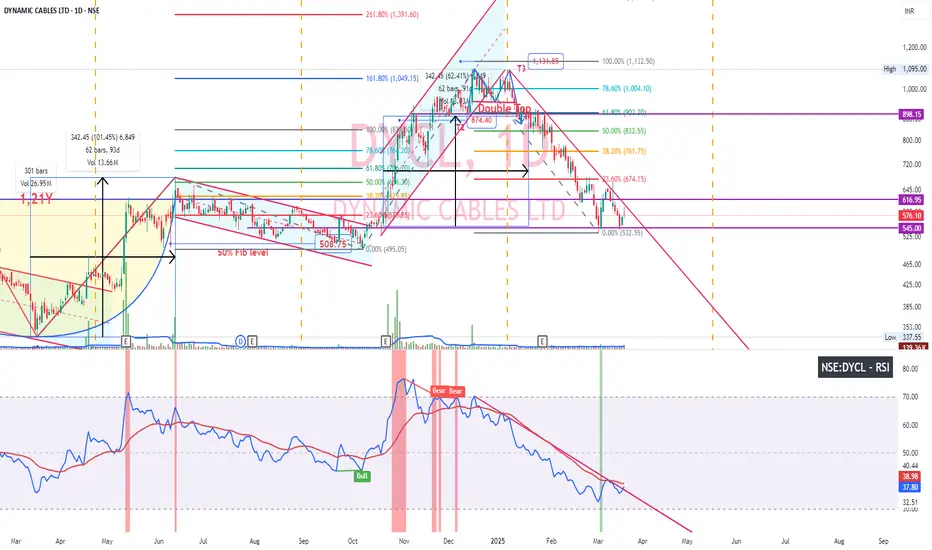
DYCL RSI Breakout - D timeframeDYCL Dynamic cables daily chart. After exiting parallel channel, DYCL made double top formation and fell 41% breaking down neckline during Jan-Mar '25 correction despite good Q3 result YoY.
Now Daily chart displaying double bottom formation in price chart and RSI.
Mar 18 shows bullish harami and Mar 19 shows inverted hammer. Bullish patterns in daily chart. So far volume isn't satisfactory. May 17 (this week) Weekly chart shows hammer pattern, but RSI is taking nose dive. Let's see if daily chart makes the weekly chart better in upcoming days.
Considering demand in cables, DYCL is a good bet. I don't think recent entry of big player (Ultratech cement) to cable industry would affect much atleast for next year.
Dynamiccables
Dynamic cables Triangle Breakout RoaringTriangle pattern breakout. After hitting T2 1131.85, Will head to 1391.60 which is 261.8% Fib level

Cables - Power Potential breakoutCables looking good. Huge demand in cables for next 5 years across multiple sectors. Every player in the industry will get a pie of that demand. RSI daily chart double bottom looking for breakout. Price chart made trendline breakout.

Dynamic Cables cmp 541.90 by Weekly Chart views since listed*Dynamic Cables cmp 541.90 by Weekly Chart views since listed*
- 500 to 520 Support Zone Price Band
- Weekly basis Support at 500 > 430 > 360 with Resistance at 587 > 623 > ATH 680
- Stock Price running along upside by Rising Support Trendline and waiting to cross above Falling Resistance Trendline

Demand in cablesInfrastructure, Railways, Power all these sectors/Industries are bullish and have demand. Cables top player polycab has informed there will be enough demand that everyone will get a good pie in cables industry. Among cables, fundamentals of Dynamic cables is good and also making cup & handle pattern. This company too has huge potential for growth.

Dynamic Cables Ltd buy callstock strong consolidation repeated breakout.
buy @205 ttgt-250\300\500
stock strong consolidation repeated breakout.
buy @205 ttgt-250\300\500
stock strong consolidation repeated breakout.
buy @205 ttgt-250\300\500

Blast off 🚀 🚀 1737 -- 2243 within ( 2nd Sep 2024 to 9th Dec 2024 )
Disclaimer :
It's a personal view not a financial advise and I assume no responsibility and liability whatever outcome arises.

DYNAMIC CABLES - DAY CHART - 25.01.2023 - BAHAVAN CAPITALDYNAMIC CABLES as per day chart analysis
Stock ABOVE 211 TARGET 214
Happy Profitable Trading to All...

DYNAMIC CABLES - DAY CHART - 22.01.2023 - BAHAVAN CAPITALDYNAMIC CABLES as per day chart analysis
Stock ABOVE 217 TARGET 221
Happy profitable Trading to All..

DYNAMIC CABLES - DAY CHART - 12.01.2023 - BAHAVAN CAPITALDYNAMIC CABLES as per day chart analysis
Stock ABOVE 208 TARGET 211
Happy Profitable Trading to All..

DYNAMIC CABLES - DAY CHART - 03.01.2023 - BAHAVAN CAPITALDYNAMIC CABLES as per day chart analysis
STOCK ABOVE 225 TARGET 230
Happy Profitable Trading to all..
