$ONDO Could Be the Next 20x Gem: Are You Ready?LSE:ONDO Could Be the Next 20x Gem: Are You Ready?
Currently in bearish breakdown, but if price falls below $0.50, IMO best accumulation zone starts.
Strong Support Zones:
Support 1: $0.53–$0.46
Support 2: $0.24–$0.20
Targets (Long Term): $5 / $10 (~20x from entry if filled)
Manage risk & DYOR, huge upside if supports hold!
E-signal

Bitcoin LTF Analysis & Market OutlookBitcoin LTF Analysis & Market Outlook
#Bitcoin still doesn’t look strong on LTF, and I’m expecting some more downside movement in the coming days. So if you’re holding high leverage longs, manage them carefully and always use strict stop loss.
Here’s the key structure to watch:
Resistance 1: $116,000
If CRYPTOCAP:BTC fails to break and hold above this level, momentum stays weak and we could revisit the $100,000 zone again.
Resistance 2: $122,500
Only a confirmed breakout above this level can trigger the next leg toward a new ATH around $150,000.
Until then, play defense. Avoid emotional trades, don’t gamble with your hard-earned money, and only take entries backed by clear confluence, strategy, and discipline.
Remember: The market always rewards patience, not greed. Stay alert, follow structure, and let the setup come to you.

Gold Prices Continue to Rise Amid Rate Cuts and Geopolitical RisGold prices today are being strongly supported by growing expectations that the Federal Reserve (FED) will continue to cut interest rates and the increasing demand for safe-haven assets amid rising geopolitical instability.
Last week, the FED made its first rate cut of 0.25% since December, causing gold prices to surge. While some investors took profits, most experts believe the uptrend is not over yet.
This week, investor focus will be on the U.S. Personal Consumption Expenditures (PCE) data for August, the FED's preferred inflation measure, which may provide further clues about future rate cuts. Many forecasts predict a slowdown in core PCE, reinforcing the case for continued rate cuts by the FED.
Additionally, safe-haven flows are further supported by prolonged geopolitical risks, including the Russia-Ukraine conflict and concerns over economic impacts from U.S. tariffs.
Furthermore, strong gold buying activity from global central banks plays a crucial role in strengthening the bullish outlook for the precious metal.

GOLD ANALYSIS IN 30MINHELLO,
there is high probability for gold to reach the 3713$ in few HOURS,
thanks

Ethereum sell sign in 15 min as per indicator To identify potential short-selling opportunities in the stock market, technical indicators can signal a stock is overbought, losing momentum, or entering a downtrend. Short-selling is a high-risk strategy, and these indicators are most effective when used together to confirm signals.

EURUSD TankThis looks like a very good spot to SELL the EURUSD. Economic factors are showing slightly weak US dollar, but COT reports indicate Commercials still have a lot of LONG contracts. This gives a very nice confluence with a 61.8% retracement of last week's bearish move, also paired with an attractive $1.70 price tag along with it.

Gold Surges on Weak NFPHello everyone, what’s your take on XAUUSD?
Gold prices soared at the end of the last session and are now trading around $3,380. This sharp rise followed a weaker-than-expected U.S. Non-Farm Payrolls (NFP) report, which shifted market sentiment toward expectations that the Fed may delay interest rate cuts. As a result, the U.S. dollar weakened and demand for gold as a safe haven surged.
Technically, gold appears to be forming a cup and handle pattern, with the first resistance target at $3,400, followed by $3,435.
What do you think? Could this rally continue? Let us know in the comments!

Gold weakens further – is 3250 next?Hello traders, take a look at the chart — what do you see?
Here’s my perspective:
Recently, gold has shown signs of weakness as the U.S. dollar strengthens amid expectations that the Fed will delay interest rate cuts. In response to this, gold continues to trend lower and is currently hovering around the 3,289 USD mark.
The previous ascending trendline has been broken, and both the EMA 34 and EMA 89 have turned downward, fueling bearish momentum. The 3,320 support level has also failed, and the latest bullish correction was rejected — reinforcing the downtrend.
Given these clear fundamentals and technical confirmations, I expect the bearish momentum to accelerate, at least in the short term.
My immediate target for this move is 3,250 USD.
What about you — where’s your target?

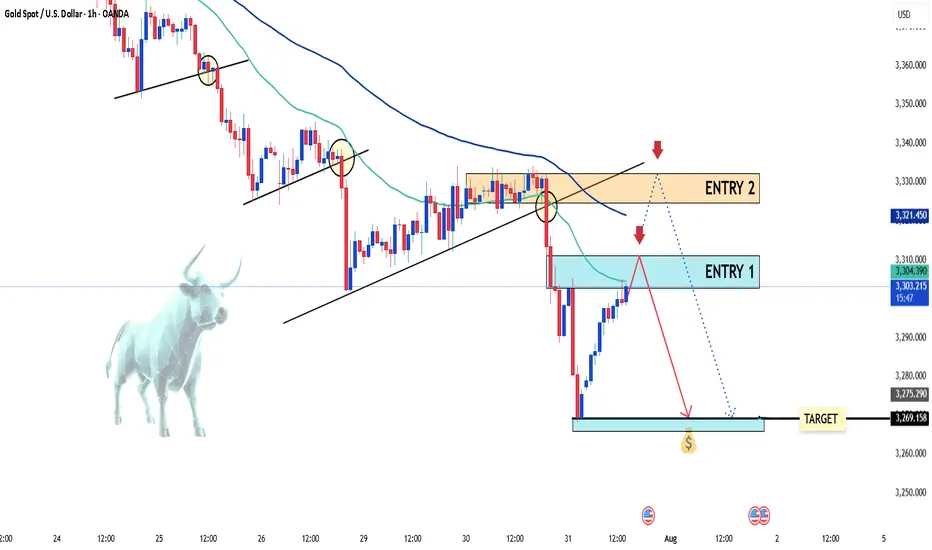
Gold dips again – is the bounce just a trap?Hello traders!
After a quiet start to the day, gold has turned lower and is now hovering around the $3,300 mark. The decline in OANDA:XAUUSD came as U.S. Treasury yields rose in response to strong U.S. economic data. The Fed is widely expected to maintain its current monetary policy stance during today’s session.
From a technical perspective, XAUUSD continues to form bearish structures and breakdowns. While a short-term bullish correction is currently underway, the bears still hold the upper hand — and selling opportunities remain the preferred strategy.
I’ll be focusing on two key entry zones marked on the chart, with a short-term bias favoring sell setups.
Do you agree with this approach?
⚠️ Please remember: This is just a trading idea — make sure to manage your risk properly with defined TP and SL levels.
Good luck and happy trading!
EURUSD at risk of reversal: will sellers take control?Hello everyone! What are your thoughts on EURUSD?
Lately, the euro has been under pressure due to growing weakness in the Eurozone economy. The European Central Bank (ECB) has sent out more cautious signals in response to rising recession risks and cooling inflation. This increases the likelihood that the ECB may wrap up its tightening cycle earlier than the Fed – a shift that could weigh heavily on EURUSD.
From a technical standpoint, EURUSD recently hit a peak around 1.1766 after several attempts, and a CHOCH (Change of Character) reversal pattern may be forming. If the pair fails to reclaim the 1.1766 zone, a deeper downside scenario is likely to unfold.
As for me, I’m currently favoring short setups, especially around supply zones or after failed retests. Discipline and solid risk management remain my top priorities.
How about you? What’s your take on this pair?

Gold dives toward 3,320 as Fed decision loomsHello everyone, what are your thoughts on gold prices?
Gold's decline is accelerating, dragging the precious metal down toward the 3,320 USD mark. A stronger U.S. dollar and further developments on the trade front following the U.S.-EU agreement have significantly impacted demand for safe-haven assets.
From a technical perspective, the break below the rising price channel could mark the beginning of a deeper correction. Oscillators on the chart have just started turning negative, suggesting that the path of least resistance for gold is now downward.
Looking ahead, Wednesday’s key FOMC decision—along with the accompanying policy statement and Powell’s press conference—will be closely scrutinized for clues on the Fed’s interest rate cut roadmap.
Additionally, investors will face several important U.S. macroeconomic data releases this week, which will play a vital role in shaping the USD’s trajectory and provide new momentum for XAUUSD.
What do you think about the precious metal? Share your thoughts below!

EUR/USD Under Pressure : Sell or Buy ? The EUR/USD pair remains under mild bearish pressure, hovering around the 1.1700 mark and extending its Thursday downtrend. Meanwhile, the US Dollar (USD) stays firm despite growing optimism over improving US-China relations. However, the ongoing tension between Trump and Powell continues to capture market attention.
In response to these developments, EUR/USD has stalled its previous rally. On the chart, the pair is forming a series of lower highs, moving within a narrowing wedge pattern. The 1.1600 level now emerges as the critical battleground between bulls and bears.
Do you think EUR/USD can successfully defend this support zone? Let us know your thoughts!

Latest Gold Price Update TodayIn the most recent trading session, global gold prices dropped over 31 USD per ounce, closing at 3,337 USD. This sharp decline follows a three-day rally and reflects profit-taking by investors and a shift in capital flow.
Newly released economic indicators show that the U.S. labor market remains strong, with jobless claims falling for the sixth consecutive week — the longest streak since 2022. This helped the U.S. dollar rebound slightly, putting pressure on gold, a non-yielding asset.
At the same time, investor sentiment has tilted toward riskier assets like equities, as trade talks between the U.S., EU, and Japan show positive progress. Stock markets in the U.S. and Europe surged, drawing capital away from gold.
Although expectations remain for a potential Fed rate cut in September, gold faces short-term headwinds. The 3,300 USD zone is now a key level to watch. Traders should look for reversal signals and volume confirmation before considering long entries.
Personal view: USD strength, rising stock markets, and profit-taking are creating a short-term correction for gold. However, in the longer term, there is still upside potential if the Fed signals a policy shift in the coming months.
And you — what’s your take on gold prices today?

EURUSD: Bearish Breakdown in SightEURUSD is currently holding above the 1.173 support zone, but the bearish structure is becoming more evident. The downward trendline and nearby resistance have repeatedly rejected price rebounds.
If the support at 1.173 breaks, a sharp move toward the 1.168 target is likely — a key previous low.
Trend: Prefer SELL if a breakdown confirms – low risk, high potential.

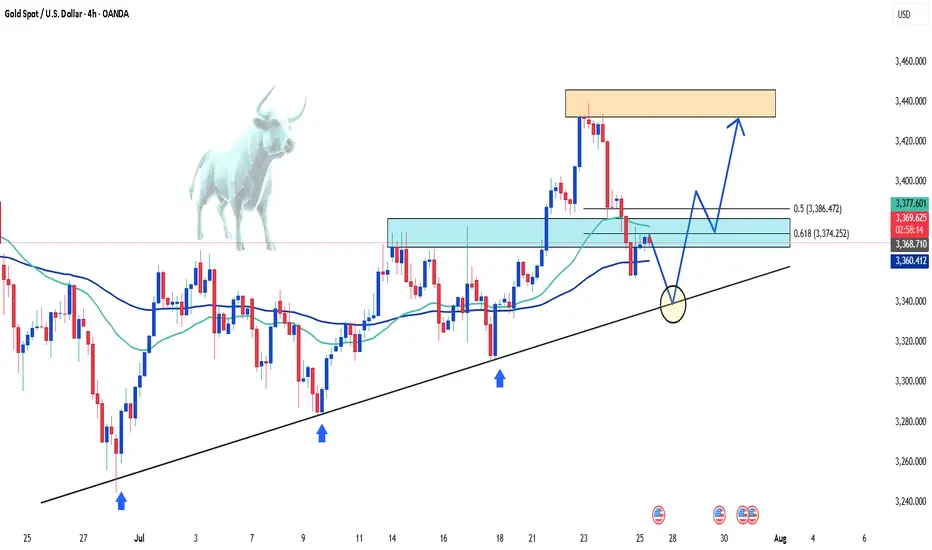
Gold holds steady—Is a breakout above $3,400 next?Gold prices have corrected exactly as we anticipated yesterday. At the time of writing, gold is hovering around $3,370 USD, showing little volatility since the start of the session.
Although the market is undergoing a short-term pullback, I still believe gold remains in a medium- to long-term uptrend. One key reason is the global shift away from the US dollar, with many countries increasing their gold reserves. Meanwhile, the USD is projected to weaken further in the long run. On top of that, if the Federal Reserve indeed begins to ease monetary policy, gold could break above the $3,400 level and potentially set a new record.
In addition, trendline support remains intact—if momentum picks up from here, the bullish trend may soon resume.
Gold takes a break – what's next?After Tuesday’s strong breakout, XAUUSD is now consolidating just as we expected yesterday. The price is hovering around 3,385 USD and is forming a head and shoulders pattern.
Technically speaking: If gold continues to hold the 3,350 USD support zone and the trendline, the bullish outlook remains intact. At this stage, gold is simply "taking a break" before its next move.
I'm still optimistic about gold’s potential — how about you?

Gold Breaks $3,400 – Bullish Momentum BuildsGold is gaining strong upside momentum, breaking above the $3,400 mark to hit a fresh five-week high.
This sharp rally in the precious metal comes alongside a renewed pullback in the US dollar. Declining Treasury yields across the curve and ongoing trade tensions are also fueling gold’s recovery as a safe-haven asset.
Currently trading around $3,426, gold may see a slight pullback to consolidate before resuming its bullish run.
What’s your take on gold today?

EUR/USD breaks key trendline – Is a bearish reversal underway?At the start of the week, the EUR/USD pair has officially broken its months-long upward trendline, signaling a potential short-term bearish reversal.
As of now, EUR/USD is trading around 1.169, performing a retest of the broken trendline. If the pair closes below this key level, it may confirm the breakout and open the door for a deeper decline.
Do you agree with my view?

Gold surges with explosive breakoutGold prices launched into a powerful rally yesterday, soaring from $3,350 to nearly $3,400 — a stunning $50 move, equivalent to 500 pips.
This surge was supported by a weakening US Dollar and a drop in the 10-year Treasury yield, which fell to its lowest level in over a week. On the macro front, if the Federal Reserve signals an earlier-than-expected rate cut, the bullish momentum could extend further in the long term.
Technical outlook: The H2 chart reveals a strong breakout after gold successfully breached the $3,372 resistance zone ( as highlighted in yesterday’s strategy ). Price is now completing a pullback, which may serve as the base for the next bullish wave.
Do you agree with this view? Share your thoughts and let’s discuss together.
Good luck with your trades! ✨

Gold Price Soars Today Amidst USD WeaknessGold prices surged unexpectedly today, surpassing the 3,350 USD/ounce mark, thanks to the weakening of the USD and falling U.S. Treasury yields. Concerns over U.S. President Donald Trump's unpredictable trade policies have also fueled demand for the precious metal as a safe haven.
Despite gold dipping several times near the 3,300 USD/ounce level in recent days, the support from bargain hunters and the continued demand for gold as a safe investment has helped maintain its high price. If this upward momentum continues, gold may soon break through the next resistance level, with 3,372 USD being the immediate target.

Gold Prices Rise Amidst USD WeaknessAmong precious metals, prices are increasing due to the weakening of the USD. There are no negative scenarios for gold in the medium term, considering the current developments: US government spending is out of control, ongoing trade tensions, uncertain inflation, and increasing criticism aimed at the Fed.
As of the time of writing, gold has risen by 0.3% in the past 24 hours, equivalent to an increase of 100 pips, currently trading at 3,350 USD.
The current environment is highly favorable for gold, especially as investors lose confidence in the stability of US monetary policy. If the Fed begins to concede to political pressure, gold prices could break previous highs and head toward 3,440 USD/ounce in the short term.
Do you agree with this view?

EUR/USD: Continuing Downtrend and Key Levels to WatchHello traders, what are your thoughts on EUR/USD?
Today, EUR/USD continues its strong downtrend, currently trading around 1.161. One of the key factors driving this decline is the strong recovery of the USD. Following the release of positive data from the US, especially the unemployment report, the market has reinforced expectations that the Fed will maintain high interest rates for a longer period. This has reduced the appeal of the euro, putting significant pressure on EUR/USD.
From a technical perspective, the price is approaching the trendline's lower limit, and a breakout at this point could push EUR/USD further down. Personally, I expect the EMA 89 area to be an ideal target for this strategy.
What about you, do you agree with my outlook? Feel free to share your thoughts, and let’s discuss!

Gold's Short-Term DeclineHello everyone, what do you think about gold?
Today, gold continues its short-term downtrend. After new data was released at the end of yesterday’s trading session, the USD rose by 0.3%, and U.S. Treasury yields also increased, reducing the appeal of gold. Additionally, the latest unemployment claims data shows improvement in the U.S. economy, which has contributed to the drop in the precious metal.
As of writing, gold is trading around the EMA 34, 89 levels at 3,336 USD. With the recent news, the market is expected to maintain its current stance throughout the day, as no new significant updates are expected.
From a technical standpoint, the downtrend remains in place, with prices continuing to be capped below the trendline. The series of lower highs and lows could likely lead XAUUSD to test lower levels, with the possibility of reaching the 3,300 USD mark.
What do you think about the price of gold today? Let us know in the comments!
