ECOSMOBLTY: Potential Reversal SignalsThe daily chart of ECOSMOBLTY indicates early signs of a possible bullish reversal following a prolonged bearish trend. Recent price action suggests renewed buying interest, supported by multiple technical factors.
The stock has rebounded from a long-term support level near ₹191 , accompanied by higher-than-average trading volume. This combination often signals increased market participation and potential trend reversal.
A bullish crossover on the MACD has been observed on the daily timeframe. This momentum-based indicator often suggests a shift from bearish to bullish sentiment when confirmed by price and volume.
The RSI has moved above 62, indicating strengthening bullish momentum. While not yet in overbought territory, this level reflects improving trend strength.
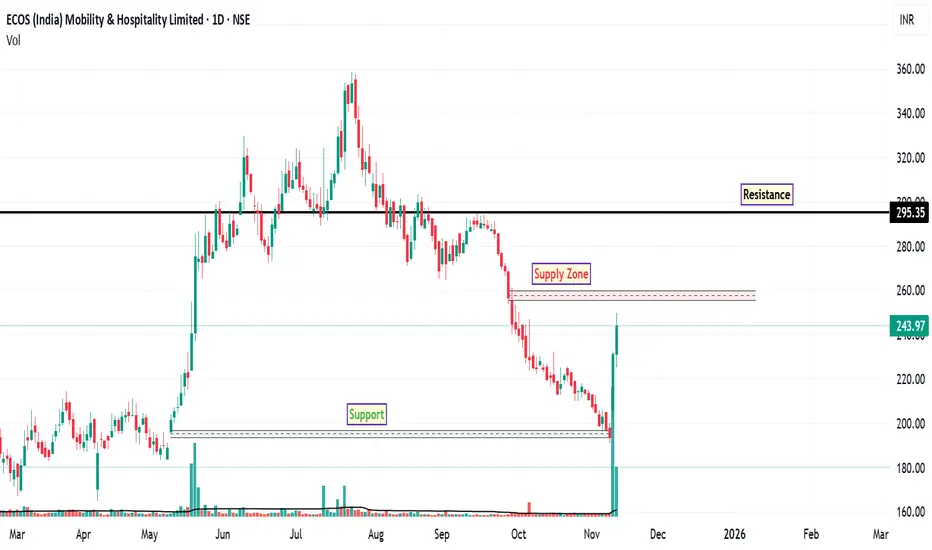
There is a notable supply zone around ₹257 , which may act as an interim resistance. Price could consolidate or retrace near this level before attempting further upward movement.
Immediate Resistance: ₹257 (potential supply zone)
Major Resistance: ₹295 (historical level based on prior price action)
Support Zone: ₹191 (long-term support and invalidation level for bullish setup)
Disclaimer: This analysis is intended for educational and informational purposes only. It does not constitute investment advice or a recommendation to buy, sell, or hold any financial instrument. Market participants should conduct independent research and consult with a licensed financial advisor before making any investment decisions.
ECOSMOBLTY
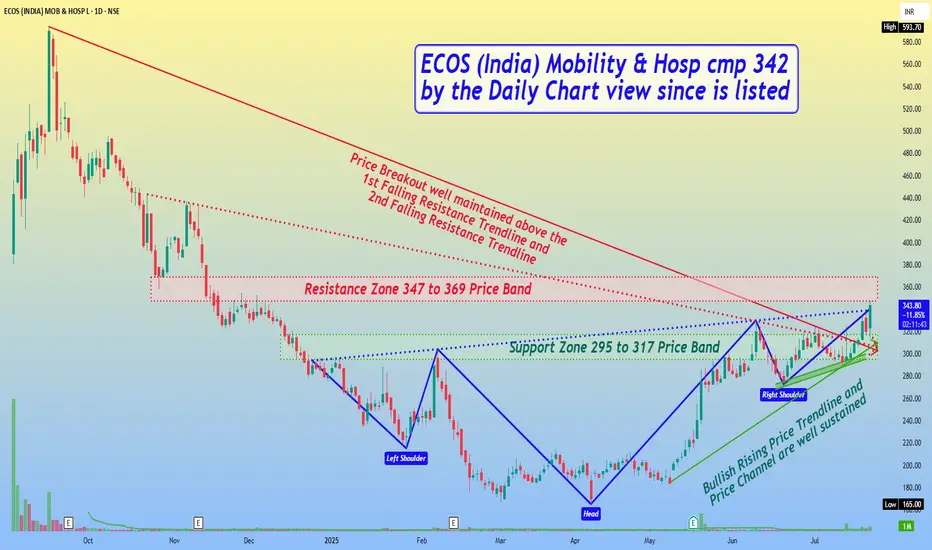
ECOS (India) Mobility & Hosp cmp 342 by Daily Chart since listedECOS (India) Mobility & Hosp cmp 342 by the Daily Chart view since is listed
- Support Zone 295 to 317 Price Band
- Resistance Zone 347 to 369 Price Band
- Bullish Rising Price Trendline and Price Channel are well sustained
- Above may also be interpreted as a Bullish "W" Double Bottom pattern
- *Rising Bullish Head & Shoulders pattern completed at Resistance Zone Neckline
- Volumes are intermittently spiking heavily indicative of demand based buying on the stock counter
- Price Breakout well maintained above the 1st Falling Resistance Trendline and 2nd Falling Resistance Trendline
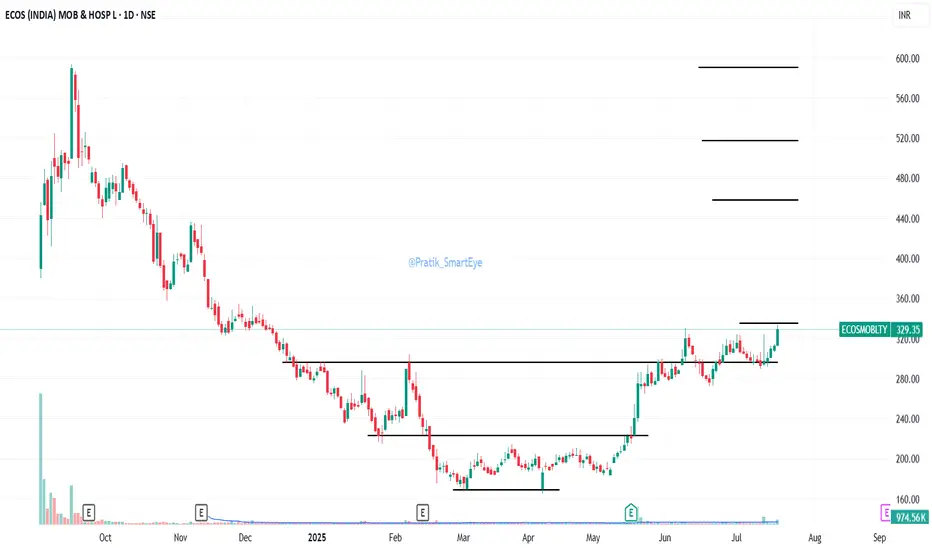
ECOSMOBLTY: IPO Stock Base BreakoutECOSMOBLTY: IPO Stock Base Breakout with volumes. CMP 329.
Resistance at 335/458/517/590
Support at 300