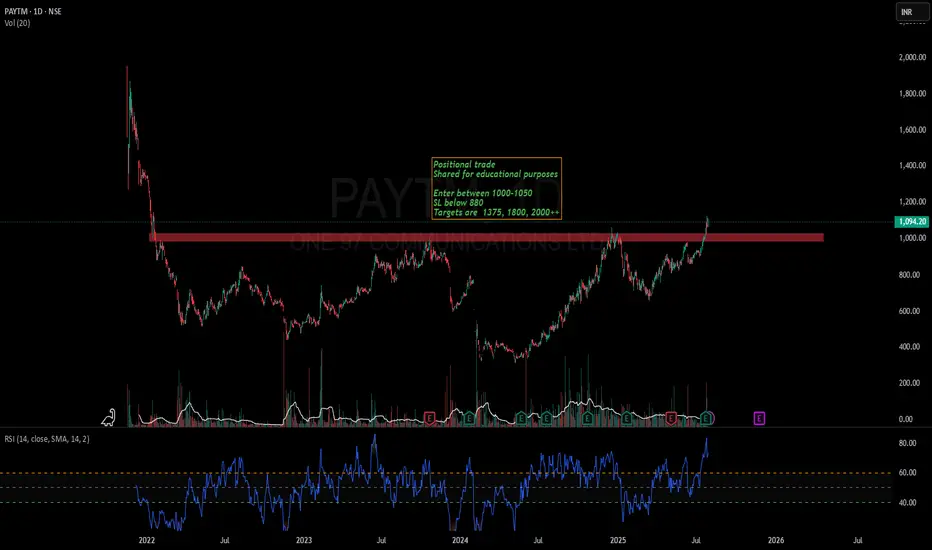
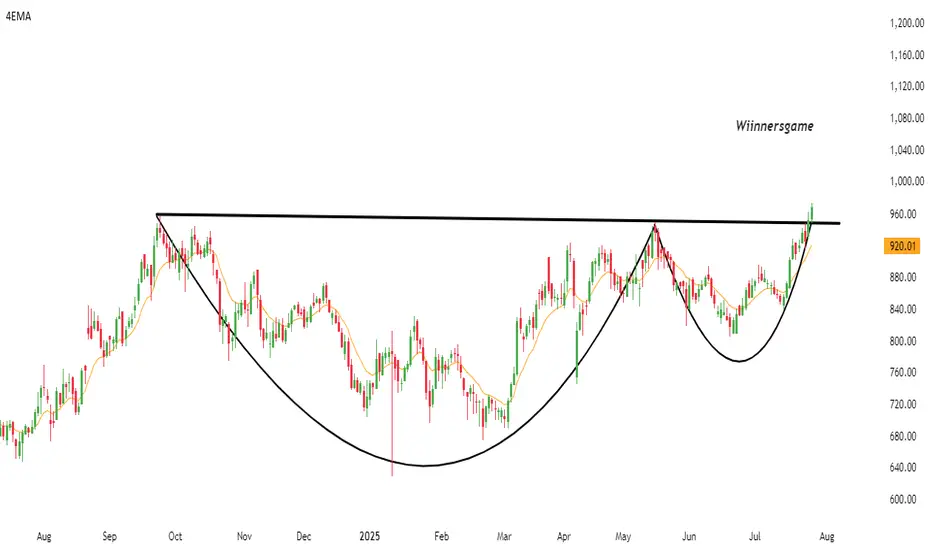
Paytm-A new ATH is coming soonPaytm has finally closed above its long term resistance of 1000.
Stock has potential to cross 2000 in near future
Keep stock in watchlist
Stock has also formed a kind of inverted head and shoulder pattern.
Not a recommendation. Watch and learn.
Community ideas
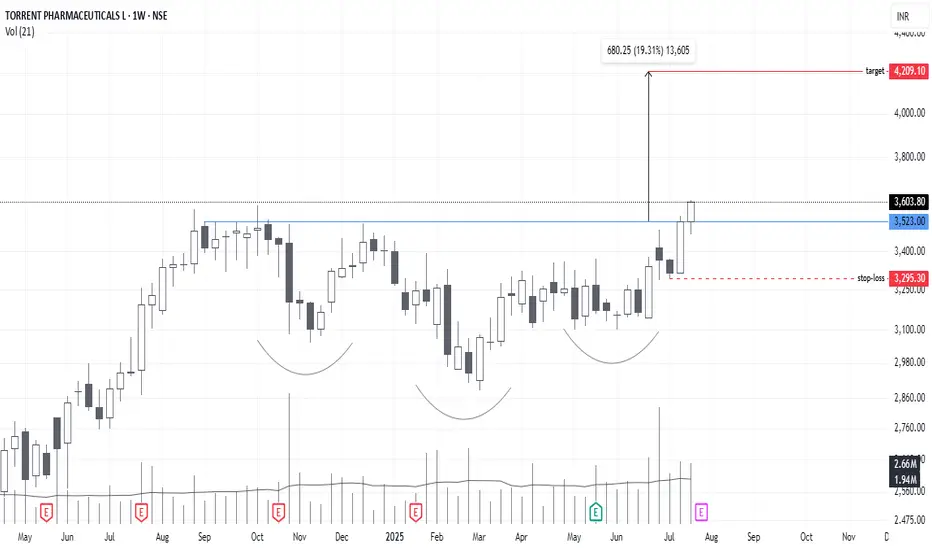
TORNTPHARM : Consolidation BreakoutStock is showing consolidation Breakout on ATH level, which is good for stock. Depends on its upcoming results the rally will be continue. Showing Head and Shoulder Breakout
All data is available in public domain..
CMP : 3600
TG : 4200
SL : 3290
Stock's selection based on 5 Point Analysis:
1: Idea : Breakout.
2: Support : Volume, Delivery .
3: Technical : 21/55/200-EMA, Super trend up, RS>0 RSI.
4: Fundamental : PE, PAT, Industry & peer PE and sector performance.
5: Timing : Entry Timing on Daily chart.
Disclaimer : It is my personal view as a trader and for educational purpose only. Equity market involves risk .
Please consult your financial adviser before taking any decision.
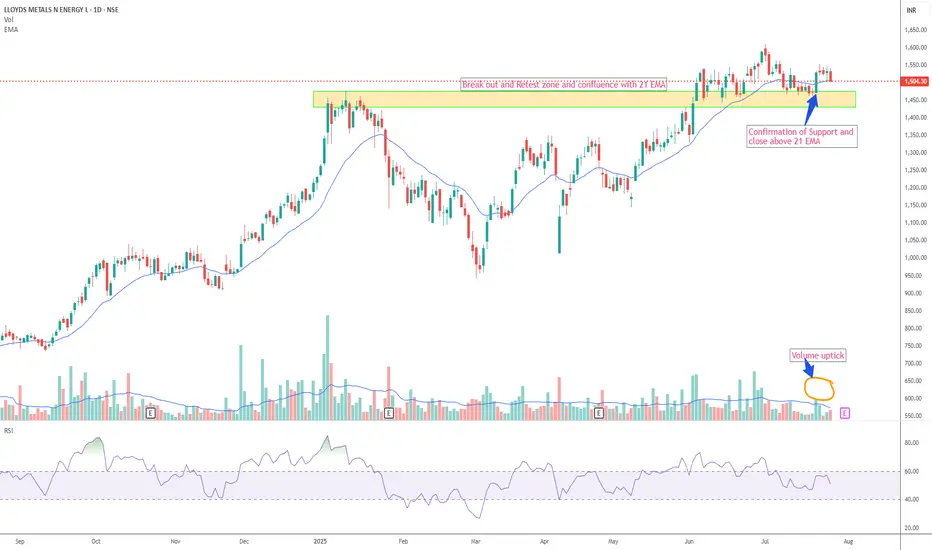
LLOYDSME – Breakout Retest with 21 EMA ConfluenceAs part of my personal trading strategy, I am closely watching LLOYDSME, which is currently retesting a recent breakout zone and hovering near a key support level. This area also coincides with the 21 EMA on the daily chart, adding to the technical confluence.
I am considering a long position if the price action confirms support at this level, in line with my predefined risk management rules. From my perspective, the current chart structure offers a potentially favorable risk-reward setup, with scope for upward movement if the retest holds.
Disclaimer
This analysis reflects my personal views and is shared for educational and informational purposes only. It does not constitute investment advice or a recommendation. I am not a SEBI-registered investment advisor. Please consult a qualified financial advisor and do your own due diligence before making any investment decisions.
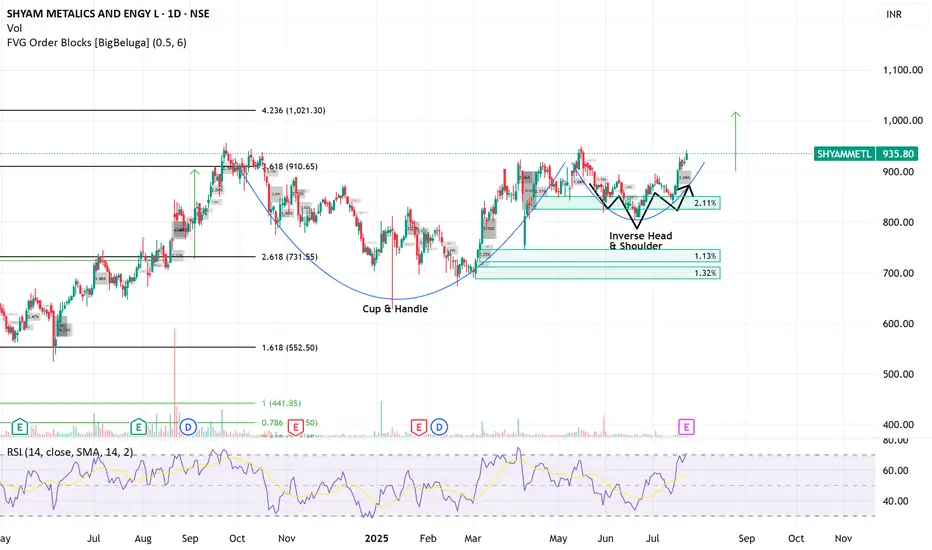
SHYAM METALLICS - PERFECT BULLISH TRADESHYAM METALICS, 970, (D) Stock has given CUP&HANDLE breakout on daily timeframe.
Good potential to test 1020/1075/1140 and 1200 if breakout gets sustained. Trade invalid if falls below 920 levels on 2 days closing basis.
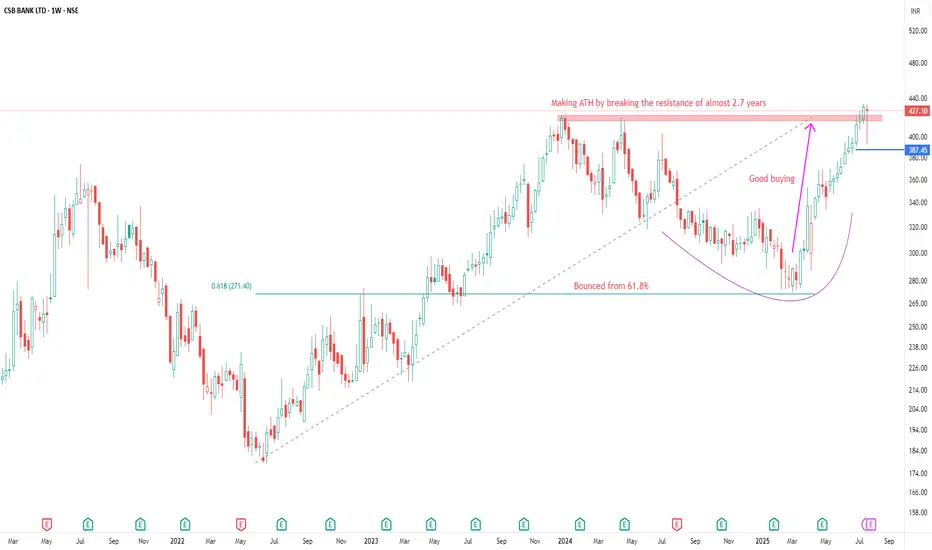
CSB BANK LTD ANALYSISFOR LEARNING PURPOSE
CSB BANK LTD - The current price of CSB BANK LTD is 427.10 rupees
I am going to buy this stock because of the reasons as follows-
1. Its coming out from a good consolidation base
2. It broke a strong resistance zone and it's making a new ATH and retested that level last week.
3. It is showing better relative strength as it stood strong in volatile times including last week.
4. The risk and reward is favourable. The good part- The stock is not extended.
5. The stock belongs to a sector which is quite strong i.e, Private Banks. The sector is in the consolidation after making new highs
6. The stock has done almost nothing in last 6 years i.e, it got listed in 2019 so it's more a laggard which is trying hard to do something now.
I am expecting more from this in coming weeks
I will buy it with minimum target of 35-40% and then will trail after that.
My SL is at 387.45 rupees
I will be managing my risk.
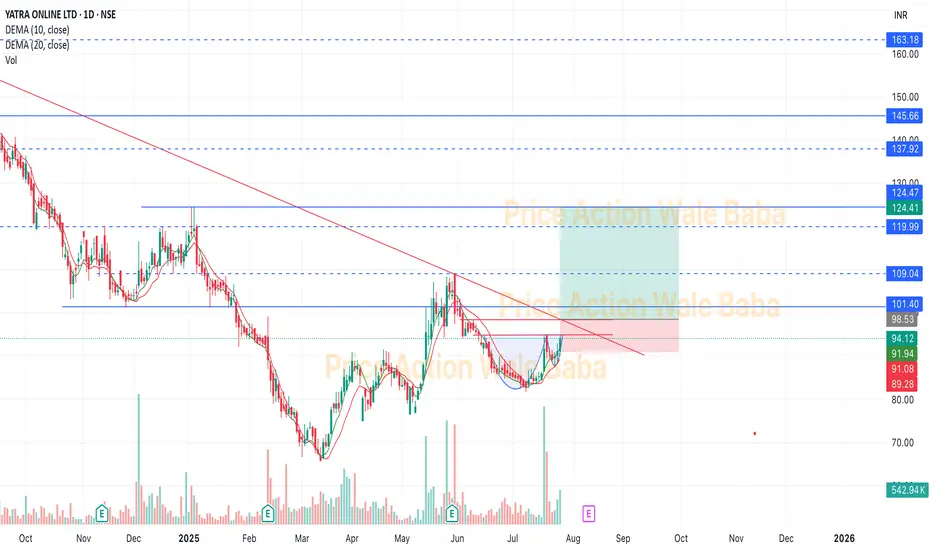
Yatra Online LtdYatra Online Ltd
a) YOL deals in the entire value chain of travel and hospitality, covering B2C and B2B segments.
b) It is the largest Corporate travel services provider, and one of the largest OTAs with ~80,000 domestic hotels and homestays contracted in ~1497 cities.
c) It provides a Real-time and Integrated SaaS Tech Platform which is accessible through the desktop & Mobile apps.
d) The company has a customer base of over 1,300 large corporates with addressable employee base of 9+ million employees.
Service:
The company is one of India’s leading online travel platforms, offering comprehensive corporate travel services to over 850 corporate clients. It facilitates bookings for domestic and international flights, hotels, holiday packages, buses, trains, cabs, homestays, cruises, and local activities. With a network of approximately 108,000 hotels and homestays across 1,500 Indian cities and access to around 2 million hotels globally, it stands as the largest domestic hotel platform in India.
Market Cap: ₹ 1,477 Cr.
Promoter holding: 64.5 %
FII holding: 2.82 %
DII holding: 19.1 %
Public holding: 13.6 %
Debt: ₹ 78.4 Cr.
Debt 3Years back: ₹ 62.8 Cr.
Looks good to buy on every deep, once breakout come it will give good movement.
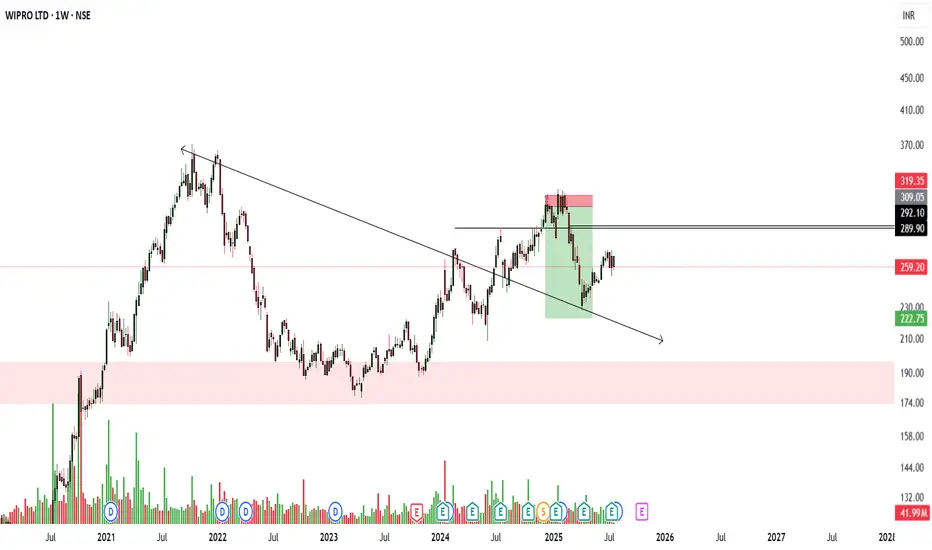
Will Wipro Bounce Back !?💸 Dividend Insight:
Wipro has announced an upcoming dividend, which may bring short-term interest. However, buying just for dividends during a downtrend can be risky.
📊 Technical Summary:
Resistance: ₹290–₹319
Support: ₹222, major at ₹190
Dividend: Watch out for announcement dates & record day
🔔 Pro Tip: Wait for price action near key zones before entering. Don't chase just for dividends if the structure is weak.
💬 Tell us below – are you eyeing Wipro for the dividend or waiting for a better entry?
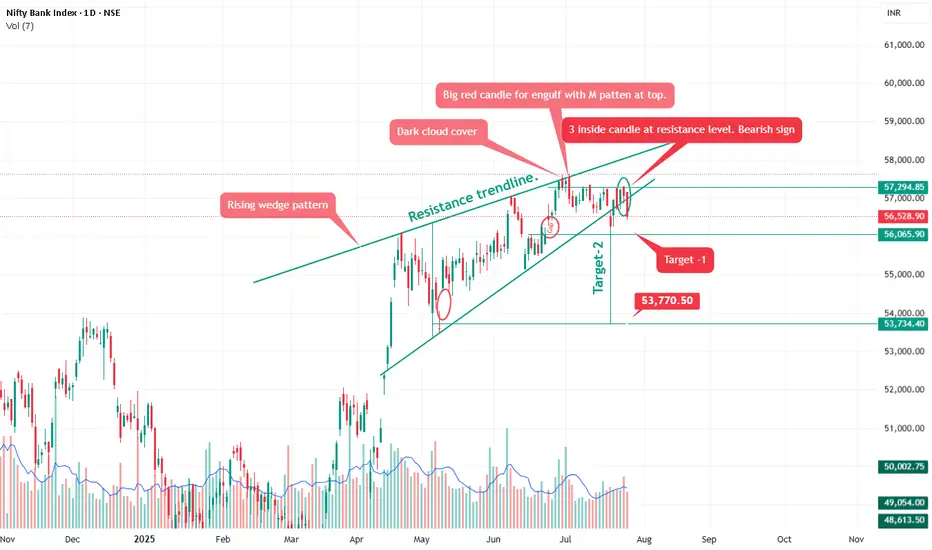
Bank nifty Rising wedge pattern.Pattern Analysis
Rising Wedge Pattern:
A bearish pattern typically seen near tops. It shows narrowing price movement with higher highs but declining momentum.
Breakdown confirmed as price has fallen below the lower wedge support trendline.
Confirms selling pressure and rejection from the top near 57,300–57,500 zone.
🕯️ Candlestick Signals
Dark Cloud Cover:
A bearish reversal pattern indicating sellers have taken control after a bullish phase.
Big Red Candle + ‘M’ Pattern:
Bearish engulfing at resistance – strong indication of a top formation.
3 Inside Down Candlestick Pattern at Resistance:
Recent red candles have higher volume, confirming institutional selling activity.
As anticipated in our previous analysis, Bank Nifty corrected from the 57,000 level to 56,056, validating the bearish setup.
It is also expected to short here 56,550 add on any rise up to 57,700-57,950 for target mentioned on chart.
Alternative Scenario: Be aware that the rising wedge could potentially break upwards. If the price breaks decisively above the resistance trendline with strong volume, the bearish outlook would be invalidated.
Commit to the Shift next week - focuse on becoming consistent
For the next week, we’re focusing on two powerful tasks that will move you closer to becoming a consistently profitable trader:
✅ Task 1: Deep self-reflection. Understand your strengths, demons, and bad habits—the things holding you back from consistency. Identify your triggers and write them down. Awareness is the first step to control.
✅ Task 2: Pure execution. When you know your edge, the next step is flawless execution. Commit to taking 30 trades, track every single one, and review them with complete honesty.
This challenge may not sound flashy—there’s no fancy technical talk here—but it’s a game changer. If you take it seriously, this one week can push you seven steps ahead in your journey and set you on the path to join the top 5% of traders.
Take the challenge. Do the work. Your future self will thank you.

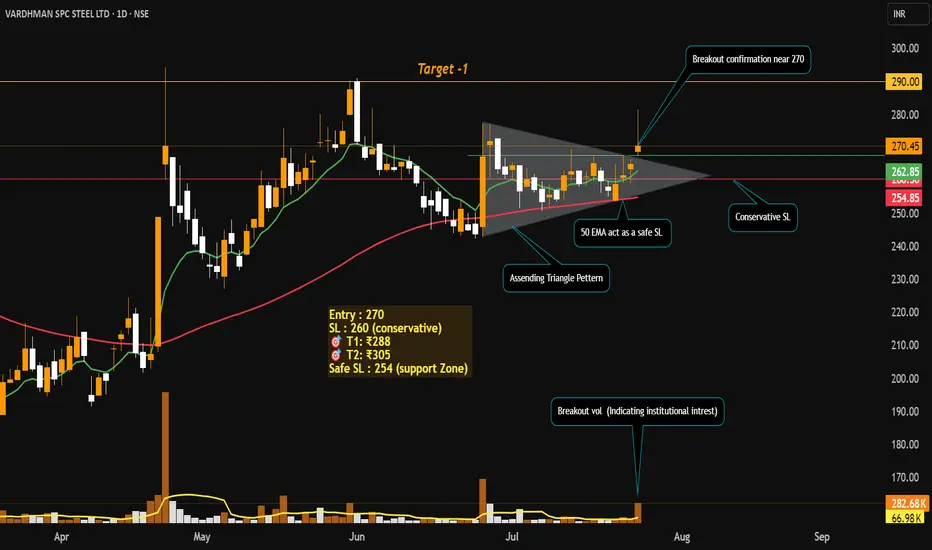
Swing Trade Idea: Vardhman Special Steels Ltd (NSE: VSSL)Technical Setup
Ascending Triangle Breakout on Daily Timeframe
Volume Spike 4x average volume on breakout day — strong institutional confirmation.
both the EMAs Bullish crossover (Price trading above both the EMAs).
RSI showing bullish momentum (60-65).
Price Action Strategy
Price broke out from resistance zone with strong bullish candle and closed near the high.
Previous resistance of ₹270 now acts as support.
Fundamentals
Promoter Holding: High, backed by Aichi Steel (Toyota Group).
Debt/Equity: Low (~0.12) → Strong solvency.
Strong financials: ROE / ROCE ~12.4% / ~17.8%
Revenue Growth: Consistent YoY
Valuation: Reasonable P/E (~18–20x)
My View: Entered at breakout with strong confirmation. Trail SL and book profits step-by-step. Holding for higher targets as long as price respects 9 EMA.
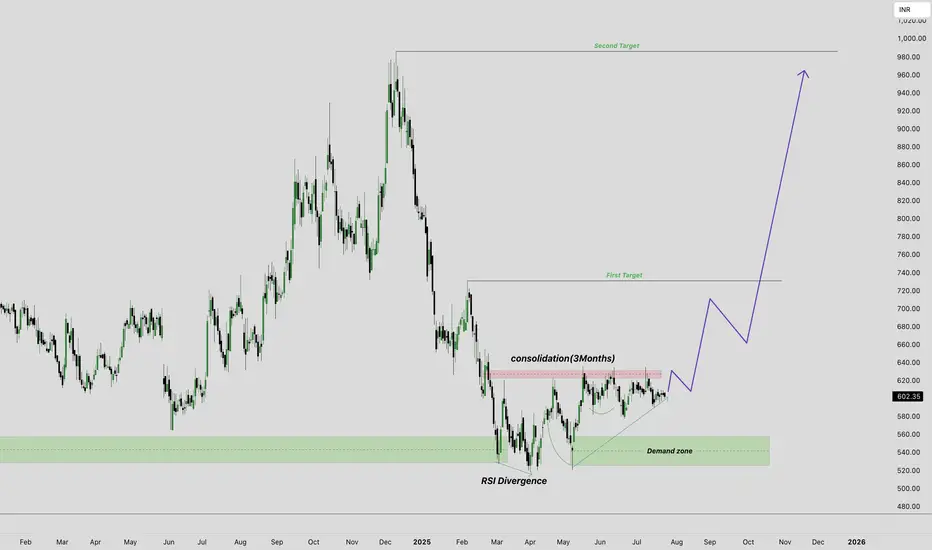
Monte Carlo Near break outMonte Carlo is consolidating between 550 to 640 price range. recent few weeks this range has become narrow, or forming VCP like structure. Which good sign for long term and swing investor.
If Monte Carlo fail to sustain this breakout at level of 640. it can test nearest demand zone which is near 550 level.
Key level entry and stop loss:
1. 640 breakout level. this level is good area for breakout and vcp trader with SL 580 or 570
2. if price fail to sustain this breakout it can test 550 demand zone at this demand you can make entries with some convictions and with some confluence, put sl below this demand zone.
Please do your own research and check your own confluence before making any finacial decisions.
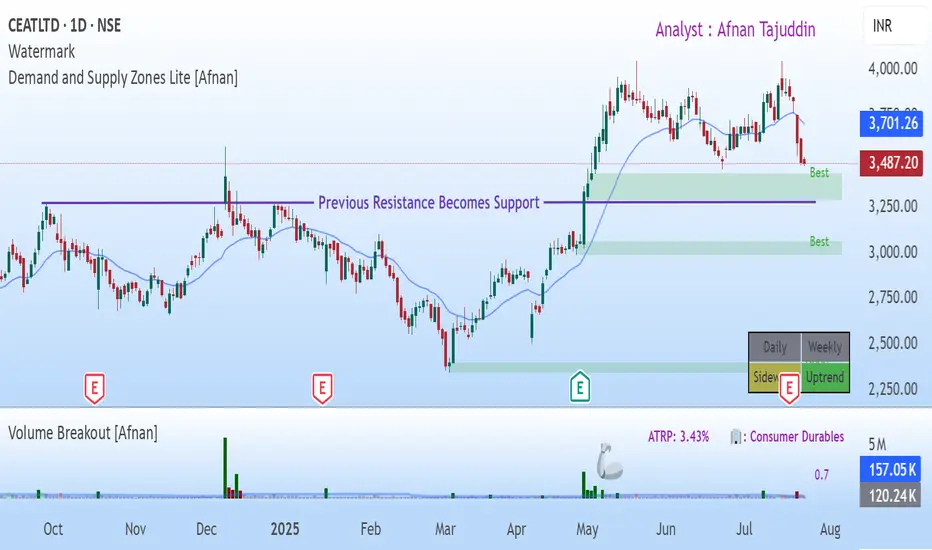
CEAT Ltd: Is a Rebound on the Horizon? A Confluence of TechnicalTraders — let’s dig into CEAT Ltd NSE:CEATLTD . where both demand-supply dynamics and classic technical signals are flashing something worth watching. What’s setting up here isn’t just noise — there’s real structure underneath the surface.
Demand Zone & Institutional Footprints
Let’s start with the core of this setup: the Demand Zone. CEAT’s price is inching toward a daily timeframe Rally-Base-Rally zone — and not just any zone, but one that stands out in terms of quality.
Why does this matter? Because these aren’t retail-driven bounces. These are often the hidden footprints of institutions quietly building positions.
On June 23rd, price came close to this very demand zone — and without even touching it, we saw a sharp bounce. That’s a strong tell. There’s clear demand waiting just below.
Institutions don’t throw their entire order book at the market in one go. They scale in. So when price comes back to this area, it’s likely to trigger those leftover buy orders — potentially leading to another move higher.
Zooming out to the broader view : Both weekly and monthly charts are still in an uptrend. There are no obvious supply zones on the higher timeframes That clears the runway for bullish continuation.
💡 Traditional Technical Analysis Perspective 💡
Now let’s switch gears for a moment and take a look through the lens of classic technical analysis. What’s the chart telling us in plain sight?
CEAT spent months coiling within a consolidation range — nothing impulsive, just sideways chop.
But that changed on April 30th with a decisive breakout. And this wasn’t on light volume — it came with strong participation, a real sign of conviction.
Post-breakout, we’ve seen consistent volume buildup alongside price progression. This isn’t a one-day wonder — it’s been developing.
Act of Polarity at Work: The breakout level had previously acted as firm resistance multiple times. Now that price is retesting it from above, it’s doing exactly what we expect — flipping that resistance into potential support.
Interestingly, this retracement is happening on declining volume. That’s key. It often suggests a healthy retest rather than a breakdown — a potential “buy the dip” scenario, if you will.
🤝 The Confluence: Where Two Worlds Meet 🤝
Here’s where things get really compelling — that demand zone we highlighted? It aligns perfectly with the same level that’s being retested post-breakout. That overlap — this confluence — is no coincidence.
It dramatically increases the odds of a strong bounce, because we’re getting validation from two independent analytical frameworks. When price, psychology, and institutional footprints all point to the same zone — you pay attention.
We could consider a tactical Stop Loss just below the demand zone. And in terms of upside? The previous swing high near ₹4000 stands out as a logical first target.
"Success in trading is a marathon, not a sprint. Consistency, discipline, and effective risk management are your true North Stars."
Stay sharp. Even the cleanest setup can fail — and that’s why managing risk isn’t optional. If price violates the zone and closes below your SL, step out without hesitation.
Thanks for reading — your support, feedback, and questions always help drive this community forward. Let’s keep sharpening our edge together.
🚀 Trade smart, stay disciplined, and let your journey be one of continuous learning! 🚀
Disclaimer: This analysis is intended purely for educational purposes. It does not constitute investment advice or a trading recommendation. I am not a SEBI-registered advisor.
Shyam Metalics! Multiple Indicators, Short term Idea. - Cup and Handle Formation
- Previous Inverse Head and Shoulder
- Target Last Fib Level since IPO
- Fundamentally Good Stock( ~75% Promoters, Debt Free, Increasing sales and Profit YoY etc)
- Levels are marked in the chart
This is not a buy/sell advice. Only for educational purposes.
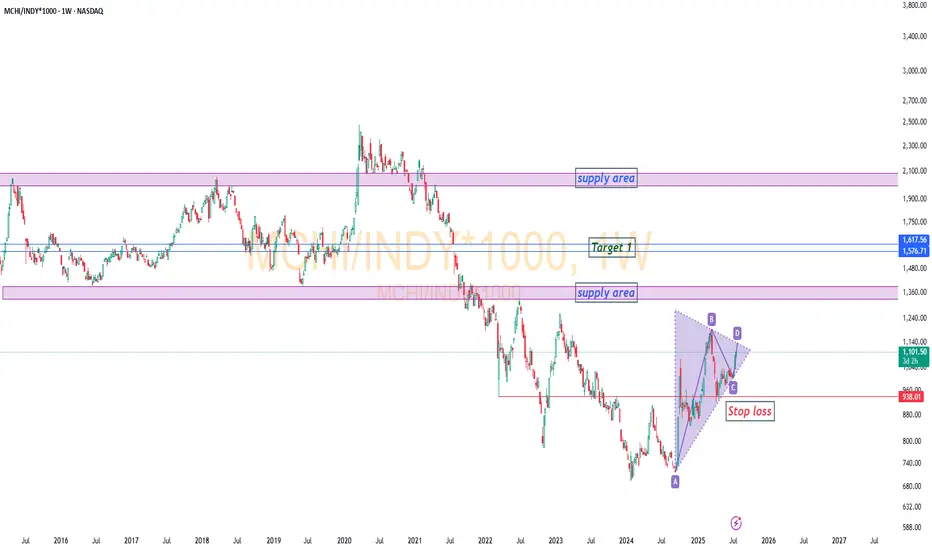
MCHI / IndyRelative Comparison Analysis: MCHI vs. INDY (CMP: 1084)
On the weekly chart, MCHI appears poised to outperform INDY if it sustains above the 1130–1230 zone. The 1330–1390 region may act as an initial supply zone.
Target 1: 1582–1617
(Estimated timeline: ~1 year or more)
Target 2 / Next Supply Zone: 2000–2080
A breakout above the supply zone (1330–1390) could materialize within the next 8 months if momentum builds.
Suggested Stop Loss: 940 (on a weekly closing basis)
This analysis is based on relative strength trends and supply-demand dynamics visible on the long-term chart.
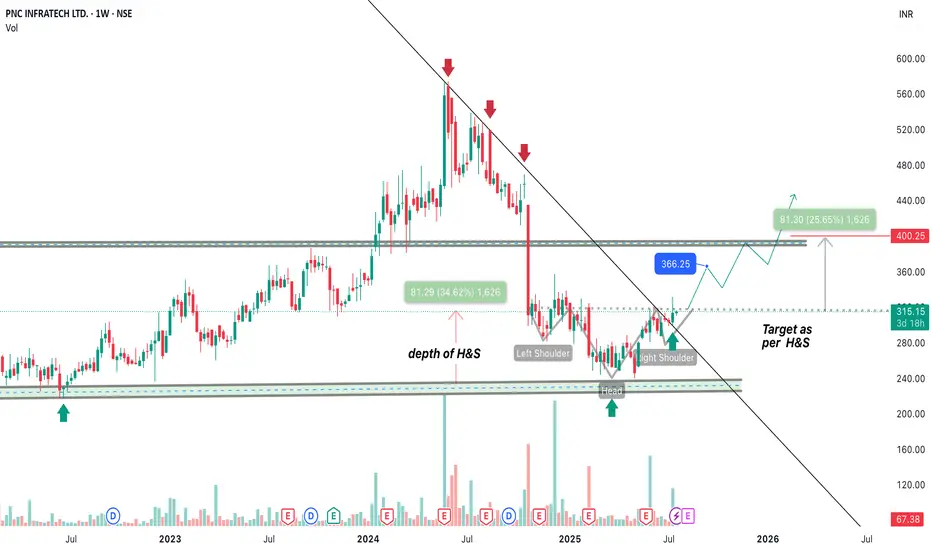
PNCINFRA INVERTED HEAD & SHOULDER - LONGThe stock has given a very good breakout of 1 year long TL. moreover it has formed INVERTED H&S pattern which gives us an upside target of 400.
moreover it has completed its long time fibonacci retracement of 61.8% which gives us another point of its future bullish momentum.
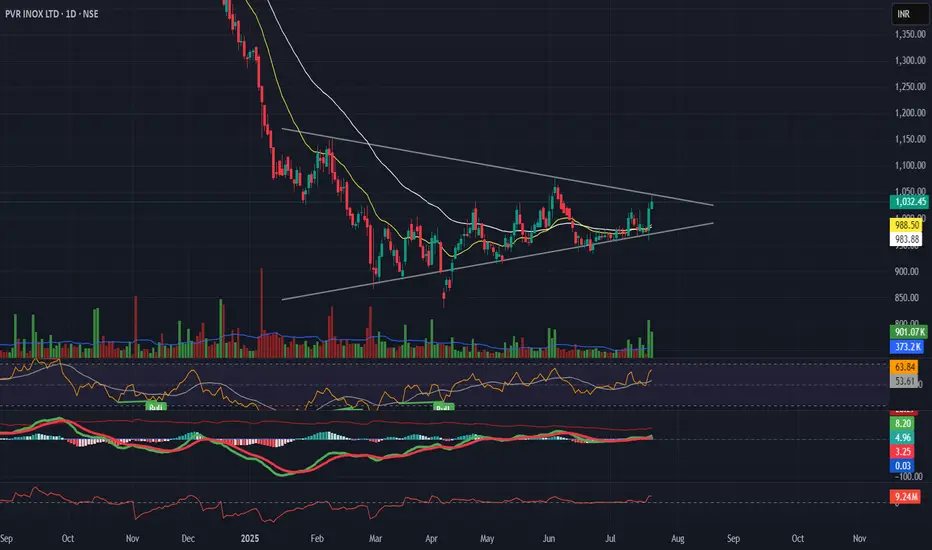
PVR INOX – Symmetrical Triangle Breakout | July 2025📊 PVR INOX – Symmetrical Triangle Breakout | July 2025
A potential breakout setup is forming on both the daily and weekly charts in PVR INOX:
🔹 Structure: Symmetrical triangle on both timeframes, showing price contraction near ₹1040
🔹 Momentum: RSI holding above 50, MACD turning positive
🔹 Volume Spike: Breakout supported by increasing volume
🔹 Sector Rotation: Media & Entertainment sector showing improving relative strength
🔹 Macro Narrative: Theme of rising screen expansion + easing inflation supports business growth
---
📌 Strategy Overview:
• Entry on breakout above ₹1040
• Target 1: ₹1080
• Target 2: ₹1126
• Stop-loss: ₹955 (below pattern support)
Timeframes Aligned:
Weekly: Structure intact with price near resistance
Daily: Ready for breakout
Hourly: Momentum building near apex
---
🧠 Conclusion:
A multi-timeframe setup with technical + narrative alignment. Watch for confirmation with strong candle + above-average volume.
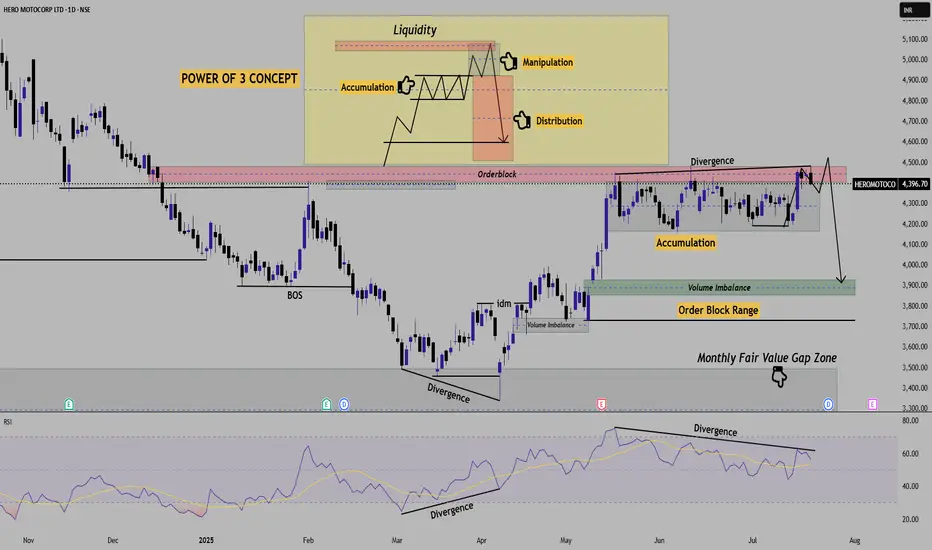
HERO MOTOCORP LTD. ----- Deep AnalysisHERO MOTOCORP Ltd.--- High Probability Reversal Setup based on (Power of 3) concept of ICT Strategies.
Timeframe - Daily
Current Price -- 4396
Projection -- High Probability Reversal Setup after Manipulation phase.
Price Action Overview ---
Stock is currently Respecting higher time frame Orderblock just after Accumulating Liquidity in its sideways Range.
Orderblock Zone -- 4390-4500
In retailers term, It is rejecting upside Resistance or Orderflow zone of 4380-4500 Levels.
Liquidity & POI Zone --
Immediate Liquidity is resting in orderblock zone of 4400-4500
Volume Imbalance ---
Downside Unmitigated Liquidity is resting in Volume Imbalance zone of 3800-3920 Levels.
RSI ---
1st Divergence observed at bottom From March to April period which showed bullishness and market moved upside.
2nd Divergence observed at Upside from 20 may to Mid july period which now shows bearishness and market likely downside.
Final Projection for 2-3 months View -----
Main Target (High Probability)
-- Price likely to grab Orderblock Liquidity (4390-4480) to manipulate retailers.
-- After rejection and Clear Market structure shift on lower time frame, Entry module will be confirmed.
-- From entry Module a Sell position expected towards downside Volume Imbalance zone as marked as Distribution.
-- Entry Module --- In the Orderblock zone price levels (4390-4480)
-- Target projection --- Volume Imbalance Zone (3850-3930)
-- Exit Area --- If stock continue going upside without giving any market sturcutre shift then avoid above 4600.
This setup is just reflecting the POWER OF 3 Concepts -- Accumulation >>>>>> Manipulation >>>>>> Distribution.
it means that first stock accumulates large liquidity and then gives a fakeout or false breakout before giving huge opposite move.
Traders or Investors views or comments are most welcome.
[Disclaimer --- This setup is made just for Educational purpose onlu. Dont consider it as any Investment Idea.
Consult Your Financial Advisor before any investment.)
Regards,
Hit_Analyst
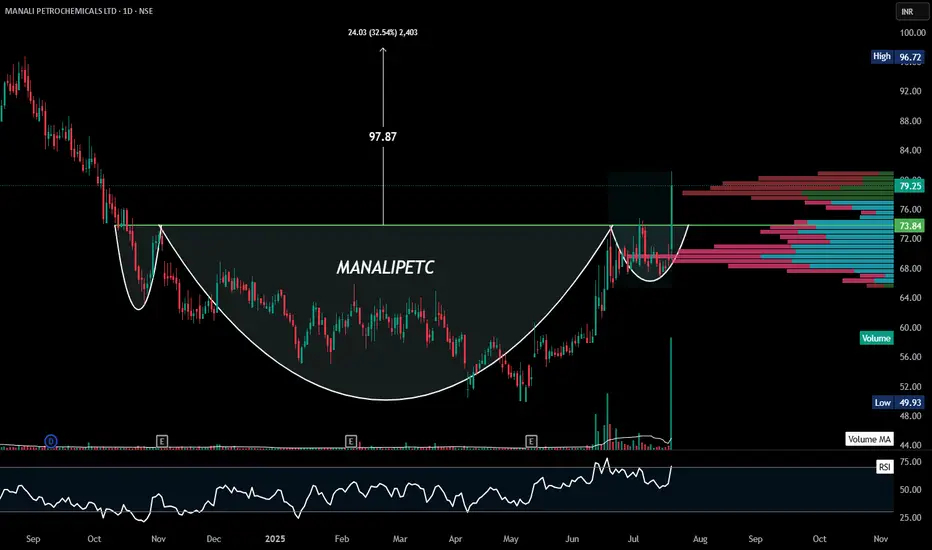
MANALIPETC | Cup & Handle | Breakout#MANALIPETC
🚨 Breakout Alert: NSE:MANALIPETC
Cup & Handle breakout above ₹73.8 with strong volume 📈
📌 Target: ₹97.8 (32% upside)
✅ Bullish structure wait for pullback
✅ Low debt, niche player
📊 RSI nearing 70 — early momentum phase
#StocksToWatch #TechnicalAnalysis #Breakout
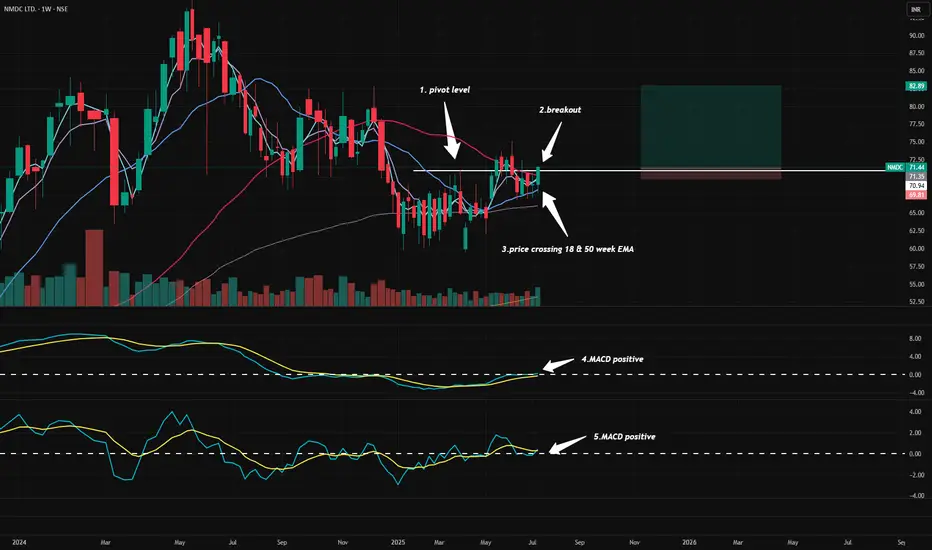
NMDC -long for 15%NMDC Ltd – Weekly Bullish Setup (as of July 19, 2025)
📌 Key Bullish Technical Points
1.Pivot Breakout
Price has closed decisively above the key pivot resistance level of ₹70.94, indicating breakout from consolidation.
2.EMA Confluence Break
The stock has successfully crossed above both 18-week and 50-week EMAs, confirming a short-to-medium term trend shift.
3.MACD Bullish Crossover (Standard)
The MACD (12,26,9) line has crossed above the signal line and moved into positive territory — a textbook bullish trigger.
4.MACD Bullish Crossover (Fast)
The faster MACD (3,6,9) is also positive and shows a clear crossover, reinforcing near-term bullish momentum.
5.Volume Confirmation
Breakout is accompanied by a surge in weekly volume, adding conviction and validating the breakout.
6.First Higher High Formation
This is the first higher high on a weekly basis in several months, suggesting a potential trend reversal and strength.
7.Favorable Risk–Reward Setup
Entry: ~₹71.44
Stop-loss: ~₹69.81 (below breakout + EMAs)
Target: ~₹82.89 (recent swing high)
Risk–Reward Ratio: >3:1
8.Weekly Momentum Turnaround
Positive crossovers and price structure on the weekly timeframe suggest a positional uptrend with swing potential.
✅ Summary
NMDC Ltd is showing a high-probability breakout above key resistance with confluence from EMAs, MACD, volume, and price structure. This makes it a strong candidate for a bullish positional trade toward ₹82.89.
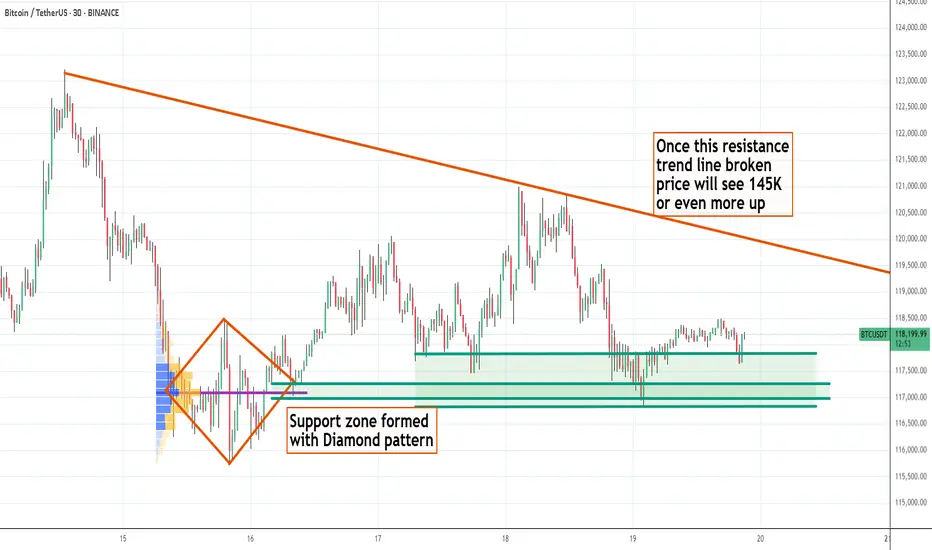
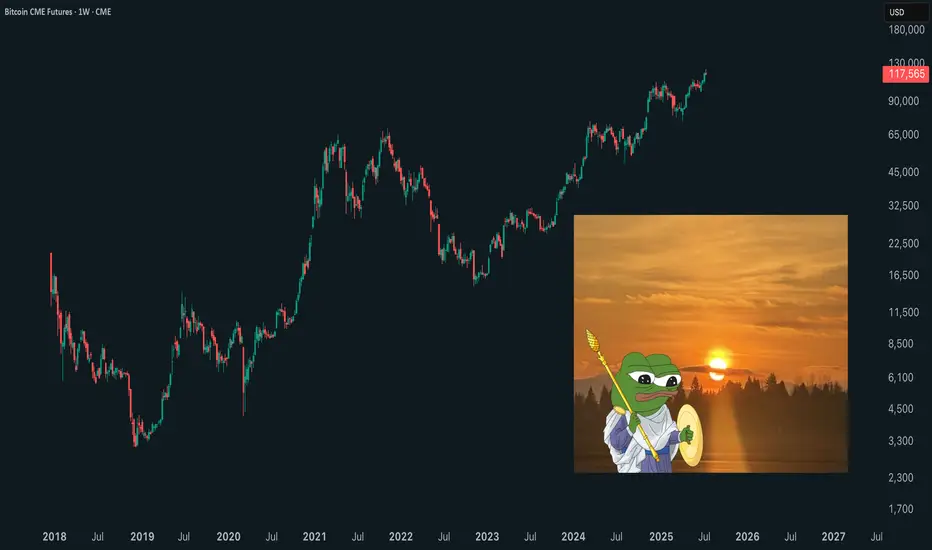
BTC - 19th July - Bullish with sideway correction - Target 145KBTC has been bullish with fundamental reasons - Fiat US $, US Govt Crypto Policy and non stop accumulation by Saylor and ETF, corporates etc ... every week and month new corporates adapting BTC After a good move price is now seeing side way correction and once the newly formed resistance line taken, I strongly expect BTC price to see 145 K easily
Survival First, Success LaterThere was once a stone that lay deep in the heart of a flowing river.
Every day, the water rushed past it, sometimes gently, sometimes with force. The stone wanted to stay strong, unmoved. It believed that by holding its ground, it could outlast the river.
For years, the stone resisted. It didn’t want to change. It believed that strength meant standing still, no matter how hard the current pulled.
But slowly, almost without noticing, the stone began to wear down. The river wasn’t trying to destroy it. The water wasn’t cruel. It was simply doing what rivers do - moving, shifting, carving its own path.
One day, the stone realised it wasn’t the same shape anymore. It was smoother now, smaller in places. It hadn’t won by resisting. It had survived by adapting. It had learned to let the river shape it without breaking it apart.
The stone couldn’t control the river. All it could do was endure without letting itself be shattered.
Trading is NOT so different.
The market moves like a river. It doesn’t care if you want it to go left or right. It doesn’t reward those who stand rigid against its flow. It rewards those who learn when to hold their ground, when to let go, and how to survive the constant pull of forces bigger than themselves.
This is NOT a story about rivers and stones. It’s a story about YOU.
About learning to endure without breaking. About understanding that survival comes not from fighting the current, but from learning how to live within it.
Much like the stone, every trader begins with the same illusion, that strength means control, that certainty can be conquered with enough knowledge or willpower.
But time in the markets teaches you otherwise. It shows you, again and again, that survival isn’t about resisting the flow. It’s about learning to move with it, to protect yourself from the inevitable storms without being broken by them.
And so, this is where the real story of trading begins.
Trading often appears simple from a distance. You buy, you sell, you make a profit, and then you repeat the process.
But anyone who has spent enough time in the markets will tell you the truth. This isn’t a game of certainty. This is a game of survival.
The market humbles you early. It doesn’t care how much you know, how brilliant you think you are, or how much confidence you bring. The market doesn’t reward ego; it breaks it down piece by piece.
Almost everyone starts with the same mindset. You want to win. You want to make money. You believe you can figure it out if you study hard enough, work smart enough, hustle more than the next person.
But eventually, reality steps in. You begin to understand this game isn’t about knowing where the price will go next. It’s about knowing where you will stop, where you will cut a loss, where you will step aside and wait.
The traders who survive are not the ones who chase perfection or seek to predict every move. They are the ones who learn how to lose properly - small losses, controlled losses. Losses that don’t bleed into something bigger, mentally or financially.
Most people can’t do that. They fight the market. They fight themselves. They refuse to accept small losses, believing they can somehow force a different outcome.
Those small losses eventually snowball. Blowups rarely come from one bad trade. They come from ignoring the small signs over and over again. The market isn’t cruel. It’s just indifferent. It’s your responsibility to protect yourself.
Good trading isn’t loud. It isn’t exciting. It isn’t full of adrenaline and big calls.
Good trading is quiet, repetitive, and frankly, a little boring. It’s built on discipline, not drama. Your job is to manage risk, protect your capital, and let time do its work.
There is no holy grail. There is only process. A process you can repeat with a clear head, day after day, year after year, without losing yourself in the noise.
Wins will come. Losses will come. Neither defines who you are. What defines you is how you respond.
⦿ Can you stay calm after a red day?
⦿ Can you follow your plan even after a mistake?
⦿ Can you sit on your hands when there’s nothing to do and trust the work you’ve already done?
Patience, in the end, is the real edge. Most won’t have it.
They’ll bounce between strategies, searching for certainty where none exists. They’ll burn out chasing shortcuts. They’ll forget that progress comes through small, steady steps taken over years, not through chasing big wins.
Trading is a mirror. It reflects your fear, your greed, your impatience. It shows you who you really are. Ignore what it reveals and you’ll keep paying for the same lesson until you finally learn it.
In the end, this game isn’t about the market. It’s about YOU.
⦿ Learn to protect yourself.
⦿ Learn to sit with boredom.
⦿ Learn to lose well.
⦿ Learn to wait without losing faith.
If you can do that, the market has a way of rewarding you in time.
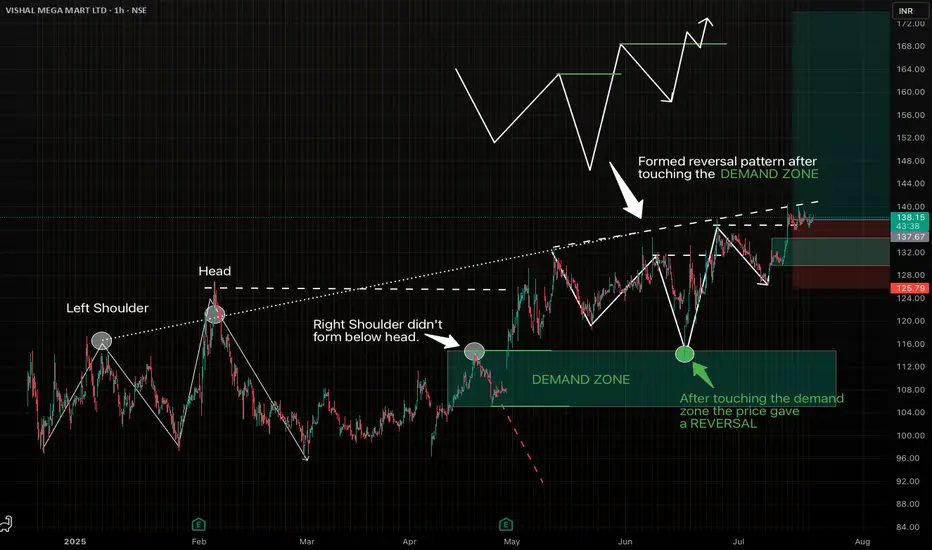
Strong reversal pattern on VMM. Looks good for swing trade.Spotted a beautiful setup on VISHAL MEGA MART LTD (1H Chart), following my favourite "Elevated Right Shoulder" pattern.
- The Left Shoulder and Head formed clearly.
- The Right Shoulder didn't go below the head, indicating ultra bullish structure and formed a demand zone.
- Price touched the Demand Zone and gave a perfect reversal.
-Clean entry with favourable risk-reward.
Let's see how it plays out.
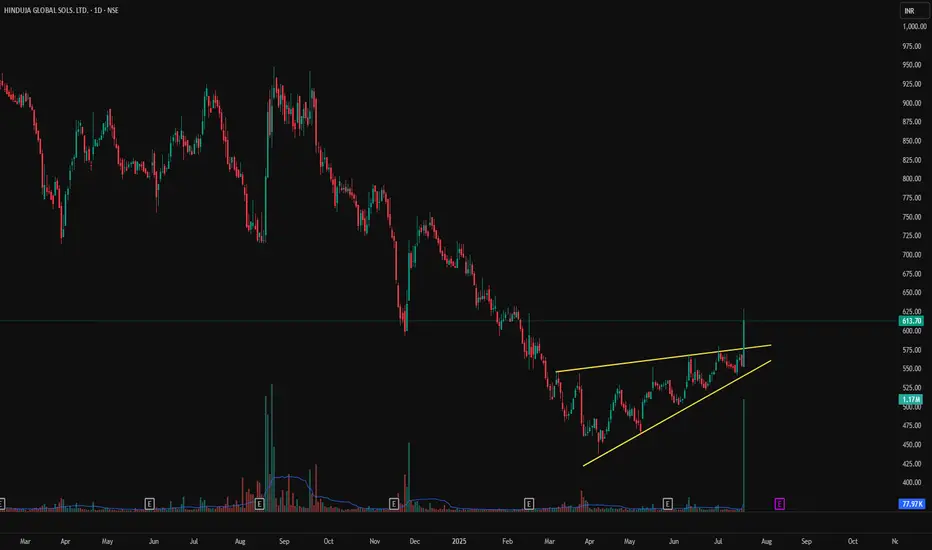
HGS - Rising Wedge Breakout on Volume Spike | Daily Chart📊 HGS – Rising Wedge Breakout on Volume Spike | RSI Above 70 | Fresh Bullish Momentum
📅 Chart Date: July 17, 2025
📍 CMP: ₹613.70 (+10.72%)
📈 Symbol: NSE:HGS | 1D Timeframe
🔍 Technical Analysis Breakdown
🔺 Rising Wedge Breakout
Price broke above the upper resistance of a rising wedge pattern.
Strong confirmation with a wide bullish candle and volume spike.
📊 Volume Surge
Volume: 1.17M against average volume of ~78K
Sudden institutional interest or news-based momentum likely behind the move.
📉 RSI (14, close): 73.03
RSI crossed into overbought territory, showing strong bullish momentum but could warrant caution or consolidation soon.
📌 Support & Resistance Levels
Breakout Zone: ₹580–₹590
Next Resistance: ₹650+ (gap-fill zone from earlier breakdown)
Support: ₹560 (upper trendline of broken wedge)
📌 Key Observations
First strong breakout since months of sideways to bullish accumulation.
Sustained close above ₹590–₹600 will confirm continuation.
Caution if price retraces inside wedge again.
🏁 Trade Setup
Entry: On Retest of ₹590–₹600
Target: ₹650 / ₹675
Stoploss: Below ₹560
Risk Level: Moderate (due to overbought RSI)
⚠️ Disclaimer: This is an educational chart setup and not trading advice. Please conduct your own research and risk management.
📣 Follow @PriceAction_Pulse for more such clean breakouts and chart pattern analysis!
🔁 Drop a comment if HGS is on your radar for the next breakout rally 📈