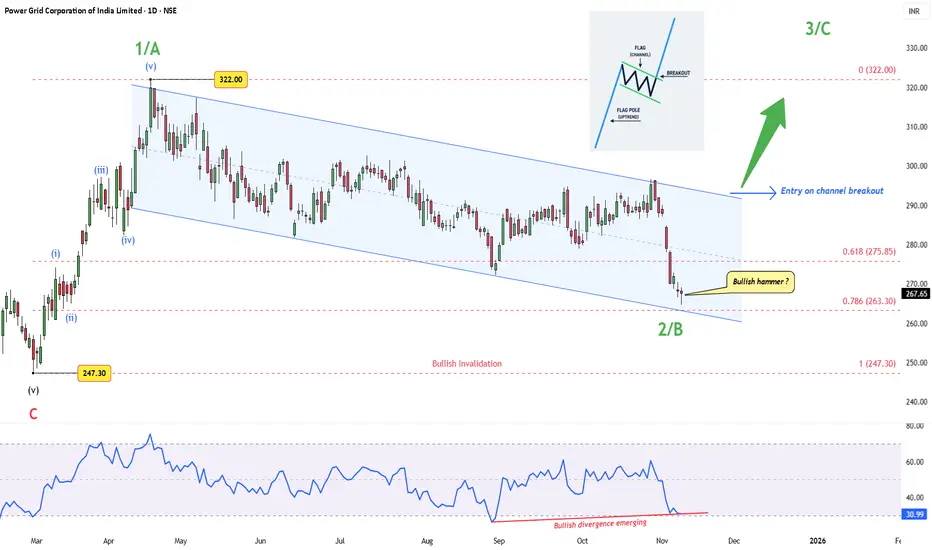
Power Grid – A Flag Within a WaveAfter completing a clean five-wave rally from ₹247.30 to ₹322, Power Grid has spent months in a controlled drift lower — a textbook corrective channel, likely forming Wave 2/B of the next major leg.
Price now sits near the 0.786 retracement (₹263 zone), showing early signs of exhaustion. A “ Bullish hammer? ” candle has appeared — not textbook-perfect, but hinting that buyers are starting to show up near prior demand.
The RSI divergence adds another layer — price made new lows, RSI didn’t. That’s often how momentum bottoms quietly form before a sharp reversal.
Still, price hasn’t kissed the lower boundary of the channel, which has already acted as support thrice. So, another quick dip can’t be ruled out before a stronger move unfolds.
A breakout above the upper channel would confirm the end of this correction and signal the start of Wave 3/C, with ₹322 as the first key level to reclaim.
Until then, patience is key — the structure remains healthy, the confluence is strong, and the risk is clearly defined.
Structure summary:
Wave 1/A : ₹247.30 → ₹322
Wave 2/B : Descending flag-type correction
Key fibs : 0.618 = ₹275.85, 0.786 = ₹263.30
RSI : Bullish divergence emerging
Trigger : Breakout above channel
Invalidation : Below ₹247
Disclaimer: This analysis is for educational purposes only and does not constitute investment advice. Please do your own research (DYOR) before making any trading decisions.
Community ideas
Breakout retesting apollo HospitalBest ever result
ATH breakout & re-testing
Price should start new rally.
Price should not break the strong support of 7500
This is only for educational purpose no any trade recommendation

SAIL : LongTrend: The stock is forming a cup and handle pattern, which is a bullish continuation setup. It has broken out above the neckline around 140 levels, showing strength. The trend has turned positive after a long consolidation phase.
Volume: There is a clear increase in volume during the breakout, which confirms buying interest. Higher volume on breakout weeks indicates that buyers are active and the move is supported by participation.
Momentum (MACD): The MACD line has crossed above the signal line, showing bullish momentum. The histogram is also in the green, confirming that momentum is strengthening.
RSI (Relative Strength Index): RSI is around 65, which shows the stock is gaining strength but not yet overbought. It suggests there is still room for the price to move higher.
ADX (Average Directional Index): ADX is around 21, which indicates that the trend is just beginning to gain strength. As it rises above 25, the uptrend will become more powerful.
Overall view: The breakout above 140 from the cup and handle pattern supported by volume and momentum indicators suggests a bullish outlook. The potential target as per the pattern is around 182. The trend looks positive as long as the price stays above the breakout zone.

Bajaj Finserv: Resistance Breaks, Q2 Results Await🔍 Technical Analysis
Bajaj Finserv Limited has delivered an impressive super bullish rally since 2010, establishing itself as a blue-chip financial services stock. Multiple times since 2021, the stock faced resistance at the ₹2,000 level, which acted as a psychological and technical barrier.
However, recent strong year-on-year performance enabled the stock to decisively break above this resistance, and the ₹2,000 level is now acting as support - a classic bullish signal of role reversal. Currently trading at ₹2,112, the stock is well-positioned above its previous resistance.
Adding strength to the bullish setup, both the EMA-44 and Supertrend indicators are signaling bullish momentum, providing technical confirmation for the breakout. Tomorrow's Q2 FY26 results announcement serves as a crucial catalyst that could determine the next directional move.
Entry Strategy: Current levels offer opportunity with ₹2,000 support holding firm. Monitor Q2 results for confirmation.
Targets:
Target 1: ₹2,200
Target 2: ₹2,300
Target 3: ₹2,400
🚫 Stop Losses:
Minor Support: ₹2,000 (previous resistance, now support - be cautious if breached)
Major Stop: ₹1,800
Below ₹1,800, no more expectations on this stock.
💰 Q1 FY26 Financial Highlights (vs Q4 FY25 & Q1 FY25)
Total Income: ₹35,439 Cr (↓ -3% QoQ from ₹36,595 Cr; ↑ +13% YoY from ₹31,480 Cr)
Total Expenses: ₹21,124 Cr (↓ -12% QoQ from ₹23,868 Cr; ↑ +7% YoY from ₹19,655 Cr)
Operating Profit: ₹14,315 Cr (↑ +12% QoQ from ₹12,728 Cr; ↑ +21% YoY from ₹11,825 Cr)
Profit Before Tax: ₹7,204 Cr (↑ +20% QoQ from ₹6,002 Cr; ↑ +21% YoY from ₹5,968 Cr)
Profit After Tax: ₹5,329 Cr (↑ +12% QoQ from ₹4,756 Cr; ↑ +27% YoY from ₹4,209 Cr)
Diluted EPS: ₹17.46 (↑ +15% QoQ from ₹15.14; ↑ +30% YoY from ₹13.39)
🧠 Fundamental Highlights
Bajaj Finserv delivered stellar Q1 FY26 performance with consolidated PAT surging 30% YoY to ₹5,329 crore, driven by robust performance across lending, insurance, and financial services verticals. The company's profit before tax jumped 21% YoY to ₹7,204 crore with total income rising 13% to ₹35,451 crore.
Subsidiary Bajaj Finance (51.39% holding) reported exceptional growth with PAT up 22% YoY to ₹4,765 crore and AUM reaching ₹4.41 lakh crore (up 25% YoY). Customer franchise expanded to 106.51 million, adding 4.69 million new customers in Q1 alone, with new loans booked surging 23% to 13.49 million.
Bajaj Allianz Life Insurance delivered impressive 76% YoY surge in shareholders' PAT to ₹171 crore, with VNB increasing 39% to ₹145 crore driven by product restructuring and favorable mix. Bajaj Allianz General Insurance posted 15% PAT growth to ₹660 crore with gross written premium up 9% to ₹5,202 crore.
Market cap stands at ₹3.45 trillion with EPS of ₹17.30 reflecting 31.1% QoQ and 30.1% YoY increase. The company operates 43 million EMI Network Cards and runs digital platforms like Bajaj Finserv Markets driving cross-selling opportunities.
Strategic diversification across lending, life insurance, general insurance, asset management (₹25,011 crore AUM), and emerging ventures in health, direct wealth management creates multiple growth engines. Capital adequacy ratio at healthy 21.96% provides growth capital while maintaining strong balance sheet.
✅ Conclusion
Bajaj Finserv's decisive breakout above ₹2,000 resistance backed by strong Q1 FY26 showing 27% PAT growth and 30% EPS increase validates the bullish thesis. Subsidiary Bajaj Finance's 25% AUM growth to ₹4.41 lakh crore and 4.69 million customer additions demonstrate operational strength. Tomorrow's Q2 FY26 results serve as critical catalyst for the next leg toward ₹2,400 target. EMA-44 and Supertrend bullish signals provide technical confirmation. Critical support at ₹2,000 and major stop at ₹1,800 offer clear risk management levels for this diversified financial services powerhouse.
Disclaimer: This analysis is for educational and informational purposes only. Please consult your financial advisor and conduct your own research before making investment decisions. Past performance does not guarantee future results. Stock markets are subject to market risks.

Crompton | A Reversal Imminent?DISCLAIMER: This idea is NOT a trade recommendation but only my observation. Please take your trades based on your own analysis.
Points to note:
-----------------
1. RSI shows a bullish divergence with price.
2. The rejection of selling comes inside a Weekly Demand zone.
3. The high volume inside the Demand zone shows presence of buyers at this level.
-----------------
A trade can be taken with the above points in mind:
Entry - CMP, SL - 269, Tgt - 305, RR- 1.88

Sobha- A breakout of consolidation is on cardsRealty sector has been performing well post Q2 results announcements.
Sobha has posted stellar Q2 numbers but it might be one off quarter as well.
Technically, stock is looking ripe for a good flag breakout of consolidation.
We might soon see a breakout coming but sustainment of breakout is crucial for further upmove.
Levels are mentioned on chart. We can see upside of more than 50% if breakout sustains.
You can also check other realty sector stocks and see if any similar pattern is visible.
Please note that I am just NISM certified RA and not SEBI registered.
This analysis is not a recommendation but has been shared for educational purposes only.

Sambhv Steel Tubes cmp 121.45 by the Daily Chart since listedSambhv Steel Tubes cmp 121.45 by the Daily Chart since listed
- Support Zone 107 to 116 Price Band
- Breakout done from the Falling Price Channel
- Rising Price Channel taking upside momentum
- Volumes gradually picking up indicating continued uptrend
- Resistance Zone 125 to 135 Price Band then 142 to ATH 149.25

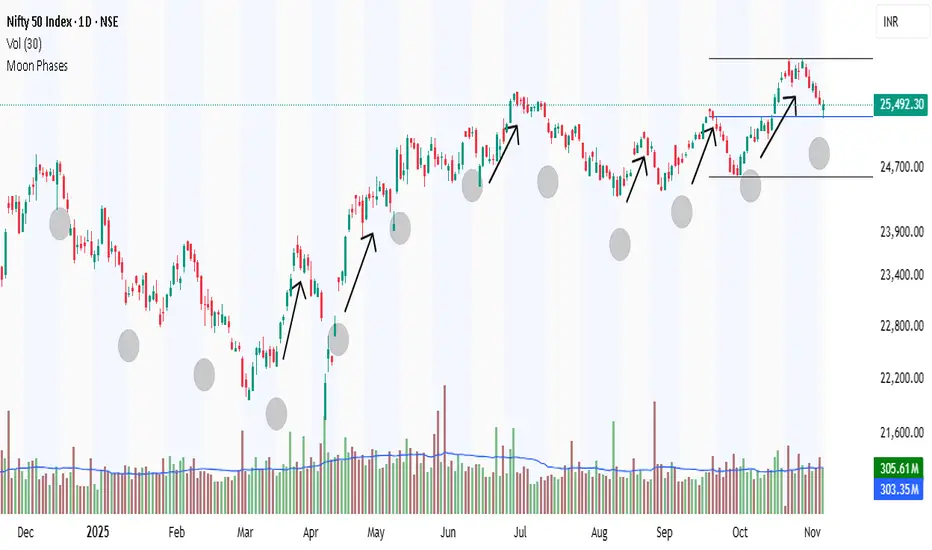
The Moon's phases are the changing mode (NIFTY)The Moon's phases are the changing shapes of the Moon's illuminated portion as seen from Earth, caused by its orbit around our planet. The Sun always lights half of the Moon, but our view of that lit half varies over a cycle lasting about 29.5 days (a synodic month). There are eight primary phases, divided into four major ones (new moon, first quarter, full moon, last quarter) and four intermediate ones (waxing/waning crescent and gibbous).
On October 24, 2025, the Moon is in the waxing crescent phase, about 9% illuminated and roughly 3 days old since the previous new moon (which occurred around October 21). Look for it low in the western sky just after sunset. The next full moon is November 5 (Beaver Moon).
The idea that moon phases influence the stock market—often called the "lunar effect"—stems from behavioral finance, where subtle environmental cues like celestial cycles might subtly sway investor mood, optimism, and risk-taking. While mainstream economics dismisses it as pseudoscience or coincidence, several academic studies have uncovered statistically significant correlations between lunar cycles and market performance. These patterns suggest higher returns around new moons (waxing phase, symbolizing renewal and low energy) and lower returns or increased volatility around full moons (waning phase, linked to heightened emotions).
In short, moon phases aren't a crystal ball but offer a quirky lens on human irrationality in markets. If you're intrigued, overlay them on charts (e.g., via tools like TradingView) alongside fundamentals—but treat it as a tiebreaker, not gospel. For October 24, 2025 (waxing crescent, ~9% illuminated), studies suggest mild optimism; watch for full moon volatility on November 5
IDBI Bank and the Bullish Cup & Handle Pattern📈 Technical Analysis Spotlight: IDBI Bank and the Bullish Cup & Handle Pattern
In the world of technical analysis, chart patterns often serve as powerful indicators of potential price movements. One such pattern, the Cup and Handle, has recently emerged on the daily chart of IDBI Bank Limited, offering traders and investors a compelling bullish setup.
🏦 Current Market Snapshot
As of the latest data, IDBI Bank is trading at ₹100.42. This price action is notable not just for its level, but for the structure it has formed—a classic Cup and Handle pattern, which is widely regarded as a bullish continuation signal.
☕ Understanding the Cup and Handle Pattern
The Cup and Handle pattern resembles the shape of a tea cup:
The "cup" forms after a rounded bottom, indicating a period of consolidation and accumulation.
The "handle" follows as a short-term pullback, typically on lighter volume, before a potential breakout.
This pattern reflects a shift in market sentiment—from bearish to bullish—as buyers gradually regain control.
📊 Technical Confirmation
Several factors strengthen the bullish outlook for IDBI Bank:
The stock is trading above its 50-day and 100-day Simple Moving Averages (SMA), suggesting medium-term strength and trend alignment.
The neckline resistance—the key breakout level—is identified at ₹106. A decisive move above this level would confirm the completion of the Cup and Handle pattern.
🚀 What Happens After the Breakout?
If IDBI Bank breaks above ₹106 with strong volume, it could trigger a bullish rally, as the pattern implies renewed buying interest and momentum. Traders often look for price targets by measuring the depth of the cup and projecting it upward from the breakout point.
🧠 Final Thoughts
The Cup and Handle pattern on IDBI Bank’s chart, combined with its position above key moving averages, presents a textbook bullish setup. While no pattern guarantees future performance, this formation is a favorite among technical analysts for its reliability and clarity.
As always, traders should consider risk management and broader market conditions before acting on any signal.

Possible Nifty Resistance to supportMultiple bullish confluences in Nifty at current level is seen.
1. There is good resistance to support possible in Nifty nr ATH.
2. Good cup and handle pattern.
3. There is support nr weelky 20sma.
If nifty closes above Friday's high than it will trigger buy which can take nifty to 29000+ levels.
We need to wait for next week close. Target and SL marked on chart.

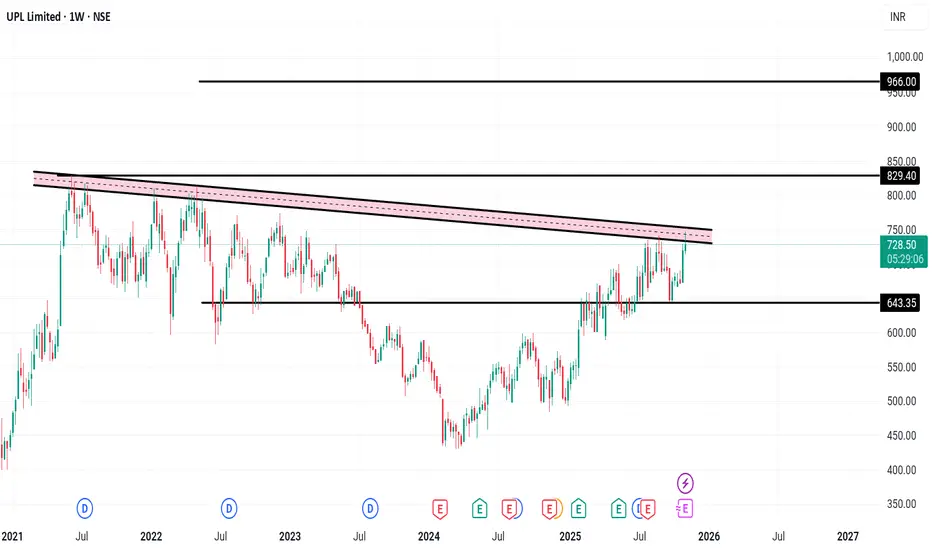
UPL Limited – Weekly Chart Analysis
📊 UPL Limited – Weekly Chart Analysis
Company Overview:
UPL Limited is a global leader in sustainable agricultural solutions, ranked among the top five agricultural solutions companies worldwide. The company operates across multiple countries, offering an integrated portfolio of patented and post-patent agricultural solutions for both arable and specialty crops — including biologicals, crop protection, seed treatment, and post-harvest solutions.
UPL is principally engaged in:
Production and sale of agrochemicals, field crops, and vegetable seeds
Non-agro business of industrial chemicals, chemical intermediates, and speciality chemicals
With market access across the world’s food basket, UPL is focused on driving growth and innovation throughout the entire agricultural value chain — from growers to distributors and partners. 🌱
📈 Technical View (1-Week Chart):
A trendline formation is observed on the weekly timeframe, indicating a potential breakout setup.
Resistance: ₹830 – strong resistance zone. A breakout above this level can trigger the next target near ₹930.
Support: ₹643 – strong support base.
This formation suggests the move could take time to play out, as it’s developing over the weekly chart.
📊 Key Financial Snapshot:
UPL’s current market price is around ₹724.15 with a P/E ratio of 11.65. The company holds a market capitalization of ₹61,068.53 crore and offers a dividend yield of 0.83%.
In the latest quarter, net profit stood at ₹612 crore, reflecting a 125.74% increase compared to the previous quarter. Quarterly sales were ₹12,019 crore, showing an 8.38% rise. The company’s Return on Capital Employed (ROCE) is 7.66%, indicating stable operational efficiency.
Disclaimer: For educational purposes only, not investment advice
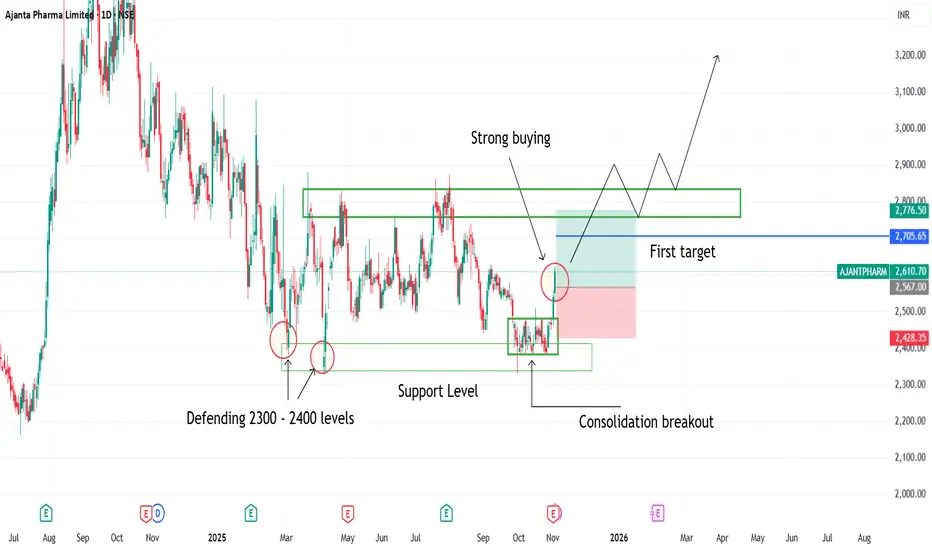
Consolidation breakout seen in ajanta pharma1. Consolidation breakout seen in ajanta pharma
2. Buyers defending 2300 2400 levels
3. Strong Bullish candles indicating strong buyers strength
4. Consolidation breakout has been happened on support levels
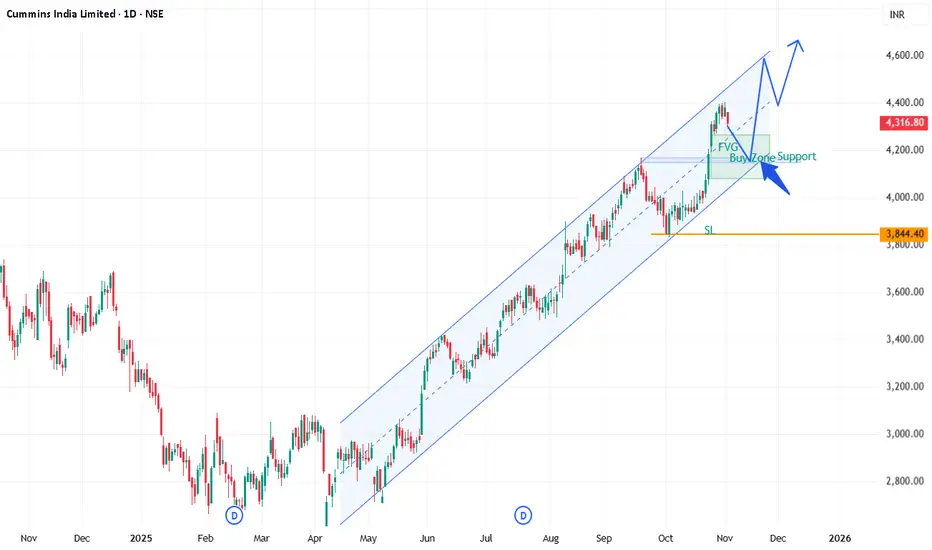
CUMMINSINDCUMMINSIND, Channel support, FVG entry, risk:reward 1:1.5
Cummins India Limited (CUMMINSIND) reported strong financial results for the second quarter (Q2) of FY 2025-26:
Revenue: ₹2,444 crore, up 31% YoY and 8% QoQ, driven by 47% domestic sales growth despite a 13% YoY export decline.
Net Profit: ₹591 crore, reflecting an 11.67% quarter-on-quarter increase and a 27.82% year-on-year rise.
Earnings Per Share (EPS): Around ₹16.3 for the recent quarter.
Market Capitalization: Around ₹1.2 lakh crore.
Price to Earnings Ratio (P/E): Approximately 55.76.
Stock price key levels: Traded around ₹4,317; 50-day moving average near ₹4,012; 200-day moving average near ₹3,342.
Cummins India demonstrates solid growth with strong domestic demand fueling revenue and profit expansion, maintaining a robust market position in the engineering sector
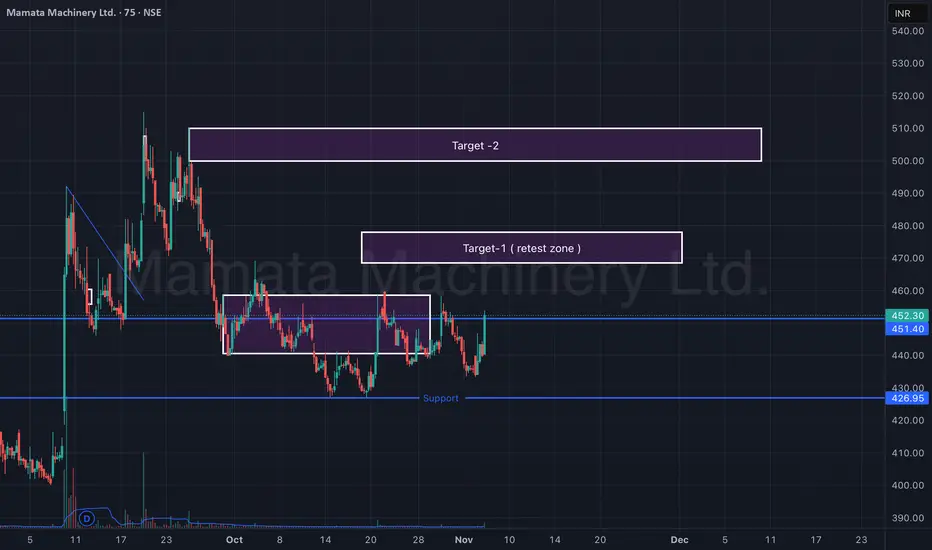
Mamata Machinery Ltd – Support Reversal & Retest Zone (75-min)Mamata Machinery is showing early signs of reversal from a strong support zone around ₹425–₹430. After forming a double-bottom-like structure, the stock has bounced sharply with rising volumes, indicating a possible short-term trend reversal.
Currently, price action is approaching a retest zone (Target-1) near ₹465–₹470. Sustaining above this level can open the path toward the next resistance cluster (Target-2) near ₹505–₹515.
🎯 Key Levels:
CMP: ₹452.30 (+3.81%)
Support Zone: ₹425 – ₹430
Target-1 (Retest Zone): ₹465 – ₹470
Target-2: ₹505 – ₹515
Stop-Loss: ₹425 (on 75-min close basis)
📊 Technical View:
Price rebounded from major support with visible volume spike.
Structure forming higher lows — early indication of momentum shift.
Short-term EMAs turning upward; potential crossover likely soon.
Sustained move above ₹470 can confirm breakout continuation toward ₹510+.
🧠 View:
Mamata Machinery has reversed from key support and is testing its retest zone. A breakout above ₹470 could trigger a short-term rally toward ₹510, while maintaining a stop-loss below ₹425.
KPILAscending Channel (Main Structure)
• The stock is trading within an upward-sloping channel, making higher highs and higher lows.
• The lower trendline acts as dynamic support, and the upper trendline as resistance.
Rectangle / Box Range (Recent Phase)
• Price consolidated between 1,220–1,310 for several sessions — forming a rectangle pattern.
• This consolidation occurred within the channel, suggesting a pause before continuation.
Breakout Confirmation
• Price has just closed above the upper rectangle boundary with strong volume.
• EMA crossover is supportive — price above both short and medium EMAs.
• RSI > 70 indicates strong momentum, confirming the breakout.
Consider buying above the 1325 level, with the targets of 1355, 1370, and 1395

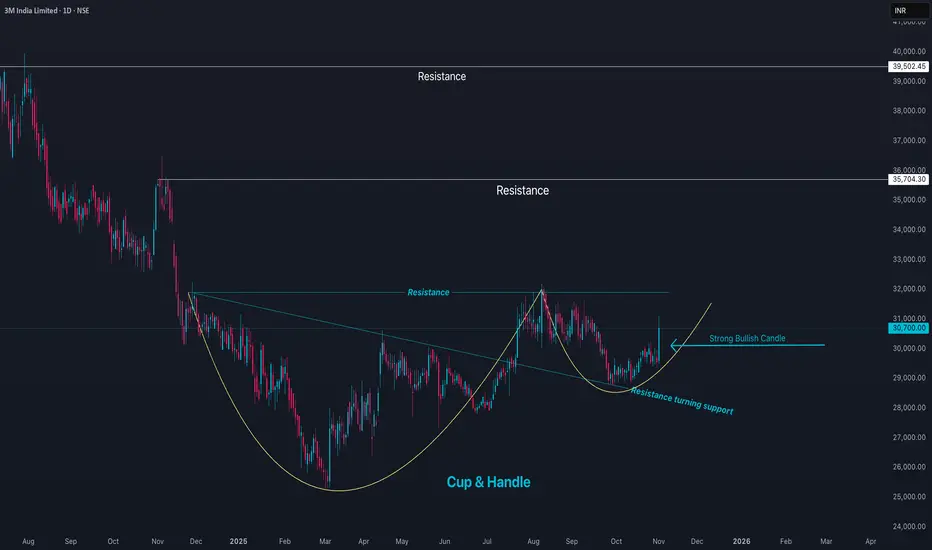
3MINDIA Price Action3M India Limited (3MINDIA) is currently trading around ₹30,865, marking a strong 4.4% rise in the latest session. The stock has a 52-week high near ₹37,133 and a low around ₹25,718, placing it closer to the upper end of its annual range. The market capitalization is approximately ₹33,300 crore.
3M India shows robust financial health with an earnings per share (EPS) of about ₹440 and a high price-to-earnings (P/E) ratio near 69, reflecting premium valuation driven by strong management, innovation, and brand dominance. The stock price recently traded above its 50-day (₹29,941) and 200-day (₹29,348) moving averages, confirming positive momentum.
Profit margins are solid, with an operating margin near 18.9% and net margin around 10.7%. Return on equity (ROE) is high at approximately 24%, and the company’s debt-equity ratio is very low (0.03), indicating a conservative capital structure. Dividend yield is modest at 1.85%. Volume trends indicate steady investor interest.
Technically, the stock is in an uptrend with nearest support at around ₹29,500 and resistance near the 52-week high zone around ₹37,000. Overall, 3M India maintains a strong market position, consistent earnings growth, and solid fundamentals, supporting a positive medium- to long-term outlook barring broader market disruptions.
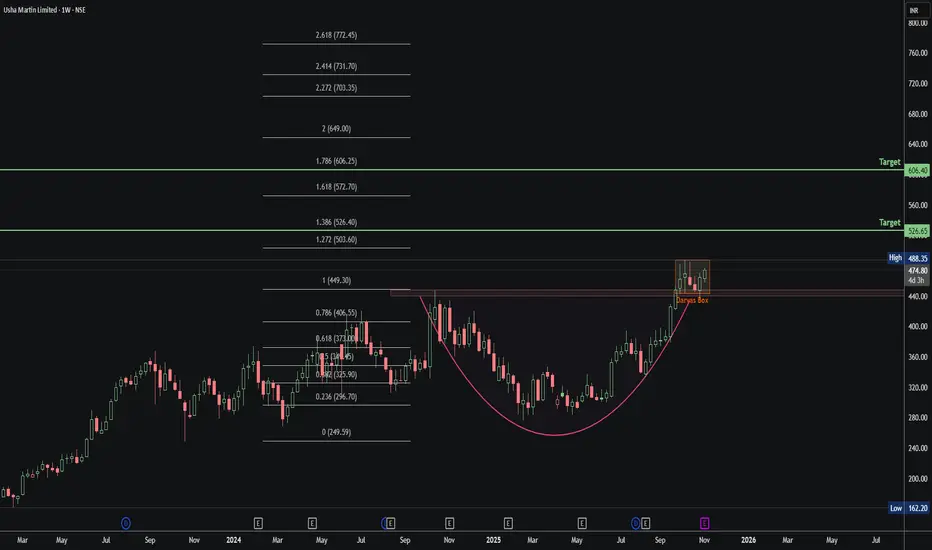
Usha Martin: Cup & Handle Breakout Loading!🧩 1. Cup & Handle Setup
Smooth U-shaped Cup with a tight Darvas Box Handle on top.
Classic bullish continuation structure — breakout confirmation above ₹488.
📈 2. Fibonacci Outlook
0.786 (₹406) → Neckline retest
1.0 (₹449) → Cup breakout
1.272 (₹503) / 1.386 (₹526) → 🎯 Short-term targets
1.618 (₹572) / 1.786 (₹606) → 🎯 Mid-term targets
🧱 3. Darvas Box
Tight consolidation between ₹471–₹488.
Low-volume zone = accumulation before breakout.
Break above ₹488 → continuation toward fib targets.
🔍 4. Key Levels
Support: ₹440 / ₹406
Resistance: ₹488
Targets: 🎯 ₹526 → ₹606 → ₹649
Invalidation: Close below ₹380
⚙️ 5. Psychology
Cup = Accumulation phase
Handle (Darvas Box) = Rest before breakout
Breakout = Momentum expansion with volume.
✅ Quick Summary
Pattern: Cup & Handle + Darvas Box
Trend Bias: Bullish continuation
Breakout Zone: ₹488+
Targets: ₹526 / ₹606 / ₹649
Stop Zone: Below ₹380
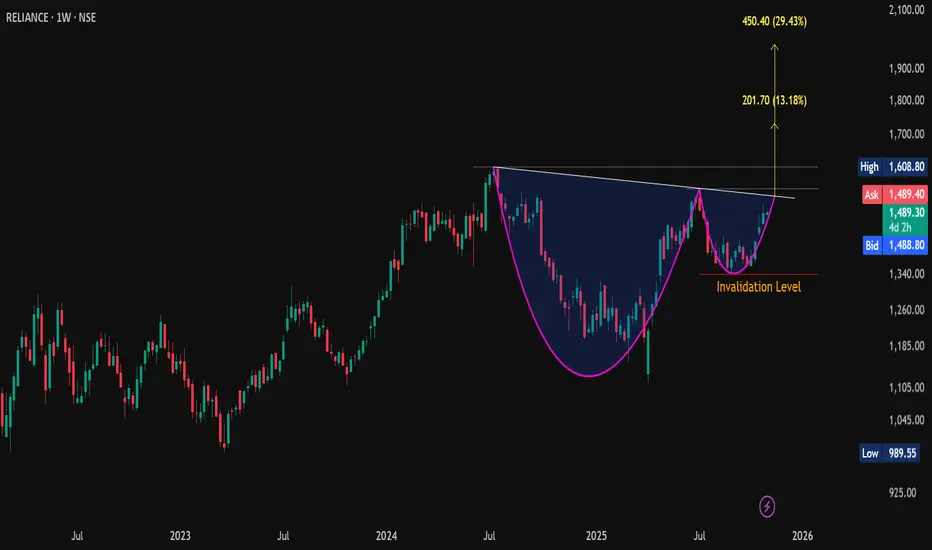
#Reliance | Cup & Handle Breakout Setup📊 CMP: 1489
💥 Breakout Level: WCB above Handle Neckline
🎯 Pattern Targets: 1730 / 1980+ (16 & 33% from CMP)
🛡 Support: 1456 / 1407-1409
🚧 Resistance: 1527-1551 / 1597-1609
❌ Invalidation Level: Below 1340.60 (WCB)
#CupnHandle #ChartPattern #PriceAction #SwingTrade
📌 Disclaimer: This analysis is shared for educational purposes only. It is not a buy/sell recommendation. Please do your own research before making any trading decisions.
Privi Speciality Chemicals Ltd – Weekly Breakout SetupPrivi has shown a clean breakout from a long consolidation zone, backed by steady volume expansion. After months of range-bound action, the stock finally broke above ₹2,600 and is now sustaining well above its breakout zone — indicating the start of a new upward leg.
Price action shows strong bullish candles supported by the 10- and 20-week EMAs, signaling trend confirmation.
🎯 Key Levels:
CMP: ₹2,903 (+2.55%)
Breakout Zone: ₹2,500 – ₹2,600
Target Zone: ₹3,150 – ₹3,250
Stop-Loss: ₹2,700 (weekly close basis)
📊 Technical View:
Weekly breakout from multi-month consolidation box.
Volume confirmation supports sustained momentum.
Price trading above both EMAs, confirming bullish trend continuation.
Minor resistance near ₹2,950; sustained move above can accelerate momentum.
🧠 View:
Privi Speciality Chemicals has completed a strong breakout after a long accumulation phase. Sustaining above ₹2,900 can push the stock towards ₹3,200 levels in the coming weeks.

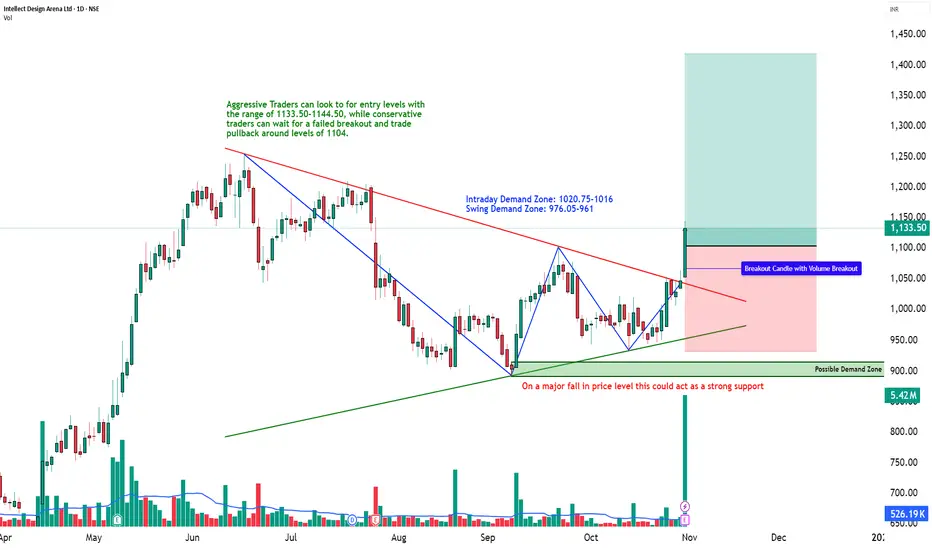
Descending Triangle Breakout with Institutional Volume | STWP💹 Intellect Design Arena Ltd (NSE: INTELLECT)
Sector: IT – FinTech Solutions | CMP: ₹1,133.50 | View: Bullish Momentum Breakout Setup
📊 Price Action:
Intellect Design Arena has delivered a strong bullish breakout from its multi-month descending trendline, marking a structural shift from a consolidation base to a clear uptrend.
The stock reversed sharply from the ₹890 swing low and confirmed momentum above the ₹1,100–₹1,120 zone with an explosive 10x volume expansion.
The wide-range bullish candle and sustained higher close suggest institutional breakout participation and trend continuation toward upper resistance zones.
💼 HNI Trade Levels (STWP Setup):
Aggressive Entry: ₹1,114.50 | Stop Loss: ₹1,044.35
Low-Risk Entry: ₹1,076.5 | Stop Loss: ₹1,019.5
HNI and institutional activity is visible through heavy delivery-based volume and strong follow-up momentum.
The bullish structure remains intact as long as price sustains above ₹1,075–₹1,080, where short-term demand has been confirmed.
📉 VCP Analysis:
Intellect displays a multi-stage Volatility Contraction Pattern (VCP) — 8 visible contractions as per the VCP dashboard.
Each contraction narrowed with decreasing volume before the final 20-day breakout candle confirmed a volatility expansion phase.
This marks the beginning of a trend acceleration stage, aligning perfectly with RSI, MACD, and Supertrend confirmations.
📈 STWP Trading Analysis:
Entry: ₹1,114.50 | Stop Loss: ₹1,044.35
The breakout candle exhibits strong momentum with 5.42M volume vs an average of 0.52M, indicating institutional footprints.
The price is now sustaining above short- and medium-term EMAs, with all major timeframes (Daily–Weekly–Monthly) confirming an uptrend alignment.
Holding above ₹1,095–₹1,075 will maintain the bullish bias, keeping momentum setups active toward ₹1,175–₹1,255 zones.
📏 Fibonacci Analysis:
From swing low ₹890.25 to swing high ₹1,255.0:
61.8% @ ₹1,115.7 → Confirmed breakout level.
78.6% @ ₹1,176.9 → Next momentum target.
100% @ ₹1,255.0 → Swing resistance.
A daily close above ₹1,116 validates the Fibonacci continuation path toward ₹1,255–₹1,285, with an extended potential to ₹1,354 (Fibo 127.2% projection).
🧭 STWP Support & Resistance:
Resistances: ₹1,167.5 | ₹1,201.5 | ₹1,255.0
Supports: ₹1,076.5 | ₹1,019.5 | ₹985.5
The ₹1,076–₹1,020 zone acts as a key accumulation pocket, while the ₹1,255 area marks a significant swing barrier.
Structure indicates strong base support with progressive higher demand, suggesting buyers remain dominant on dips.
📊 STWP Volume & Technical Setup:
Today’s session recorded 5.42M shares vs 0.52M average, a 10x volume surge, confirming institutional breakout participation.
Indicators show bullish MACD crossover, RSI momentum above 70, and Stochastic strength across all timeframes.
The breakout is also validated by Bollinger Band expansion, signaling volatility release.
Trend Direction: UPTREND | Volume Confirmation: Strong Institutional Activity
🧩 STWP Summary View:
Final Outlook:
Momentum: Strong | Trend: Bullish | Risk: High | Volume: High
Intellect Design Arena has transitioned into a confirmed bullish continuation phase with institutional footprints and multi-indicator confirmation.
Holding above ₹1,075 keeps the pattern valid for a potential rally toward ₹1,175–₹1,255 levels.
The setup remains technically clean, high-volume backed, and trend-aligned — favoring bullish bias continuation in the near term.
⚠️ Disclosure & Disclaimer – Please Read Carefully
The information shared here is meant purely for learning and awareness. It is not a buy or sell recommendation and should not be construed as investment advice.
I am not a SEBI-registered investment adviser, and this analysis is based on chart observations, technical patterns, and public data.
Trading involves risk; market movements can be sudden, and losses may exceed invested capital.
Past performance or setups do not guarantee future results.
Please evaluate your risk management and suitability before taking any trading decision.
Consult a SEBI-registered financial adviser before acting on any trade idea.
Position Status: No active position in (INTELLECT) at the time of analysis.
Data Source: TradingView & NSE India (Past Chart Reference).
💬 Found this useful?
🔼 Give this post a Boost to help more traders discover structured learning.
✍️ Drop your thoughts, queries, or setups in the comments — let’s grow together!
🔁 Share this with fellow traders and learners to promote structured analysis.
👉 “If you liked this breakdown, follow for more clean, disciplined setups with patience at the core.”
🚀 Stay Calm. Stay Clean. Trade With Patience.
Trade Smart | Learn Zones | Be Self-Reliant 📊
NIFTY Breakout Retest — Bulls Getting ReadyNIFTY appears to be forming a classic Cup and Handle pattern, a strong bullish continuation setup. Recently, the index successfully broke out above the handle resistance zone, confirming the pattern’s validity. Currently, it is pulling back to retest the breakout level, which often serves as a healthy consolidation phase before the next leg higher.
The measured move projection from the depth of the cup suggests a potential upside target near the 29,900–30,000 zone, representing approximately a 16–17% rally from the breakout point. The support region near 25,600–26,200 (previous resistance) will now act as a crucial demand area for bulls to defend.
If the retest holds and buying pressure resumes, NIFTY could witness renewed upward momentum, confirming the larger bullish trend continuation.

USD-JPY is in a Bullish PatternUSD-JPY is about to Break the Pattern . In 30 Min TF it is Trading in in a FLAT-TOP pattern and also it shows a Flag & Pole pattern and Both are Bullish Patterns . This type of pattern may give the Breakout on either side.

vaibhav global good support made around 180 levels and lot of consolidation in tight range now seeing weekly breakout and strong close above downvtrendline a big move can be seen in next 2-3 quarters towards 500 .this view fails if price monthly start closing below 180 levels .
