Inverse head-and-shoulders - Coal IndiaInverse head-and-shoulders chart pattern
is an important indicator for identifying bullish reversals.
Characterized by three (3) distinct troughs: a lower "head" between two (2) higher "shoulders,"
this pattern signals a potential shift from a bearish to a bullish trend when the price breaks
above the "neckline."
Community ideas

MAZDOCK - Ready for the next moveThe stock has been a market favorite. Technically it has cooled down owing to the Wave analysis which every stock goes through. Overall the Stock is in Stage 2. The stock is now gearing up to give Range Breakout.
On the Fundamental side:
- Strong Long Term Fundamental Strength with an average Return on Equity (ROE) of 24.14%
- Healthy long term growth as Net Sales has grown by an annual rate of 24.97% and Operating profit at 94.40%
- Company has a low Debt to Equity ratio (avg) at 0 times
- The company has declared Positive results for the last 8 consecutive quarters
- NET SALES(9M) At Rs 8,217.50 cr has Grown at 35.18 %
- ROCE(HY) Highest at 44.63 %
- INVENTORY TURNOVER RATIO(HY) Highest at 2.19 times
- Increasing Participation by Institutional Investors. Institutional investors have increased their stake by 0.56% over the previous quarter and collectively hold 3.02% of the company.

Vani Commercial - Bullish Pennant Breakout- 3 rising methodsIt has formed bullish pennant breakout with three rising methods candlestick patterns on the monthly chart. On weekly it shows a VCP Pattern with Higher high, Higher low with 50 MA as support and overall, 3 years of consolidation can be seen.
Hopeful of showing a good move in the upcoming months specially in February
CMP: 12.70
Target 1: 15.70
Target 2: 18.00
Stop Loss: 10.70
Disclaimer: Trade at your own risk

Laurus Labs Date 28.01.2025
Laurus Labs
Timeframe : Weekly Chart
Remarks :
1 Currently at 50% of Fibonacci retracement
2 Head & Shoulder at top of the trend & its neckline + Support & resistance band = 615
3 Descending triangle neckline + Support base + 61.8% retracement of Fibonacci = 497
4 Currently at RSI mean reversion + 50% retracement, may have 2%-4% pull back
Regards,
Ankur

Parallel channel breakout with retest in Laurus LabsNSE:LAURUSLABS
A bullish parallel channel breakout has happened with a retest at 550 levels.
Currently on a weekly level stock can go past 600 with a buying price at 570-580 levels & subsequently increase beyond 600.
A SL of 450 with a higher target of 700, 900 & 1100 can be achievable in 1 1-year time frame.

VBLwe see this stock at weekly support and as per CPR concept we do see coming week it formed narrow cpr on weekly and same narrow on daily time frame expecting a momentum based move coming week just a view not a reco...

How to define the Daily Bias for the Day? Determining the likely direction of the market for a particular day can be both challenging and cumbersome. Many traders find themselves overwhelmed by the multitude of data points and differing indicators. However, using a structured methodology, one can systematically analyze the chart and create a daily bias for the day.
If you are an intraday trader, you can use a combination of the Daily chart for the bias and the 15-minute chart for the entry, or alternatively, you can use a 75-minute chart for the bias and a 5-minute chart for the entry.
Steps to Identify the Daily Bias
1. Identify the Most Recent Swing High and Swing Low
The first step in defining the daily bias involves identifying the most recent swing high and swing low. This can be done manually, or you can use ready-made indicators available on trading platforms such as TradingView to plot these points on the chart. Understanding swing highs and lows are fundamental concepts in technical analysis, representing the highest and lowest points within a specific time period. These points can indicate potential reversal areas where the market may change direction.
2. Divide the Region into Two Equal Parts
Once the swing high and swing low are identified, the next step is to divide this region into two equal parts. This can be achieved using the rectangle tool in TradingView. Make sure to enable the middle line feature within the rectangle tool to visually divide the two sections. The middle line acts as a crucial reference point, providing a clear visual boundary between areas of perceived higher and lower value.
3. Define Retail and Wholesale Areas
After dividing the region into two parts, the upper section is termed the “Retail Area,” where prices are considered expensive. Conversely, the lower section is called the “Wholesale Area,” where prices are deemed cheap. This concept stems from the basic economic principle of supply and demand, where higher prices in the Retail Area suggest selling opportunities, and lower prices in the Wholesale Area indicate buying opportunities.
4. Focus on Buying and Selling Opportunities
With the areas defined, the next step is to focus on the appropriate trading opportunities. When prices are in the Retail Area, the focus should be on “Selling” opportunities. When prices are in the Wholesale Area, the focus should be on “Buying” opportunities. This methodology, known as “Curve Analysis” or determining your Bias for the day, simplifies the decision-making process by providing a clear framework for evaluating market conditions.
Example: BankNifty 75-Minute Chart
Let’s look at an example to understand this better. Here we have the BankNifty 75-minute chart. We have identified the most recent swing high and swing low on the chart and divided the section into two parts. The current market price is in the Wholesale Area, which means that on your execution time frame, which is 5 minutes, you will be focusing on buying or “Long” opportunities.
Now, proceed to the lower time frame and identify your key levels of interest using support, resistance, demand, supply, or any other technical analysis tools. Observe how the supply zone on the chart played out beautifully and how prices fell from the Retail Area. This example illustrates the practical application of the methodology, demonstrating how historical price movements can inform future trading decisions.
While the above steps provide a solid foundation for defining the daily bias, incorporating the following advanced tips can enhance your trading efficiency:
1. Use Multiple Time Frames
Integrate multiple time frames to gain a comprehensive view of the market. For example, use the Daily chart to determine the overall bias and the 15-minute or 5-minute chart for precise entries and exits. This multi-time frame analysis allows traders to align shorter-term trades with the broader market trend, increasing the likelihood of successful outcomes.
2. Incorporate Technical Indicators
Employ technical indicators such as Moving Averages, RSI, and MACD to corroborate your bias. Confirming signals from multiple sources can provide greater confidence in your trades. These indicators serve as additional tools to validate the defined bias, offering insights into market momentum, overbought or oversold conditions, and potential trend reversals.
3. Monitor Economic News
Stay updated with economic news and events that could influence market movements. Important news releases can cause significant price fluctuations, impacting your defined bias. Economic indicators, such as GDP reports, employment data, and central bank announcements, can have profound effects on market sentiment and price action.
4. Practice Risk Management
Always practice sound risk management strategies. Define your risk tolerance levels and use stop-loss orders to protect your capital. Never risk more than you can afford to lose on any single trade. Effective risk management involves setting appropriate position sizes, diversifying trades, and adhering to pre-defined risk parameters to safeguard against unforeseen market movements.
5. Keep a Trading Journal
Maintain a trading journal to record your trades, strategies, and outcomes. Analyzing past trades can help you refine your methodology and improve future performance. A detailed journal provides valuable insights into trading patterns, strengths, and areas for improvement, fostering continuous learning and development.
Conclusion
Defining the daily bias for the day is crucial for successful intraday trading. By following the structured steps of identifying swing highs and lows, dividing the price region into Retail and Wholesale areas, and focusing on appropriate buying and selling opportunities, traders can streamline their market analysis. Remember to use multiple time frames, incorporate technical indicators, stay informed about economic news, practice risk management, and maintain a trading journal. With these strategies in place, you can effectively navigate the markets and enhance your trading performance.
I hope you all find this article useful. Do give your valuable feedback in the comments section.

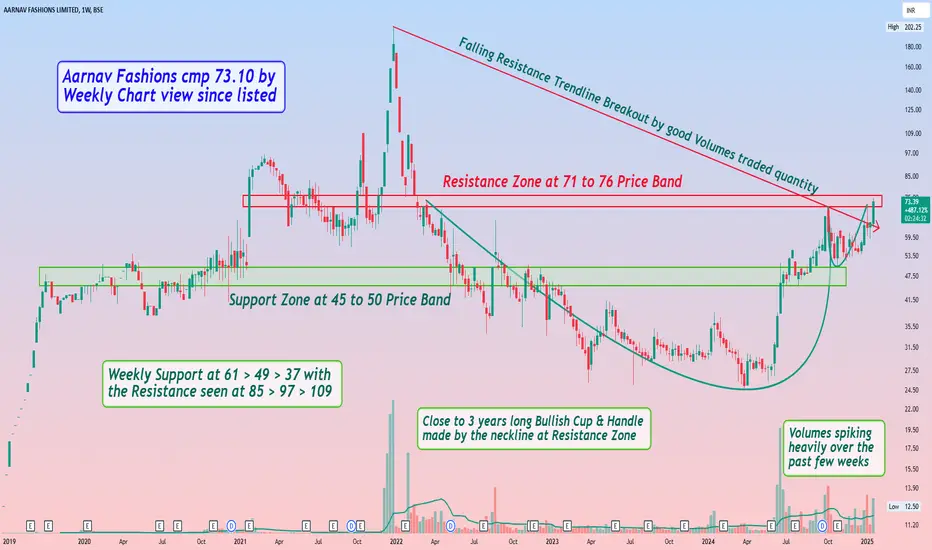
Aarnav Fashions cmp 73.10 by Weekly Chart view since listedAarnav Fashions cmp 73.10 by Weekly Chart view since listed
- Support Zone at 45 to 50 Price Band
- Resistance Zone at 71 to 76 Price Band
- Volumes spiking heavily over the past few weeks
- Falling Resistance Trendline Breakout by good Volumes traded quantity
- Close to 3 years long Bullish Cup & Handle made by the neckline at Resistance Zone
- Weekly basis Support seen at 61 > 49 > 37 with the Resistance seen at 85 > 97 > 109
Zensar Technologies W pattern Breakout. 🚨 Zensar Technologies Trade Alert 🚨
🔍 Setup at a Glance:
Pattern: W-pattern forming within a trading channel 📈
Breakout Level: ₹840
Support Zones:
Channel support
200 DMA (holding since March 2024)
Trend: Overall uptrend, trading above key DMAs ✅
Volume: 🚀 2x-3x higher than previous sessions today!
RSI: Strong and supportive – signaling momentum.
💡 Trading Plan:
Entry: Above ₹840 (start small; e.g., buy just 10% of your usual quantity).
If the stock closes above ₹840, you can consider adding more.
Target (T1): ₹1025 (channel top) – +21% upside potential 🎯
Stop Loss (SL): ₹709 – -16% downside risk 🔻
Risk-Reward Ratio (RR): ⚖️ 1:1.3
⚠️ Key Risks & Considerations:
Market Structure:
Currently in a Lower High - Higher Low (LH-HL) sequence.
This trade goes against the broader trend – a higher probability of failure!
Why Consider It?
Exceptional volume and strong RSI, combined with a well-defined W-pattern and breakout level, make this setup compelling.
🚦 Risk Management Tip:
Example Position Sizing: If you usually buy 100 shares, start with only 10 shares initially.
⚠️ Disclaimer: This analysis is for educational purposes only.
Please assess your own risk tolerance and consult with a financial advisor before trading. 📘
💬 What’s your view on Zensar? Let’s discuss in the comments below! 👇

BBTC: Showing strength from a critical level!⚡️Price Analysis:
1️⃣ Perfect retest of 5-year ATH breakout level.
2️⃣ Overall price structure is bullish.
3️⃣ EMAs are providing dynamic support to the price.
4️⃣ Volumes are good.
5️⃣ Price respecting and bouncing from the fibonacci 60% retracement level.
✨ Key Observations:
➡️ Multiple timeframe alignment showing strength
➡️ Ideal RRR setup at current retest level
➡️ 1:3 RRR can be expected.
➡️ Multiple target zones visible on upside
➡️ Trend structure remains strongly bullish
⚠️ Disclaimer: This is NOT a buy/sell recommendation. This post is meant for learning purposes only. Views are personal. Please, do your due diligence before investing.⚠️
💬 Drop your thoughts on the analysis below! ✌️
🔥 Happy Trading!✅🚀

Stock to watch !!!Good setup to break ALL TIME HIGH !!! Recent we can see volume buildup and taken strong support .
Wait to take support at 61.80 level.

SILVER all set to MASSIVELY OUTPERFORM Banking Stocks!Attached: Silver Spot vs. IndusInd Bank Monthly Chart as of 22nd January 2025
I have taken Indusind Bank as a proxy for Indian Banking Stocks as it is a Major Large Cap Private Bank that is not only part of Bank Nifty but also part of Nifty 50 and once used to be part of Top 20 Nifty stocks but because it crashed 40% in 2024 it lost that spot
The Monthly Ratio Chart has the following Observations that support a Bullish Investment Case for Owning Silver vs. Indian Banking Stocks, they are as follows:
1) 20/ 50 Monthly EMA Bullish Crossover for the first time since 2009
2) Ratio closing above 100 Month EMA and consolidating for the Next Leg Up
3) Ichimoku Cloud Resistance that held for more than a Decade also getting cleared
And the Upside as shown on the Ratio Chart is crazy which if you translate to a Price Chart, means Silver over the years can see Triple Digit Returns, Doubling to Quadrupling!

Oberoi Realty - Possible ReversalStock at demand zone
Demand zone 1710 - 1740
Possible reversal from this area
Drop Base Rally seen in daily
Downside safe till 1700 (SL)
Upside target up to 2000
Entry only if strong candle seen in LTF (Hourly)
As market is in bearish mode

Stocks in Focus: Biocon, Bharat Dynamics & Apollo Micro Systems1. Biocon NSE:BIOCON
● The stock reached a peak of ₹483 in December 2020, then experienced a downturn, entered a prolonged consolidation phase.
● This phase led to the formation of an Inverted Head & Shoulder pattern.
● Following a recent breakout, the stock is now poised for upward movement.
2. Bharat Dynamics NSE:BDL
● After hitting an all-time high around ₹1,795, the stock saw a decline of nearly 50% and eventually found support at ₹890.
● From this point, the price rebounded and recently surpassed its trendline resistance, setting the stage for substantial future gains.
3. Apollo Micro Systems NSE:APOLLO
● The stock underwent significant consolidation after marking an all-time high near ₹161.
● With a fresh breakout, the price is now set to exceed its past high and make new highs.

Wipro halting after a gap up opening.Wipro is showing some good chart pattern. The stock has given a gap up opening and took resistance form 303-305 levels.
Watch for a restest of the break out for entry or enter once the resistance levels is breached.
Resistance levels ;- 304, 309.5
Support ;- 294.6, 287.5
Wait for a price action and trade accordingly.

Simple Price Action Analysis in CREDITACCStock was falling since in a typical downfall manner - LL &LH
Suddenly there are volume Spikes since last few trading session and first time the lower high broken with recent low is made higher than previous one
Now if it breaks recent High (Daily close>1030) then there may be confirmed trend reversal.
The high volume bars gave some aid to Analysis.
Few more confirmations - Price closed today crossing daily EMA50
- Rsi trending up almost reaching 60
- Highest delivery today after 8th January
- closed above Supertrend.
Earliest Target can be Latest Daily EMA 200 : 1150-1160
Long term Targets are 1200,1300,1400+
SL can be 880
Keep watch and do your analysis and give suggestions in comments.

#Nifty directions and levels for January 21st, TuesdayGood Morning, friends! 🌞
Here are the market directions and levels for January 21st, Tuesday:
Market Overview:
The global market is maintaining a bullish sentiment (based on the Dow Jones), while our local market shows a moderately bullish sentiment. Today, the market is likely to open with a neutral to slightly gap-up start, as the Gift Nifty indicates a +60 point positive opening.
In the previous session, both Nifty and Bank Nifty had a solid pullback. According to the structure, it seems like a "flag pattern." If the market breaks the immediate resistance with a solid candle today, we can expect a further rally continuation. However, if we analyze the wave structure, it could represent the "C" leg, and also its a final leg of the pullback. So, In this scenario, if the market rejects around the immediate resistance, we can initially expect a 23% to 38% correction. A trend reversal (from bullish to bearish) will be considered only if the 38% Fibonacci level is broken. This is the basic structure. Let's look at the chart for more clarity.
Both Nifty and Bank Nifty exhibit similar structural sentiments.
Current View:
The current view, based on Elliott Wave analysis, suggests that if the gap-up doesn't sustain or if the market faces rejection around the immediate resistance, we can expect a minimum correction of 23% to 38% in the minor swing. This is a major support level, so until the 38% mark is broken, the trend remains bullish. Conversely, if it breaks the 38%, we can consider that a trend reversal.
Alternate View:
The alternate view suggests that if the gap-up sustains and consolidates or breaks the immediate resistance level, then the rally will likely continue. In this case, we can consider that a flag pattern or the third wave of the new impulse.

Infosys Stock Crashes when to Buy Technical Chart Analysis
According to chart analysis, there is a possibility of further decline in Infosys shares. The stock has broken its recent support levels, with the next downside targets at ₹1650 and ₹1550.
RSI (Relative Strength Index): This indicates that the stock may still enter the oversold zone.
Moving Average: The stock is trading below its 50-day and 200-day moving averages, signaling a bearish trend.
Volume Analysis: A significant increase in volume suggests that large investors are also involved in this decline.
Trading and Investment Opportunities
This situation could offer excellent opportunities for futures and options traders.
Short-Term Trading:
Consider taking short positions with ₹1650 and ₹1550 levels in mind.
Trade with stop-losses and a proper entry-exit plan.
Long-Term Investors:
Long-term investors may wait for further decline in the stock. Around ₹1400/1300, this could present a good buying opportunity.

Ashapura Minechem - All Time Breakout after 17 yearsAshapura Minechem has give ATH breakout after 17 years. Technically this stock can go to whooping 24500. Other factors:
1. 3rd largest producer of Bentonite in the world
2. Promoters have increased stake
3. Electrification, E-cars, Solar panels gives huge opportunity
4. Technically, has given breakout after 17 years
5. Has done a retracement of ~55% from its high price before moving up and giving a breakout
6. Monthly volumes have been steady
Looking at the above parameters and opportunities ahead, this stock is poised to move up to our immediate targets and a big buy for longterm.
Keep this stock in your radar. Keep following @Cleaneasycharts as we provide Right Stock at Right Time at Right Price.
Cheers!!

#JISLJALEQS - Potential Break Out 📊 Script: JISLJALEQS
Key highlights: 💡⚡
📈 IH&S formed in Daily chart.
📈 Wait for consolidation then enter on BO with volume
📈 Price gave a good up move
📈 Volume spike seen
📈 MACD Cross Over
📈 One can go for Swing Trade.
BUY ONLY ABOVE 80 DCB
⏱️ C.M.P 📑💰- 76
🟢 Target 🎯🏆 – 20%
⚠️ Stoploss ☠️🚫 – 10%
⚠️ Important: Always Exit the trade before any Event.
⚠️ Important: Always maintain your Risk & Reward Ratio.
✅Boost, Like and follow to never miss a new idea! ✅
Disclaimer: I am not SEBI Registered Advisor. My posts are purely for training and educational purposes.
Eat🍜 Sleep😴 TradingView📈 Repeat 🔁
Happy learning with MMT. Cheers!🥂

Bank Nifty - Is this A Rising Wedge from 47898 As discussed early morning .... 49000 was our key & psychological level ... Index dropped & came close to 48500-48600 zone
Falling From 49000 Level
Support Zone 48500-48600
Makar Sankranti marks the Sun's transition into Capricorn and the beginning of an auspicious period. Historically, equity markets turn optimistic post-Makar Sankranti, driven by cultural sentiment and Budget expectations. Will Budget 2025 keep the trend alive? 🌞
This comes after a 26-day fall in major benchmark indices, which started on 5th Dec 2024.
In the last two days, the index surged from 47,898 to 49,000. However, during the first half of today's session (15th Jan 2025), it fell below 49,000, hitting a low of 48,522 as shown in the snapshots

Can NIFTY Regain Its Balance or Will It Plummet Further?Timeframe: 4h
After reaching a peak of 26,277 , the NSE NIFTY has begun to decline within a downward parallel channel. The Elliott wave structure can be identified as (W) – (X) – (Y) , where wave (X) peaked at 24,867 , followed by a downward movement for the final wave (Y). The price has fallen below the 20 , 50 , 100 , and 200 EMA levels, with an ATR of 166.36 .
The correction has several key levels to consider:
At 100% retracement of wave (W) at 21,962
At 100% retracement of wave (a) at 22,827
At the lower boundary of the corrective channel
Bearish sentiment is currently stronger than buyer demand. A reversal may occur either after a breakout from the parallel channel or at the lower boundary of the channel. This is possible as long as the swing low of 21,283 remains intact.
We will update further information soon.

Wipro Looking for SupportHello friends good evening, I have prepared a chart for one of my trades in Wipro which I am sharing with you all. So as we can see the Wipro ADR ( American Depository Receipt) listed in the American market is trading down by 4 to 5 percent. In such a situation we can expect that we may see a similar decline in the price of Wipro shares tomorrow or in the coming session. Therefore I have marked a demand zone on its weekly chart and hope that the price will get a bounce from this demand zone, which will be helpful for us to trade on the long side.
Different traders follow different setups and indicators to understand support bounce, I would like to understand it only through price action on smaller time frames and will update accordingly.
I hope you liked the idea if yes then please like and share it, thank you all.
Best Regards- Amit.
