Practical Study On Supply and Demand Concept NSE:ICICIBANK
Most traders fail at Supply & Demand for one simple reason:
They draw zones…
but don’t understand context, intent, or execution.
Zones don’t make money.
Decisions do.
📘 Supply & Demand – Practical Application
All the charts are annotated in very much details no description is needed so study these charts in detail and that will be self-explanatory.
1.
2.
3.
4.
5.
6.
7.
8.
9.
10.
11.
12.
13.
14.
15.
16.
Keep Learning,
Happy Trading.
Editorspick

PGEL LONGAfter a good PGEL has been consolidating for 5 Months now. It may now come out of consolidation. Check the chart for the breakout level.
Entry- 580-586
Target- 640, 660, 680
SL- 550.
Disclaimer- This is just for educational purpose only.
JAI SHREE RAM.

BSEAfter a good fall now BSE is showing some strength. It has given a breakout of a falling trendline on the daily time frame. One can look to enter here or at dips till 2280.
Stop loss 2180
Target- 2450, 2500, 2550,
Disclaimer- This is just for educational purposes.
Follow for more such learning and analysis.
Jai Shree Ram

PETRONET LONGAfter making a base and consolidating Petronet has given a breakout. One can look for entry here or at dips around 285 286 levels.
SL- 280
Target- 295, 300.
Disclaimer This is just for educational purpose.
Jai Shree ram.

ETH BIG HAMMERAfter good correction ETH has made a hammer at the previous liquidity zone (Support).
One can look for Buy on dip from here on in ETH.
SL- 4070
Target- 4300, 4370, 4400
Disclaimer- This is just for Education Purpose.
Follow for mor such content and learnings.
Jai Shree Ram.

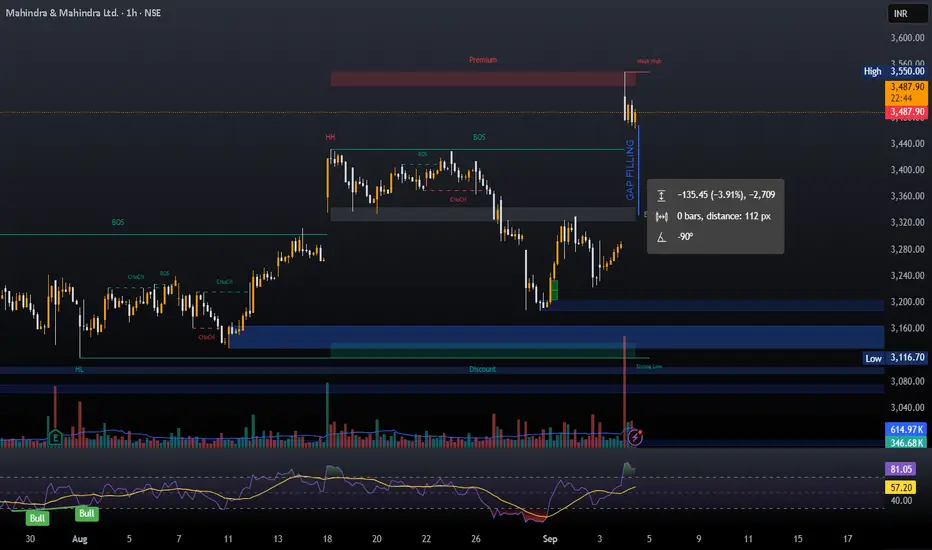
M&M ShortThe GST news has already been factored in and M&M was already trading at its al tie high. A gap up at all time high always gives an opportunity for a sell trade for the gap filling. One can look for sell in M&M with 3550 as resistance zone. Keep track of this chart and see if this concept works or not. Follow for more such concepts.
Jai Shree Ram.
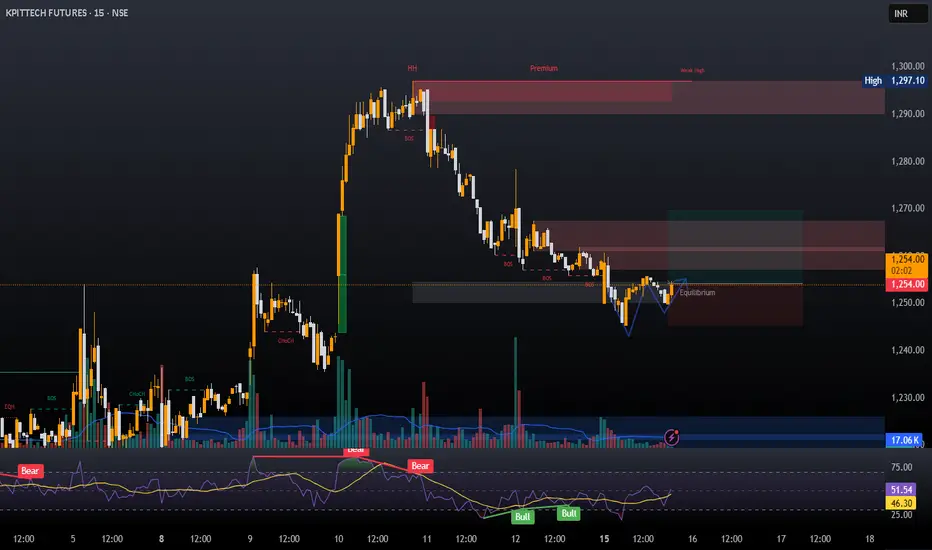
LONG IN KPITTECHA long trade can be taken in KPIT TECH. After a bullish run last week Kpit tech showed some profit booking but couldn't break the low of the candle from where it started its bullish reversal. Now it has formed a double bottom and hence a swing trade on the buy side can be taken.
Follow for more such analysis.
Entry- 1250-1254
Support- 1245-1242
Target- 1270, 1275, 1290
Disclaimer- This is just for educational purposes.
Jai Shree Ram
Dixon Inverted HnSDixon Technologies is making a inverted Head n shoulder in the daily timeframe.
One can look for taking an entry at the retest of 17300-17320. Support can be considered at todays low. Keep a Check on the Chart and you will get to see how a head n shoulder is made.
Usually the Support for a HnS is right shoulder low so mid term traders can consider that level.
Follow for such more Analysis.
Jai Shree Ram.

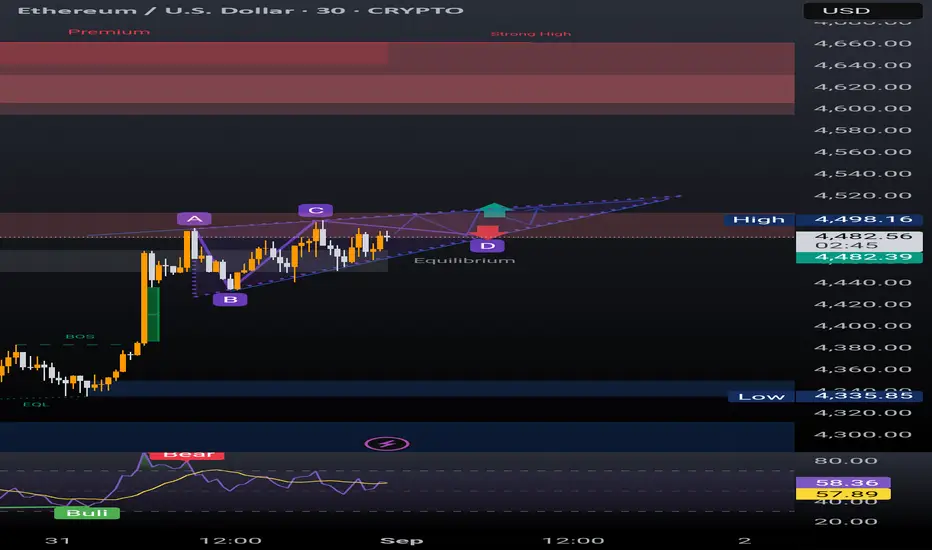
ETH Possible MoveETH currently is making a Peanut Pattern. One can also call this a Pole and Flag pattern. Hence, look for a breakout and breakdown of this pattern and keep a check on the chart.
Hope this study helps in learning and understanding chart patterns better.
Jai Shree Ram.
ETH HnSA Head N Shoulder is being made in ETH in 4hr tf. It is also break a rising trendline support.
Entry- 4395-4400
SL- 4550
Target- One can look to book after one is to one or can also target the recent low it made that is 4200.
Disclaimer- This is just for educational purpose. Please take advice before making any decision.
Jai Shree Ram.

Hammer In RelianceEntry- 1380-1378
Support- 1360
Targets- 1395, 1400
Reason- In 1hr timeframe a perfect hammer candle has been made in Reliance Industries which is an indication of a reversal in the stock. One can look for an entry here with 1360 as a SL.
Disclaimer- This is just for educational purpose.
Jai Shree Ram.

ETH BigBOEntry- 4555-4545
Targets- All time High
SL- 4465 (FIb Levels)
Reason- After a big volume candle near all time high ETH made a retracement and from here it can continue its upside journey towards all time high and 5050 Levels. Entry is being made in Fib Golden zone level which has been made in bigger tf that is daily tf and entry in taken in the shorter tf that is 1 hr tf.
Disclaimer- This is just for educational purpose.
Jai Shree Ram

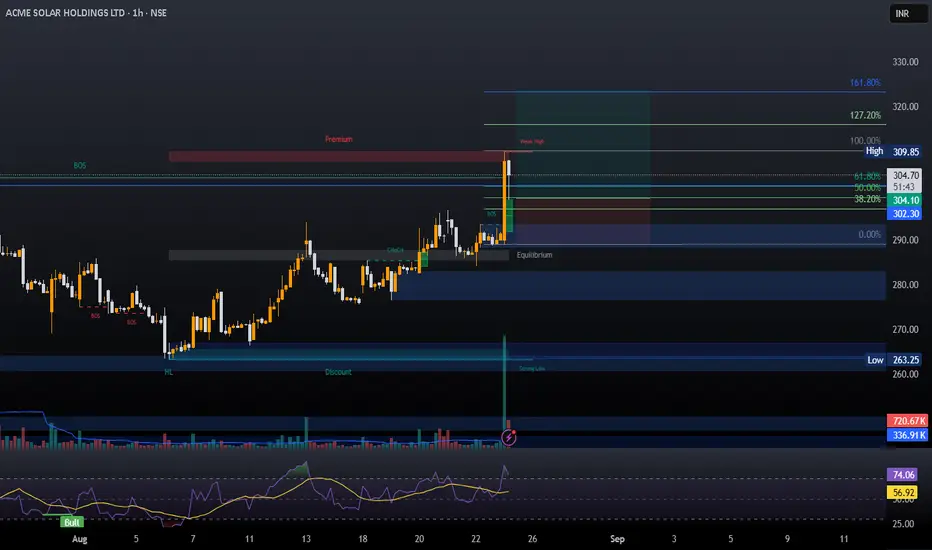
ACME SOLAR IPO BASEEntry- 300-302
Target- 315, 325, 340
Support- 285
Reason- Acme Solar has given a IPO base breakout. One can take a long here with todays low as a SL. It has given a strong closing above its IPO base high. IPO base breakout trade usually has great win ratio. One can also hold it for 25 to 30 percent returns. Keep Check.
Disclaimer- This is just for educational purpose.
Jai Shree Ram.
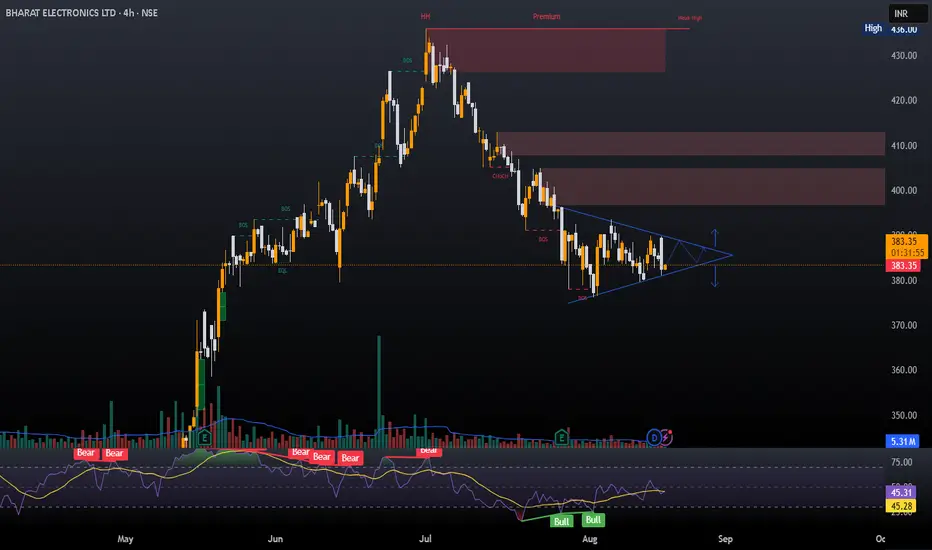
BEL Triangle PatternA long position can be taken in BEL if it breaks out this triangle pattern.
Entry- 383 - 381
Stop Loss- 377
Target- 390, 395, 400
Reason- After a good consolidation BEL has made a triangle pattern. A breakout from the pattern can give a good move.
Disclaimer- This is just for educational purpose. Please take advice before making any decision.
Jai Shree Ram.
Gold LongEntry- 3355-3352
SL- 3349
Target- 3368, 3370, 3375
Reason- Gold has broken out of a falling trendline in 1hr TF with a strong candle. News is also there that trump is not going to put tariff on gold bars.
Disclaimer- This is just for educational purposes please take advice before making any decision.
Jai Shree Ram.

GOLD LONGEntry- 101650-101600
SL- 101200
Target- 102700
Pattern- Gold is making a cup and handle pattern in 1hr TF and is also breaking out of an important resistance zone that 101550. Hence a long trade can be initiated in Gold.
Disclaimer- This is just for educational purpose please take advice before making any decision.
Jai Shree Ram.

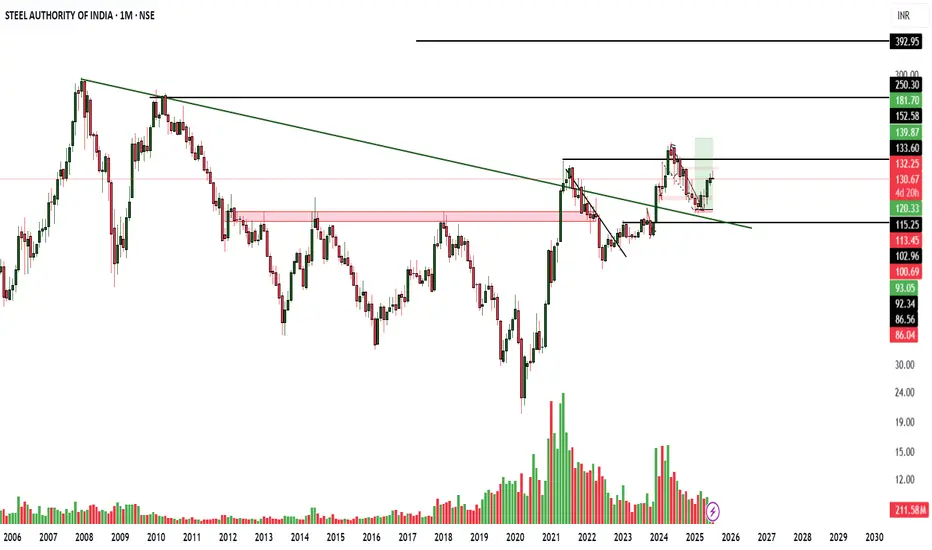
SAIL Breakout + Dividend & Earnings Alert! SAIL has climbed steadily from the ₹100–₹102 support zone and recently broke out of a falling trendline, backed by rising volume—signaling renewed bullish energy.
📈 Technical Snapshot:
Resistance: ₹132–₹133
Breakout Targets: ₹139 → ₹152 → ₹181
Potential Retrace Zone: ₹120–₹115 if it fails near resistance
💸 Dividend Alert:
SAIL typically pays regular dividends. The board recommended a final dividend in May 2025, and the ex-dividend date was around mid-September 2024. Watch the next announcement closely to avoid missing out.
📅 Upcoming Earnings / Shareholder Events:
Q1 FY2026 results are scheduled for July 25, 2025 (board meeting to approve results)
Earnings call expected on July 28, 2025, in the afternoon IST
⚙️ Trade Setup:
Entry Trigger: Break and close above ₹133.60
Stop Loss: Below ₹120
Target Zones: ₹139–₹152
Monitor: Volume trends, dividend confirmation, earnings surprises, and price reaction post-earnings
⚠️ Not financial advice—trade with your risk plan in mind.
💬 Drop your views—Buy for dividend, swing for breakout, or play safe?
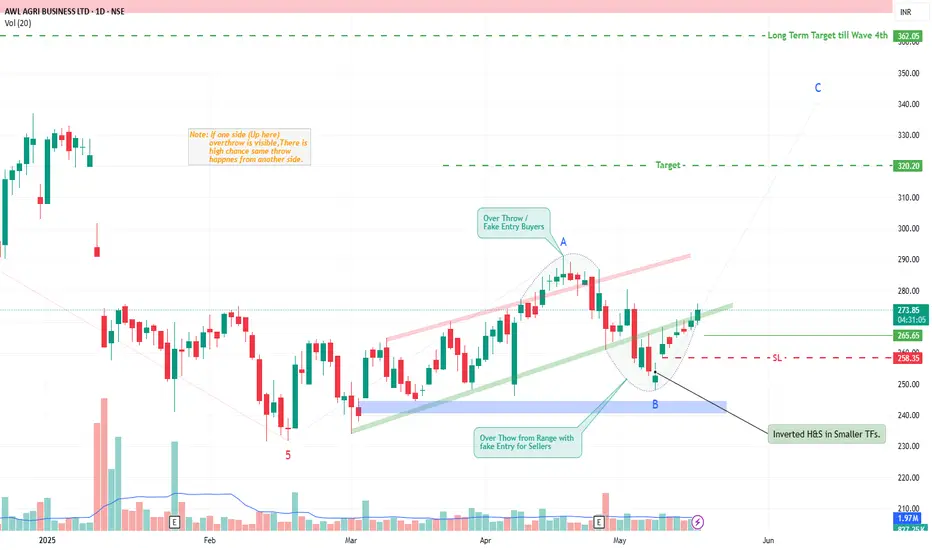
AWL Agri Business By KRS Charts 19th May 2025 / 10:42AM
Why AWL?
1. AWL was in Huge Correction mode after its first high after listed.
2. Correction path is showing clear Wave counts , finished Wave 5 downside and recently it likely in ABC Wave upside.
3. AWL was range bound for quite a time and recently shown upside overthrow (Fake Entry Buyside) from strong range and now likely same overthrow for downside also.
4. Price Action does this when some big move about to come it shakeout both Buyers & Sellers before going for final move.
5. Bullish traits like Inv. H&S and Wave counts , and Bullish Range bound is giving enough conviction to bet on this.
SL & Targets are pinned in Chart.
AWL has low P/E Ratio compared to its Industry.
Wave Count shown in Chart is rough prediction can be varied👍
Long Term Target SL will be 250 Rs.
SEQUENT SCIENTIFIC By KRS Charts8th May 2025 / 10:30 AM
Why SEQUENT SCIENTIFIC?
1. Technically it is showing Potential for movement.
2. In Past Already Got More than 50% Returns but important thing is as per Dow Theory it is making Higher Low.
3. In 1D TF multiple Breakouts with Above avg Volume is visible.
4. This is 1M Time Frame , so View is Medium to Long term.
T1 is already Achieved in Past but again after Retracement T1 & T2 will be same as before from current price.

XAU/USD - Gold about to give 20 dollars move?Key Observations:
1. Trendline Breakout:
- The price has broken above a descending trendline, signaling a potential bullish reversal.
2. Demand Zone:
- A strong supply/resistance zone is evident around $2,639–$2,644, which has acted as a base for the breakout.
3. Bullish Trade Setup:
- A long position can be taken, if the price breaks out of resistance zone and retests, targeting the following levels:
- Target 1: $2,649.53
- Target 2: $2,657.36
- Target 3: $2,664.13
- Target 4: $2,668.70
- Stop-Loss: Below $2,639.65.
4. Alternate Bearish Scenario:
- If the price re-enters below the demand zone and fails to sustain the breakout, bearish momentum could push the price toward lower levels near $2,627.50.
---
Trading Scenarios:
1. Bullish Continuation:
- If the price holds above $2,646, there is a strong likelihood of testing higher resistance levels up to **$2,668.70**.
2. Bearish Rejection:
- A move below $2,636.5 could invalidate the bullish scenario, indicating a potential retest of lower supports.
---
Always use proper risk management when executing trades.
Disclaimer:
This analysis is for informational purposes only and does not constitute financial advice. Trading involves substantial risk, and past performance is not indicative of future results. Always conduct your own research and consult a financial advisor before making investment decisions. Trade responsibly.

JIOFIN 1D TFNSE:JIOFIN has shot up from a support zone which has multiple touch points and a very strong one. The stock bounced back with a strong bullish candle. With multiple confirmations the stock could be traded.
We have discussed this more on our previous post. You can view the previous post by clicking the attachment below this post.
Disclaimer:- This analysis is only for educational purpose. Please always do your own analysis or consult with your financial advisor before taking any kind of trades

Torrent PharmaAll important points are marked.
𝐃𝐢𝐬𝐜𝐥𝐚𝐢𝐦𝐞𝐫: 𝐈𝐧𝐯𝐞𝐬𝐭𝐦𝐞𝐧𝐭 𝐢𝐧 𝐬𝐞𝐜𝐮𝐫𝐢𝐭𝐢𝐞𝐬 𝐦𝐚𝐫𝐤𝐞𝐭 𝐚𝐫𝐞 𝐬𝐮𝐛𝐣𝐞𝐜𝐭 𝐭𝐨 𝐦𝐚𝐫𝐤𝐞𝐭 𝐫𝐢𝐬𝐤𝐬, 𝐫𝐞𝐚𝐝 𝐚𝐥𝐥 𝐭𝐡𝐞 𝐫𝐞𝐥𝐚𝐭𝐞𝐝 𝐝𝐨𝐜𝐮𝐦𝐞𝐧𝐭𝐬 𝐜𝐚𝐫𝐞𝐟𝐮𝐥𝐥𝐲 𝐛𝐞𝐟𝐨𝐫𝐞 𝐢𝐧𝐯𝐞𝐬𝐭𝐢𝐧𝐠. 𝐒𝐭𝐨𝐜𝐤𝐬 𝐬𝐮𝐠𝐠𝐞𝐬𝐭𝐞𝐝 𝐢𝐧 𝐭𝐡𝐢𝐬 𝐠𝐫𝐨𝐮𝐩 𝐚𝐫𝐞 𝐟𝐨𝐫 𝐞𝐝𝐮𝐜𝐚𝐭𝐢𝐨𝐧 𝐩𝐮𝐫𝐩𝐨𝐬𝐞. 𝐖𝐞 𝐝𝐨𝐧𝐭 𝐦𝐚𝐤𝐞 𝐚𝐧𝐲 𝐩𝐫𝐨𝐟𝐢𝐭𝐬 𝐟𝐫𝐨𝐦 𝐭𝐡𝐢𝐬 𝐫𝐞𝐜𝐨𝐦𝐦𝐞𝐧𝐝𝐚𝐭𝐢𝐨𝐧𝐬 𝐞𝐯𝐞𝐫𝐲𝐭𝐡𝐢𝐧𝐠 𝐬𝐡𝐚𝐫𝐞𝐝 𝐡𝐞𝐫𝐞 𝐚𝐫𝐞 𝐜𝐨𝐦𝐩𝐥𝐞𝐭𝐞𝐥𝐲 𝐨𝐟 𝐟𝐫𝐞𝐞 𝐨𝐟 𝐜𝐨𝐬𝐭.

AJANTA PHARMA LTDBuy Ajanta above: 3351 only.
All important points are marked.
𝐃𝐢𝐬𝐜𝐥𝐚𝐢𝐦𝐞𝐫: 𝐈𝐧𝐯𝐞𝐬𝐭𝐦𝐞𝐧𝐭 𝐢𝐧 𝐬𝐞𝐜𝐮𝐫𝐢𝐭𝐢𝐞𝐬 𝐦𝐚𝐫𝐤𝐞𝐭 𝐚𝐫𝐞 𝐬𝐮𝐛𝐣𝐞𝐜𝐭 𝐭𝐨 𝐦𝐚𝐫𝐤𝐞𝐭 𝐫𝐢𝐬𝐤𝐬, 𝐫𝐞𝐚𝐝 𝐚𝐥𝐥 𝐭𝐡𝐞 𝐫𝐞𝐥𝐚𝐭𝐞𝐝 𝐝𝐨𝐜𝐮𝐦𝐞𝐧𝐭𝐬 𝐜𝐚𝐫𝐞𝐟𝐮𝐥𝐥𝐲 𝐛𝐞𝐟𝐨𝐫𝐞 𝐢𝐧𝐯𝐞𝐬𝐭𝐢𝐧𝐠. 𝐒𝐭𝐨𝐜𝐤𝐬 𝐬𝐮𝐠𝐠𝐞𝐬𝐭𝐞𝐝 𝐢𝐧 𝐭𝐡𝐢𝐬 𝐠𝐫𝐨𝐮𝐩 𝐚𝐫𝐞 𝐟𝐨𝐫 𝐞𝐝𝐮𝐜𝐚𝐭𝐢𝐨𝐧 𝐩𝐮𝐫𝐩𝐨𝐬𝐞. 𝐖𝐞 𝐝𝐨𝐧𝐭 𝐦𝐚𝐤𝐞 𝐚𝐧𝐲 𝐩𝐫𝐨𝐟𝐢𝐭𝐬 𝐟𝐫𝐨𝐦 𝐭𝐡𝐢𝐬 𝐫𝐞𝐜𝐨𝐦𝐦𝐞𝐧𝐝𝐚𝐭𝐢𝐨𝐧𝐬 𝐞𝐯𝐞𝐫𝐲𝐭𝐡𝐢𝐧𝐠 𝐬𝐡𝐚𝐫𝐞𝐝 𝐡𝐞𝐫𝐞 𝐚𝐫𝐞 𝐜𝐨𝐦𝐩𝐥𝐞𝐭𝐞𝐥𝐲 𝐨𝐟 𝐟𝐫𝐞𝐞 𝐨𝐟 𝐜𝐨𝐬𝐭.
