EID Parry - Inverted Head and Shoulder - BullishEID Parry is one of the top fundamental company in sugar industry. And EID parry is among the Murugappa group of companies. One should watch Murugappa group of companies. They are all very good.
Seeking to curb carbon emissions, India aims to increase the share of ethanol in gasoline to 20 percent by 2025-26, from 13 percent -14 percent now. Indian sugar mills such as E.I.D.-Parry Balrampur Chini Mills Shree Renuka Bajaj Hindusthan and Dwarikesh Sugar have increased their ethanol production capacity in the last few years.
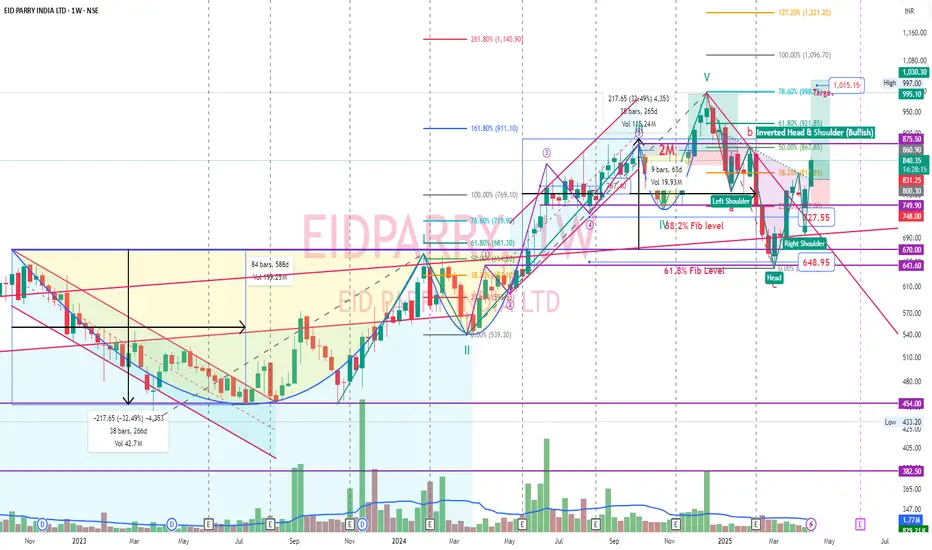
After reaching Cup & handle target, stock just completed correction cycle and now made inverted head and shoulder bullish pattern. Head height of 230 points is the target after breakout which comes around 1015 where Pivot R3 also there in daily timeframe.
Weekly RSI has made double bottom and is looking good. MaCD is on the rise. Volume was good on breakout on Apr 15 making inverted head and shoulder bullish pattern in daily timeframe.
EIDPARRY
Custom Index - Sugar - Inverted H&SMade custom index with sugar after hitting previous targets now inverted head and shoulder in progress. Holding EID parry. Ethanol blending story plays well.
India hits 20% ethanol blending milestone in early 2025—six years ahead of the original target of 2030

Mastering the Cup & Handle Pattern for Profitable BreakoutsCup & Handle Chart Pattern – A Powerful Setup for Breakouts
Hey Traders!
I hope you’re all doing great! Today, let's break down the Cup & Handle Chart Pattern —this one’s a gem for those who want to ride uptrends with confidence. If you’re looking to catch strong breakouts, this pattern will definitely help you spot them!
What is the Cup & Handle Pattern?
The Cup & Handle pattern shows up after a nice rally in price, followed by a cool-down phase where the price takes a breather and forms a rounded bottom (the cup). After that, we get a small pullback (the handle), which sets up the price for another breakout in the same direction. It’s like the market catches its breath before jumping higher again.
Key Characteristics of the Cup & Handle Pattern
Cup : The rounded bottom after a price correction. It’s where the market takes its time to consolidate before pushing up again.
Handle : A shallow pullback after the cup, just to catch a little rest before the next move up.
Breakout : The key moment when the price breaks above the neckline (the top of the cup), signaling that the uptrend is ready to continue.
Volume Confirmation : You’ll usually see volume dropping during the cup and handle formation, then a spike in volume when the breakout happens. This confirms the strength of the move.
How to Trade the Cup & Handle Pattern Like a Pro
Entry Point :
The best time to jump in is after the price breaks above the neckline (the top of the cup). For example, in EID Parry India Ltd , the entry point is at 719.20 once the breakout happens.
Stop Loss :
Keep your stop loss just below the handle’s base (around 597.45 ) to protect yourself in case the breakout fails.
Profit Target :
To set your target, measure the distance from the base of the cup to the neckline, then project that distance upwards from the breakout point. In this case, the target would be around 954.50 , which is a 46.15% potential gain.
Real-World Application: EID Parry Case Study
Looking at EID Parry India Ltd , we can see a perfect Cup & Handle setup. After a dip, the stock formed the cup, followed by the handle, and then broke out above the neckline. From here, we can calculate the target based on the cup’s height, which gives us a target of 954.50 .
Conclusion
The Cup & Handle pattern is one of the most reliable continuation setups you can find. Spotting the cup, waiting for the breakout, and using proper risk management can increase your chances of success in trending markets.
Have you traded using the Cup & Handle pattern?
Drop your thoughts in the comments below! Let’s keep learning and growing together as traders!

EID PARRY: Long Term SetupThe chart provides delineates critical price thresholds that signify breakout points, along with specific support levels that serve as indicators of where buying interest may manifest.
Additionally, the chart highlights regions likely to act as ceiling points for future price ascensions, allowing for informed decisions on entry and exit strategies.
Disclaimer: The information contained in this technical analysis report is intended solely for informational and educational purposes. It should not be interpreted as financial advice or a recommendation to buy or sell any security. Investors are strongly encouraged to conduct their own research and consult with a qualified financial advisor before making any investment decisions.

EID Parry Cup & Handle patternOne of the fundamental companies of sugar industry is eid parry. Good capital allocation. Increasing ROCE

EID Parry Fresh short targetDistilleries are going good in EID parry. Ethanol blending at 15% now. Will be 18% in FY25 and 20% in FY26. Recently parry reached in cup target. Have set new target now.

Breakout Blitz: 3 Stocks to Supercharge Your Portfolio◉ Affle (India) NSE:AFFLE
● In the midst of an upward trend, the stock previously formed a Rounding Bottom pattern, and after a breakout, the price experienced a significant surge.
● However, around the 1,715 level, the stock encountered substantial resistance, leading to a decline followed by a period of consolidation.
● Recently, another Rounding Bottom pattern has been developed, and with a recent breakthrough, the stock is now trading at an all-time high, with expectations for continued growth.
◉ KFin Technologies NSE:KFINTECH
● The stock price is evidently trending upward, characterized by a succession of higher highs and higher lows.
● After effectively breaking out of the Rounding Bottom pattern, the stock saw a significant increase, approaching its previous all-time high around the 1,190 level.
● However, it encountered substantial resistance at that point, leading to a pullback and a subsequent consolidation phase.
● Now, following a recent breakout, the stock has positioned itself above the breakout zone and is ready for a potential upward rally.
◉ EID Parry NSE:EIDPARRY
● After a period of consolidation, the stock price has developed an Inverted Head & Shoulders pattern.
● Following the breakout, the price initially climbed sharply but soon entered a significant consolidation phase, resulting in the formation of a Broadening pattern.
● Currently, the stock has achieved a breakthrough and is set to enjoy additional gains.

EID Parry Update 9 May (29 April)EID Parry’s Q4 results are not announced yet and that’s one major reason the stock hasn’t moved decisively. Once results are out of its way, it is likely to continue its journey up (unless results are too bad). Any fall towards 590-580 levels should be treated as an opportunity to accumulate.
This is not a trade recommendation. Please do your own due diligence/analysis.

EID Parry Looking GoodNSE:EIDPARRY is looking good on Daily TF, can start its new up move and Continue the Uptrend on Weekly TF.
Check out my other stock ideas below until this trade gets activated, I would love your feedback.
Disclaimer: This analysis is intended solely for informational and educational purposes and should not be interpreted as financial advice. It is advisable to consult a qualified financial advisor or conduct thorough research before making investment decisions.

DWARKESH: Sugar SectorDWARKESH is in a flag pattern on daily time frame and expecting some big moves in this at least 90-100. Enter with minimal qty.
NOTE: I'm not a SEBI REG. Study before investing. No BUY or SELL RECO.

EIDPARRY - Ichimoku Breakout📈 Stock Name - Eid Parry India Limited
🌐 Ichimoku Cloud Setup:
1️⃣ Today's close is above the Conversion Line.
2️⃣ Future Kumo is Turning Bullish.
3️⃣ Chikou span is slanting upwards.
All these parameters are shouting BULLISH at the Current Market Price and even more bullishness anticipated AFTER crossing 815.
🚨Disclaimer: This is not a Buy or Sell recommendation. It's for educational purposes and a guiding light to learn trading in the market.
#CloudTrading
#IchimokuCloud
#IchimokuFollowers
#Ichimokuexpert
Excited about this analysis? Share your thoughts in the comments below!
👍 Like, Share, and Subscribe for daily market insights! 🚀
#StockAnalysis #MarketWatch #TradingEducation #ichimoku #midcap #smallcap #EIDPARRY

Sugar index breakout 2.15YA custom index made by RENUKA, EIDPARRY, BALRAMCHIN, TRIVENI had a breakout with volume after 2.15Y. Cup & handle pattern. 22% upside potential still there.

EIDPARRY C&H BREAKOUT WCBEidparry breaking c&h pattrn #weekly
with huge volume
good rsi macd crossover
#target can be 850
only after breking 700
EDUCATIONAL IDEA

EIDPARRY - Breakout Stock EIDPARRY
Stock looks good above 670 in the midterm to long term. Keep in radar and put alert @670.
It has a potential to test 963-1000 in short term and then sky is the limit.
Risk will be last swing low in weekly TF at the time of breakout. As of now 550 will be initial risk.

EID Parry for 40% gainIn the longer time frame, the stock seems to be in Wave 5 that could lead to about 1000+ levels. The present level (620) is part of Wave III that may culminate at around 880 which is also the 1.618 fib level as seen in the chart. This doesn’t mean that the rise will be a straight line. The zigzag move may take some time but even if it takes 6 months or more to reach 880 (40% gain), the return is good. Any fall towards 590 levels should be an opportunity to add. This is not a recommendation to trade. Please do your own due diligence.

EIDPARYY- unrestricted-volume-growth-3-months-time-frame-veritasEIDPARYY- unrestricted-volume-growth-3-months-time-frame-veritas
But used Past months or 45 days back to see, stock thath touched 144 or its low below it ND THn recovered from there or recover after spending time there.
Quick gains can be made of about 50 %
1) Ema supprt
2) volume positive
3) 50 % target

EIDPARRY BREAKING A TRENDLINEEIDPARRY breaking a trendline resistance
with huge volume
breaking 200ema also
first #target can be 575
educational idea only

EIDPARRY | Swing Trade📊 Details
EID Parry is engaged in Sugar, Nutraceuticals and ethanol production. It also has a significant presence in the Farm Inputs business including Bio pesticides through its subsidiary, Coromandel International Limited.
Disclaimer: This analysis is solely for educational purposes and does not make me a SEBI registered analyst.
If you found this analysis helpful, I encourage you to like and share it. Your observations and comments are also welcomed below. Your support, likes, follows, and comments motivate me to consistently share valuable insights with you.
🔍 More Analysis & Trade Setups 🔍
For more technical analysis and trade setups, make sure to follow me on TradingView: www.tradingview.com

EIDPARRY: 6 Month Cup breakoutEIDPARRY has broken out of a 6 month long cup and given breakout. High volumes and RSI for last few days. The breakout is holding for last few days, but needs to sustain well to keep going higher.

EIDPARRYEIDPARRY:- Rounding bottom pattern is formed, wait for breakout, till then keep an eye on the stock
Hello traders,
As always, simple and neat charts so everyone can understand and not make it too complicated.
rest details mentioned in the chart.
will be posting more such ideas like this. Until that, like share and follow :)
check my other ideas to get to know about all the successful trades based on price action.
Thanks,
Ajay.
keep learning and keep earning.

EID Parry: Symmetrical Triangle Pattern formationNSE:EIDPARRY has a clear, copy-book symmetrical triangle / pennant pattern formation.
Trade: Buy above 640, SL: 610, T: 660/680/700

EIDPARRY - Ichimoku Bullish Breakout Stock Name - Eid Parry India Limited
Ichimoku Cloud Setup :
1). Today's close is above the Conversion Line
2). Future Kumo is Turning Bullish
3). Chikou span is slanting upwards
All these parameters are showing bullishness at Current Market Price
and more bullishness AFTER crossing 640
#This is not Buy and Sell recommendation to any one. This is for education purpose and a helping hand to learn trading in Market.
# Cloud Trading
# Ichimoku Cloud
# Ichimoku Followers
I hope you all like my analysis.
Please do share your thoughts into comment section.
Please give a like, it motivates me to do analysis.

Breakout in E.I.D-Parry...Chart is self explanatory. Entry, Targets and Stop Loss are mentioned on the chart.
Disclaimer: This is for demonstration and educational purpose only.
