ELECTCAST : Swing Trade#ELECTCAST #ThreeWhiteSoldiers #fairvaluegap #stage1breakout #breakoutstock #Trendingstock
ELECTCAST : Swing Trade
>> Low PE Stock
>> Stage 1 Breakout & Retest done
>> TWS & FVG Visble
>> Liquidity Sweep Visible
>> Volumes Dried up
>> Stock gaining strength
Swing Traders can lock profit at 10% and keep Trailing
Please Boost, comment and follow us for more Learnings.
Note : Markets are still Tricky and can go either ways so don't be over aggressive while choosing & planning your Trades, Calculate your Position sizing as per the Risk Reward you see and most importantly don't go all in
Disc : Charts shared are for learning purpose only, not a Trade recommendation. Do your own research and consult your financial advisor before taking any position.
ELECTCAST

Electrosteel Castings: at Base Breakout levels.Electrosteel Castings: at Base Breakout levels. CMP 132.
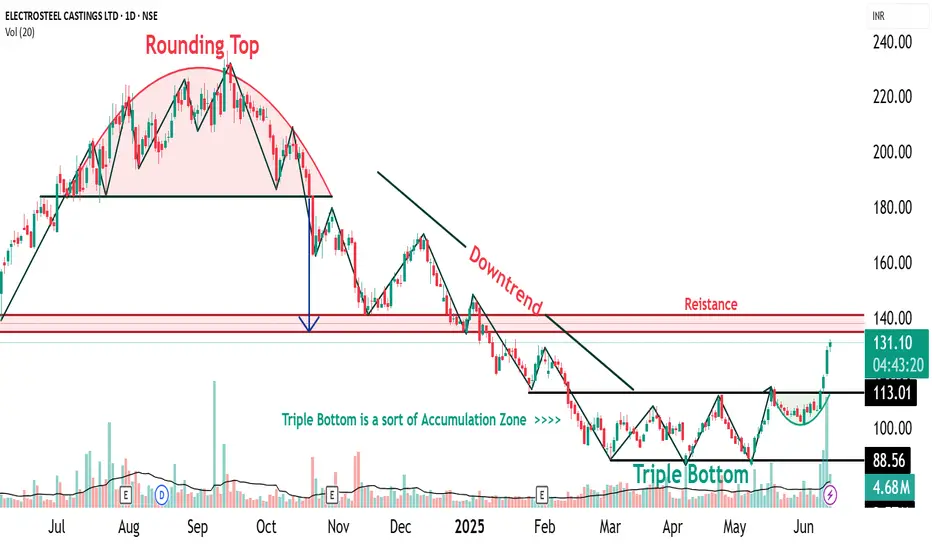
Resistance marked on charts.

ELECTCAST Triple Bottom Pattern🔍 1. Understanding the Triple Bottom
The Triple Bottom is a classic bullish reversal pattern that typically forms after a prolonged downtrend or consolidation phase. It signifies strong buying interest at a consistent support level, leading to three distinct price lows (or “bottoms”) occurring near the same price zone.
📌 Key Characteristics:
Formation Time: Typically spans 2–6 months
Touchpoints: Three distinct lows formed at or near the same support level
Pattern Zone (for ELECTCAST): ₹87 – ₹88
Trade Entry: Entry is typically considered on a breakout above the neckline, which is the horizontal resistance connecting the interim highs between the bottoms. In this case, a breakout confirmation would be around ₹96.
Stop Loss (SL): Just below the third bottom, e.g., ₹85
Target: Based on pattern depth projection, conservative ₹104, aggressive potential up to ₹120–₹140, once momentum sustains
📉 2. Triple Bottom Formed at ₹87–₹88 Zone
Electrosteel Castings has tested the ₹87–₹88 level three times, showing that this price zone has acted as a strong accumulation support. The repeated defense of this level suggests significant buying interest by institutional players or informed investors.
1st Bottom: Initial rejection near ₹88
2nd Bottom: Retest with similar rejection zone
3rd Bottom: Confluence with bullish reversal candlestick (Morning Star)
The pattern is visually symmetric and clean, enhancing its reliability.
At the third bottom near ₹87, a Morning Star was observed, marking the first visual confirmation of bullish reversal. This adds significant strength to the pattern because the third bottom often acts as a psychological pivot point, triggering buying from traders watching for a reversal.
📈 3. Higher Top – Higher Bottom Structure Emerging
Following the Morning Star, the stock has started forming a higher bottom and higher top structure—a fundamental trait of an uptrend. However:
🟡 Caution: One more higher bottom formation is required to confirm the start of a sustainable uptrend.
Once the uptrend is firmly established, a close above ₹140 will act as a major breakout signal, potentially propelling the price toward new 52-week highs or an all-time peak.
🧠 4. Accumulation Zone and Triple Bottom – The Relationship
An Accumulation Zone is a price range where informed investors quietly accumulate shares over a period, usually when a stock is undervalued or consolidating.
🔗 Connection to Triple Bottom:
The Triple Bottom pattern often forms within the Accumulation Zone
Each dip to the support level attracts buyers, revealing hidden demand
The formation acts as a transition from accumulation to markup phase
The breakout from the Triple Bottom signals the end of accumulation and the start of an uptrend
Hence, the Triple Bottom is not just a technical pattern, but a visual representation of accumulation dynamics playing out.
📝 Disclaimer
This report is intended purely for educational and training purposes. It is not a recommendation to buy or sell securities. Always conduct your own research or consult a certified financial advisor before making trading decisions.
ELECTCAST pattern looks like a "Cup and Handle" formation.1. **Cup and Handle Pattern**:
- The pattern looks like a "Cup and Handle" formation. The cup is the rounded bottom, and the handle is the slight consolidation or pullback after the cup's high point. This is generally a bullish continuation pattern.
- The breakout from the handle typically signals a bullish move.
2. **Trend Channel**:
- The price is moving within an upward sloping channel, with the upper and lower bounds of the channel being parallel.
- The current price is near the upper resistance of this channel, indicating that if the price breaks out, it might see a strong upward movement.
3. **Price Target**:
- Based on the height of the cup, the projected price target after a breakout appears to be around ₹275, which is a 31% increase from the current level of ₹210.
- This target is drawn vertically from the breakout point of the handle to the top of the potential move.
4. **Volume**:
- There seems to be a slight increase in volume as the price moved up, supporting the bullish sentiment. However, the recent drop in volume could indicate a consolidation phase before the next big move.
- The highest volume bar appears to correspond to a significant upward move, which is a positive sign.
5. **RSI**:
- The RSI (Relative Strength Index) is around 57.75, which is in the neutral zone but slightly leaning towards the bullish side.
- It’s not overbought or oversold, indicating that there might still be room for the price to move up.
### Conclusion:
The chart suggests a potential bullish breakout from the cup and handle pattern, with a price target of around ₹275. However, the price is currently at the upper boundary of the trend channel, so it's crucial to watch for a confirmed breakout with increased volume. If the breakout occurs, the price could move towards the target, but if the resistance holds, there might be a pullback.

Electrosteel Castings another water theme related stockElectrosteel Castings (Electcast)
-from Strong Sector
-Clean setup
-Vol kickin in, clearly Grenn vol > Red vol
-Signal candle
-Good shakeout

ELECTCAST : Electrosteel Castings LtdElectrosteel Castings Ltd
CMP : 60.60
1) Stock has broken out above crucial resistance zone and multi year highs
2) Price is consolidating since the last two months between the range of 55 to 65
3) A move above 65 - should generate strong momentum in share prices towards 95 and 105 levels
4) Overall long term structure is very pullish and stock should find support on pull-back between 59 to 61 zone
5) Weakness would extend its phase only below 53
Interesting Set-Up

Electrosteel Castings Ltd - Cup and Handle formation .Electrosteel Castings is a pipeline solution provider engaged in the business of manufacturing ductile iron pipes , ductile iron fittings & cast iron pipes which have plants in Tamilnadu and Westbengal . Stock is a slow mover . Now its almost around 10 year high .Strong fixed asset valuation . Volume shocker with highest recovery from 52 week low. Debtor days are improving . A cup and handle formation is seen in the chart .Expecting the 100 levels soon .

multibagger oppurtunity in ELECTCAST ?stock consolidating from 2007 in the range of about 10 to 50.Nowdays stock trading in between 50 to 65.If stock broke 65 and trading above it for long time then stock will give good return in long term.Wait for monthly closing of this stock.You can also take short term trade or intra-day trade above 63 rs in this stock...Target will updated soon...
Caution:some time these chart patterns fail...trade with stop loss
Follow us on TradingView
we are not sebi registered.....post for educational purpose...

ELECTROSTEEL CASTINGS - 110% RETURNS!!!BUY - ELECTROSTEEL CASTINGS LTD
CMP - Rs. 45
Target - 1: Rs. 63
Target - 2: Rs. 78
Target - 4: Rs. 95
.
.
Technicals - Cup and Handle Pattern BO
.
This is just a view by an expert analyst, please invest at your own risk.
.
Follow me for more!

Breakout in Electrosteel Castings...Chart is self explanatory. Entry, Targets and Stop Loss are mentioned on the chart.
Disclaimer: This is for demonstration and educational purpose only. This is not buying or selling recommendations. I am not SEBI registered. Please consult your financial advisor before taking any trade.
