Sun Pharma: A Bullish OutlookHello Friends,
Welcome to RK_Chaarts,
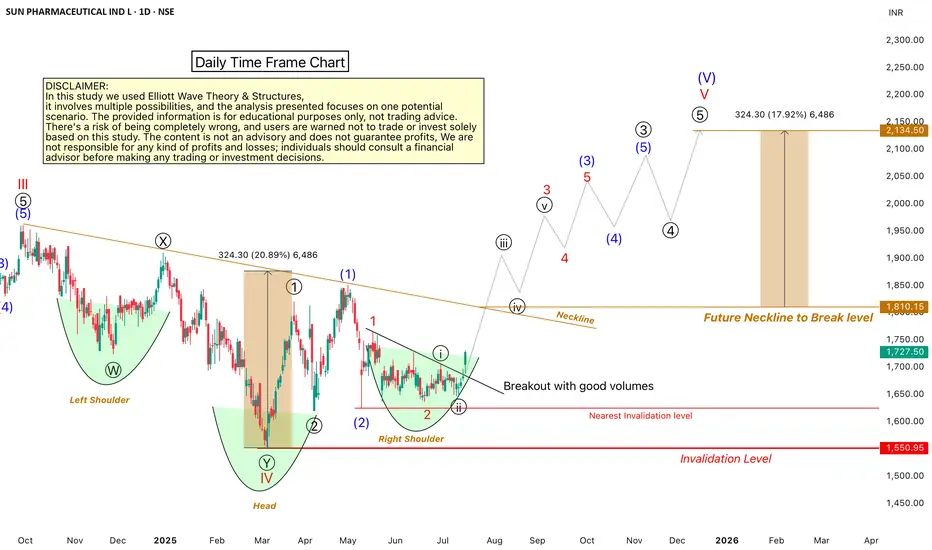
Let's analyze the Sun Pharmaceuticals chart using technical analysis, specifically the Elliott Wave Theory. According to this theory, the September 2024 top marked the end of Wave III cycle degree in red, and the March 2025 bottom marked the end of Wave IV cycle degree in red Now, Wave V of cycle degree in red has begun, which will move upward.
Within Wave V, we should have five sub-divisions of Primary degree in black, with Wave ((1)) & Wave ((2)) already completed. Wave ((3)) has started, with five further sub-divisions of one lower degree intermediate degree, We've marked these in blue, with Wave (1) and Wave (2) completed, and Wave (3) started. Within Wave (3), we have minor degree waves in red, with Wave 1 and Wave 2 completed, and Wave 3 breaking out today with good intensity of volumes.
We can see that the wave counts are super bullish, and so is the RSI, which is above 60. The MACD is also positive, and the price is above the 50-day and 200-day EMAs on the daily and weekly time frames. There's no moving average hurdle, which is another super bullish sign.
We can also see a higher high and higher low formation, which is a bullish sign according to Dow Theory. Additionally, an inverted head and shoulders pattern is forming, with the right shoulder being made. When it breaks out above the neckline, it will give us a target, which aligns with the Elliott Wave Target projection.
All these indicators – technical analysis, price action, and Elliott Wave – point to a bullish trend. However, there's an invalidation level at 1550; if the price falls below this level, our wave counts will be invalidated.
We're projecting targets between 2000-2200 based on Elliott Wave theory projections. Please note that this analysis is for educational purposes only and should not be considered as investment advice.
This post is shared purely for educational purpose & it’s Not a trading advice.
I am not Sebi registered analyst.
My studies are for educational purpose only.
Please Consult your financial advisor before trading or investing.
I am not responsible for any kinds of your profits and your losses.
Most investors treat trading as a hobby because they have a full-time job doing something else.
However, If you treat trading like a business, it will pay you like a business.
If you treat like a hobby, hobbies don't pay, they cost you...!
Hope this post is helpful to community
Thanks
RK💕
Disclaimer and Risk Warning.
The analysis and discussion provided on in.tradingview.com is intended for educational purposes only and should not be relied upon for trading decisions. RK_Chaarts is not an investment adviser and the information provided here should not be taken as professional investment advice. Before buying or selling any investments, securities, or precious metals, it is recommended that you conduct your own due diligence. RK_Chaarts does not share in your profits and will not take responsibility for any losses you may incur. So Please Consult your financial advisor before trading or investing.
Elliottwavecounts
Apollo Tyres: Navigating the WavesWelcome to RK_Chaarts.
Today, we're analysing the daily time frame chart of Apollo Tyres from Elliott waves perspective. Here, we can clearly see that the intermediate-degree Wave (3) (blue) formed a high around ₹555 in February 2024. After that, an A-B-C corrective pattern unfolded in a 3-3-5 expanded flat structure, which is Wave (4) blue intermediate-degree. We can say that Wave (4) possibly ended at the March 2025 low around ₹370.
Now, we're possibly unfolding Wave (5) in blue of the intermediate degree, which will have five sub-divisions: of minor-degree Waves 1-5 (red). Possibly, Wave 1 (red) has ended, and Wave 2 (red) is currently unfolding. After Wave 2 ends, the price may reverse upwards, forming Wave 3, followed by Wave 4's retracement and then Wave 5's high.
Where can be next possible reversal
On the weekly timeframe, the price is moving within the upper Bollinger Band zone. The weekly 20-Weekly simple moving average (or 20-week simple moving average), which is the mid-Bollinger Band, is around ₹440-₹437. It's possible that Wave 2 will find support around this level and then reverse upward.
Invalidation level
Note that Wave 2 cannot retreat more than 100% of Wave 1, according to wave theory principles. The low of ₹371, where Wave 1 began, is the invalidation level. If the price breaks below this level, it may trigger an invalidation, and we might be looking at a double correction or a double three structure instead.
Projected Targets
However, if the invalidation level holds, the upward movement will likely continue. The projected target for Wave 5 could be around ₹555-₹603, based on the ratio analysis of Waves (3) and (4).
Important Notes
- Breaking below the invalidation level would require re-evaluation of the wave count.
- Sustaining above the invalidation level increases confidence in the projected target.
Let's see how the market unfolds. This entire study is shared solely for educational purposes. Thank you so much.
I am not Sebi registered analyst.
My studies are for educational purpose only.
Please Consult your financial advisor before trading or investing.
I am not responsible for any kinds of your profits and your losses.
Most investors treat trading as a hobby because they have a full-time job doing something else.
However, If you treat trading like a business, it will pay you like a business.
If you treat like a hobby, hobbies don't pay, they cost you...!
Hope this post is helpful to community
Thanks
RK💕
Disclaimer and Risk Warning.
The analysis and discussion provided on in.tradingview.com is intended for educational purposes only and should not be relied upon for trading decisions. RK_Chaarts is not an investment adviser and the information provided here should not be taken as professional investment advice. Before buying or selling any investments, securities, or precious metals, it is recommended that you conduct your own due diligence. RK_Chaarts does not share in your profits and will not take responsibility for any losses you may incur. So Please Consult your financial advisor before trading or investing.

Possible Wave counts of TSLA Hourly & DailyDaily Time Frame Chart
I am not Sebi registered analyst.
My studies are for educational purpose only.
Please Consult your financial advisor before trading or investing.
I am not responsible for any kinds of your profits and your losses.
Most investors treat trading as a hobby because they have a full-time job doing something else.
However, If you treat trading like a business, it will pay you like a business.
If you treat like a hobby, hobbies don't pay, they cost you...!
Hope this post is helpful to community
Thanks
RK💕
Disclaimer and Risk Warning.
The analysis and discussion provided on in.tradingview.com/u/RK_Charts/ is intended for educational purposes only and should not be relied upon for trading decisions. RK_Charts is not an investment adviser and the information provided here should not be taken as professional investment advice. Before buying or selling any investments, securities, or precious metals, it is recommended that you conduct your own due diligence. RK_Charts does not share in your profits and will not take responsibility for any losses you may incur. So Please Consult your financial advisor before trading or investing.

Technical Analysis - Elliott Waves of SBINThis analysis is based on Elliott Wave theory and is for educational purposes only. It does not constitute financial advice.
Key Observations:
Ascending Diagonal Triangle: The price action appears to be forming an ascending diagonal triangle pattern, suggesting a potential bullish breakout.
Wave Structure: The current price movement could be interpreted as an impulse wave, with a strong possibility of a fifth wave extension.
Invalidation Level: The 732.00 level acts as a critical invalidation point. A break below this level would negate the bullish outlook.
Potential Target: A breakout above the triangle's upper boundary could lead to a significant price increase, with a potential projection around the 920.00 level and more
Overall Outlook:
The technical analysis based on Elliott Waves suggests a bullish bias for SBIN. However, it's essential to monitor the price action closely and be prepared to adjust the analysis if the market's behaviour deviates from the expected pattern.
I am not Sebi registered analyst.
My studies are for educational purpose only.
Please Consult your financial advisor before trading or investing.
I am not responsible for any kinds of your profits and your losses.
Most investors treat trading as a hobby because they have a full-time job doing something else. However, If you treat trading like a business, it will pay you like a business.
If you treat like a hobby, hobbies don't pay, they cost you...!
Hope this post is helpful to community
Thanks
RK
Disclaimer and Risk Warning.
The analysis and discussion provided on in.tradingview.com/u/RK_Charts/ is intended for educational purposes only and should not be relied upon for trading decisions. RK_Charts is not an investment adviser and the information provided here should not be taken as professional investment advice. Before buying or selling any investments, securities, or precious metals, it is recommended that you conduct your own due diligence. RK_Charts does not share in your profits and will not take responsibility for any losses you may incur. So Please Consult your financial advisor before trading or investing.

Comprehensive Analysis of Reliance Power Limited (RPOWER)Overview:
Reliance Power Limited (RPOWER) has recently exhibited significant price action, forming a cup and handle chart pattern, which typically signifies a substantial bullish trend. Coupled with strong volume and positive indicators across multiple timeframes, the stock presents a compelling opportunity for investors.
Cup and Handle Pattern:
The cup and handle pattern on RPOWER's chart has matured over a span of more than 5 years, indicating a long-term bullish setup.
A breakout from this pattern occurred recently, accompanied by substantial trading volumes, signaling strong buying interest.
Elliott Wave Analysis:
Elliott wave analysis suggests that the stock is potentially entering the 3rd wave of the 3rd wave, implying a powerful bullish move.
This wave analysis further supports the bullish bias observed in the cup and handle pattern.
Technical Indicators:
Volume Confirmation: The retracement following the breakout maintained higher lows, with the cumulative volume of 10 candles lower than that of the breakout candle, indicating sustained buying pressure.
Bollinger Bands: RPOWER is challenging the upper Bollinger Band on both daily and weekly timeframes, suggesting strong upward momentum.
Trend Indicators: Positive crossovers on trend indicators across multiple timeframes signal a bullish trend.
RSI and ADX: RSI supports the bullish bias, and ADX indicates increasing strength in the uptrend, with +DI confirming a bullish trend.
Trade Strategy:
Entry Points: Consider initiating long positions at current levels or on pullbacks, with potential entry points around the upper bands of the cup and handle pattern.
Invalidation Level: Set the invalidation level below the last swing low, providing a clear risk management strategy.
Price Targets: Upside price targets based on the cup and handle pattern suggest levels of 49+, 73+, and 99+ for Long Terms.
Risk Management: Emphasize the importance of risk management techniques, including stop-loss orders and position sizing, to mitigate potential losses.
Conclusion:
Reliance Power Limited (RPOWER) exhibits a strong bullish setup, characterized by the cup and handle pattern, supported by volume analysis, Elliott wave analysis, and positive technical indicators across multiple timeframes. However, investors should conduct their own research and exercise caution, adhering to risk management principles. This analysis is for educational purposes only and does not constitute financial advice or trading recommendations.
Disclaimer: This study is shared for educational purposes only and should not be construed as investment advice or trading tips. Investors should perform their own analysis and consult with financial professionals before making investment decisions.
I am not sebi registered analyst. My studies are for educational purpose only. Please Consult your financial advisor before trading or investing. I am not responsible for any kinds of your profits and your losses.
Most investors treat trading as a hobby because they have a full-time job doing something else.
However, If you treat trading like a business, it will pay you like a business.
If you treat like a hobby, hobbies don't pay, they cost you...!
Hope this post is helpful to community
Thanks
RK💕
Disclaimer and Risk Warning.
The analysis and discussion provided on in.tradingview.com is intended for educational purposes only and should not be relied upon for trading decisions. RK_Charts is not an investment adviser and the information provided here should not be taken as professional investment advice. Before buying or selling any investments, securities, or precious metals, it is recommended that you conduct your own due diligence. RK_Charts does not share in your profits and will not take responsibility for any losses you may incur. So Please Consult your financial advisor before trading or investing.

Elliott Waves and Beyond Decoding DCM Nouvelle Ltd.DCM Nouvelle Limited Overview
Company Background
DCM Nouvelle Limited is an India-based company operating primarily in the textile sector. The company is engaged in the manufacturing and sale of cotton yarn, operating within the Textile segment. DCM Nouvelle stands out as a manufacturer and exporter specializing in cotton carded and combed yarns, offered in both single and two-ply forms.(source Google)
Technical Analysis Highlights
Triangle Breakout with Volumes
There is a triangle breakout with a strong surge in trading volumes, suggesting a potential shift in market sentiment and increased buying interest.
Bullish Divergence and U-Turn
The price, along with technical indicators, has exhibited a bullish divergence, signaling a reversal in the trend. The market has made a U-turn, moving from a bearish to a bullish trajectory.
Elliott Wave Structure
The Elliott Wave analysis suggests that the stock has completed wave (1) and wave (2) on the weekly chart. Currently, it appears to be unfolding wave (3), which has the potential to reach 161.8% of the length of wave (1) from the low of wave (2).
Wave (3) Subdivisions
Within wave (3), there are likely five subdivisions. The analysis indicates that wave (i) within wave 1 has been completed, suggesting further upward movement.
Third Wave in Elliott Waves
The third wave in Elliott Wave theory is often the most powerful and extended wave. It is the primary driving force in a trending market, characterized by strong and sustained price movement in the direction of the overall trend. Traders and investors often look for opportunities to capitalize on the significant price gains associated with the third wave.
Invalidation and Potential Risks:
Invalidation Level
There is an identified invalidation level at 129, which is the low of wave (2). If the price falls below this level, it may indicate a deviation from the expected Elliott Wave pattern.
Assumption Risks
It's crucial to acknowledge that all technical analyses involve a degree of uncertainty. Assumptions may go wrong, and unexpected market developments can lead to different outcomes. In this case, the analysis is based on Elliott Wave principles, and deviations from these patterns are not uncommon.
Disclaimer:
Risk Warning
Trading and investing in financial markets involve risk. Past performance is not indicative of future results. The analysis provided is for informational purposes only and should not be considered as financial advice.
Market Volatility
Markets can be unpredictable, and conditions may change rapidly. Investors should conduct their own research and consider consulting with a financial advisor before making any investment decisions.
Elliott Wave Disclaimer
Elliott Wave analysis is a subjective tool that relies on the interpretation of patterns. The market may not always conform to these patterns, and outcomes may vary.
I am not Sebi registered analyst. My studies are for educational purpose only.
Please Consult your financial advisor before trading or investing. I am not responsible for any kinds of your profits and your losses.
Most investors treat trading as a hobby because they have a full-time job doing something else.
However, If you treat trading like a business, it will pay you like a business.
If you treat like a hobby, hobbies don't pay, they cost you...!
Hope this post is helpful to community
Thanks
RK💕
Disclaimer and Risk Warning.
The analysis and discussion provided on in.tradingview.com is intended for educational purposes only and should not be relied upon for trading decisions. RK_Charts is not an investment adviser and the information provided here should not be taken as professional investment advice. Before buying or selling any investments, securities, or precious metals, it is recommended that you conduct your own due diligence. RK_Charts does not share in your profits and will not take responsibility for any losses you may incur. So Please Consult your financial advisor before trading or investing.
Triangle Breakout with Good intensity of volumes
Price with indicator got bullish divergence and got U turned
Elliott wave structure on daily chart
Possible Elliott wave structure on weekly chart
Having potential of being 2x
