Gold Forecast Weekly (Updated)Hallo investors / traders gold trend bullish now may be this Extended wave 13th wave competed possible at April 6-10 in 2026 Price reaching 5150 - 5450 level so go long as now best buy at 4100-4050 level risk reward is good 1:3 Happy Trading Journey
Elliotwaveanalysis

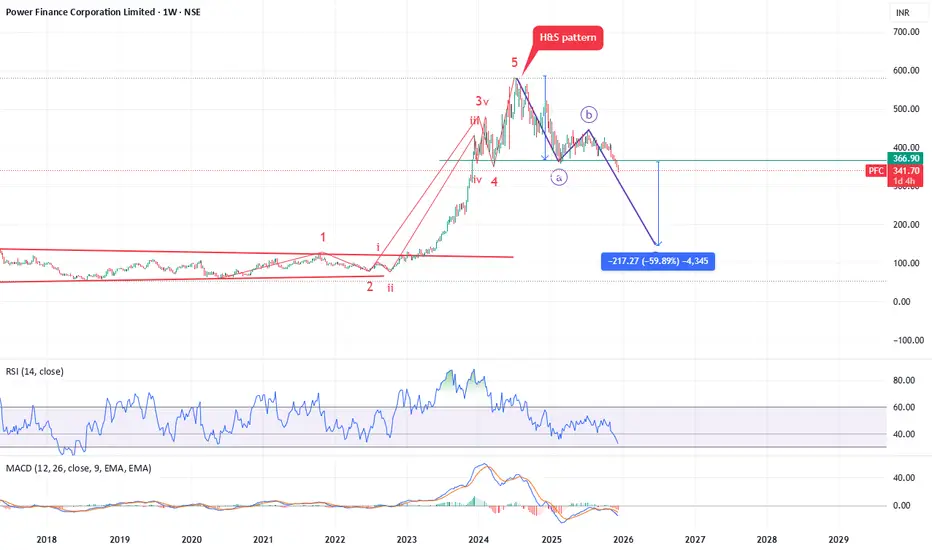
Elliott Wave Interpretation of PFC chart.Elliott Wave Interpretation of PFC chart.
Your chart shows a full 5-wave impulse completed on the weekly timeframe:
Wave 1 → 2 → 3 → 4 → 5 completed around mid-2024
Wave 5 shows exhaustion + RSI divergence → confirms top
A Head & Shoulders pattern formed near the Wave 5 top
After completion of the impulse, market entered a corrective ABC phase
Probability of ABC returning to Wave 1 region
✔ Because the prior 5 waves were extremely extended,
✔ and because the top created a Head & Shoulders reversal
Tentative Target for the ABC Pattern (Wave C Target)
🎯 ₹130 – ₹160 (High probability)
🎯 ₹100 – ₹130 (If selling accelerates)
2008 Nifty 50 Crash - Analysis2008 Nifty 50 Crash Around 65% of 0 level complete study analysis of corrective wave pattern (Running Flat)

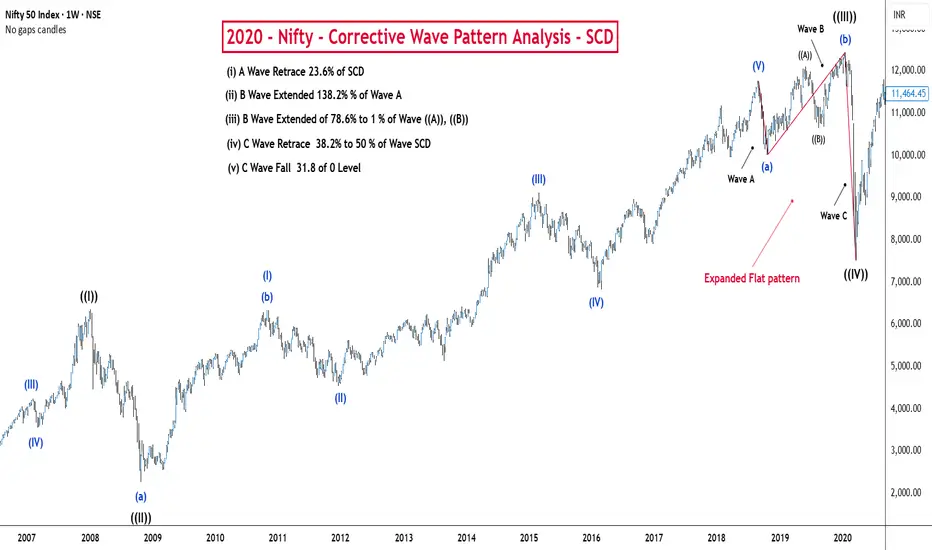
2020 Nifty Correction Analysis 2020 Corona Period Nifty 50 Fall at 38.2% of 0 level complete study analysis of corrective wave pattern (Expanded Flat)
Nifty 50 Index Elliot Wave Analysis monthly TFNifty 50 Now in correction face of Grand super cycle . Already Wave A and B Completed. C wave starts now (forming Expanded / Irregular Flat) end up to Minimum Fib Retrace 38.2% to 50% level so expected for correction in nifty 50 through Elliott wave theory so investors proper hedge your position and big buying opportunity is coming soon...

Nifty 1H Elliott Wave Analysis Nifty 1H trend is Bearish - Ending Diagonal 5 Waves Completed and break channel pattern then C wave grand super cycle degree is started now c1,c2 in completed (cycle degree) c3 running expected target 1.618 to 2.618 of Fib level So correction is going don't go long protect your position in proper hedging or go short

PAYTM (One 97 Communications Ltd.) – Technical Outlook & LevelsPAYTM is currently trading near ₹1,344 and remains in a strong upward Elliott Wave structure.
A clean breakout above ₹1,380–1,400 may trigger Wave-3 momentum toward ₹1,850–₹2,000.
Supports at ₹1,300 and ₹1,225 remain crucial for trend continuation, while ₹1,250 acts as an ideal stop-loss for swing setups. Long-term Wave-5 projections suggest a potential move toward ₹2,150–₹2,250.
🎯 Future Target Levels
🔹 Swing Trading Targets
• Target 1: ₹1,420 – ₹1,450
• Target 2: ₹1,550 – ₹1,600
🔹 Position Trading Targets
• Wave 3 Target Zone:
👉 ₹1,850 – ₹2,000 (Fib 1.618–2.0 extension)
• Wave 5 Extended Target:
👉 ₹2,150 – ₹2,250 (Post Wave-4 completion)
🛑 Key Support Levels
• Major Support: ₹1,300
• Intermediate Support: ₹1,225
• Structural Support: ₹1,100 (previous swing-low zone)
📌 Resistance Levels
• Immediate Resistance: ₹1,380
• Next Resistance: ₹1,450
• Major Resistance Zone: ₹1,550 – ₹1,600 (Breakout above this zone can accelerate the Wave-3 rally)
🔐 Stop-Loss Recommendations
Swing Trades
• SL: ₹1,250 (below trendline & previous corrective low)
Positional Trades
• SL: ₹1,180 (below Wave-2 base level)
📌 Thanks a ton for checking out my idea! Hope it sparked some value for you.
🙏 Follow for more insights
👍 Boost if you found it helpful
✍️ Drop a comment with your thoughts below!

USDJPY Breakdown Begins:Elliott Wave Points to Deeper CorrectionThe USDJPY 4H chart shows a completed five-wave impulsive structure, ending at the recent high marked as wave (5). After finishing this full wave cycle, the price has started to break down from the rising wedge pattern, which is a common sign of a trend reversal. The corrective structure from the top suggests the beginning of a larger A-B-C decline, targeting lower levels in the coming sessions. As long as price stays below the invalidation level near 157.68, the bearish outlook remains valid. This setup indicates that USDJPY has likely completed its bullish phase and is now preparing for a deeper corrective move downward.
Stay tuned!
@Money_Dictators
Thank you :)

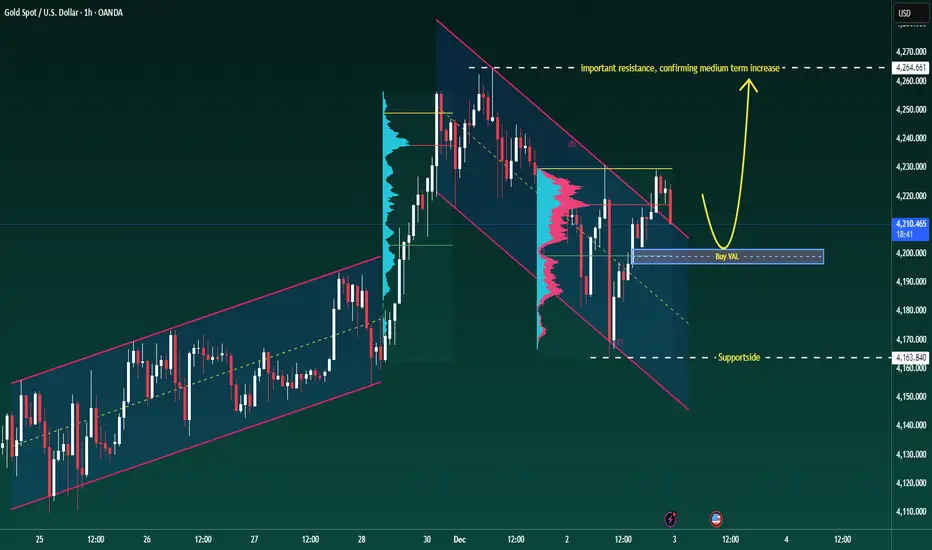
XAUUSD–Volume Profile buy scenario around 4,200, target 4,265+XAUUSD–Volume Profile buy scenario around 4,200, target 4,265+
Brian – Prioritize buying with the trend, use VAL to position entry
Market snapshot
At the end of the US session yesterday, gold had a strong increase and then stabilized, currently moving sideways around 4,216 on H1.
The structure is still an uptrend, the current decline is mainly a technical correction within the value area.
On the chart, the 4,264–4,265 area is marked as important resistance, where if broken, the medium-term uptrend could be unleashed more strongly.
Volume Profile & key price areas
The VAL (Value Area Low) of the Volume Profile is currently around 4,200 – this is an area where the market has previously accepted a large volume of trades, suitable for trend-following buys.
A deeper support area is around 4,164 (Supportsides on the chart), where buyers have previously intervened very clearly.
Above: 4,265 – confirmed resistance, if broken will strengthen the scenario of gold heading to higher price areas, matching the "super cycle 5,000 USD" story in the long term.
Trading plan for next week (according to H1 & Volume Profile)
Priority scenario – Buy at VAL with the trend
Buying area: around 4,200 (VAL of Volume Profile).
Can flexibly range 4,198–4,203 depending on spread and market conditions.
Idea: wait for the price to pull back to the VAL area, observe H1 candle reactions (long lower tail, rejection candles...) before entering the order.
Immediate targets:
TP1: area 4,240–4,245
TP2: 4,265 – important resistance marked as "important resistance, confirming medium term increase".
If the price closes clearly above 4,265 and successfully retests, consider holding part of the position or finding additional entry points, according to the scenario of expanding to higher areas in the new cycle.
Defensive scenario – Deep support
If the 4,200 area does not hold, the 4,164 area will be the next support to watch.
Closing H1/D1 below 4,164 will be a signal to reduce short-term expectations and wait for a new structure instead of trying to "buy every dip".
Fundamental context – Reasons gold is still supported
Gold is heading for its best growth year since 1979, with an increase of over 60% in 2025 – this is the context of a true bull market, not just a recovery wave.
YTD performance of XAU outperforms BTC, showing that large capital flows prioritize stability and gold's safe haven role.
Current supporting factors: US bond yields cooling, USD weakening.
Geopolitical tensions escalating, Russia–US negotiations have not brought clear breakthroughs.
The market prices in nearly a 90% chance of the Fed cutting rates at the next meeting, making non-yielding assets like gold more attractive.
Follow Brian to share the Gold scenario together
XAUUSD – Ascending Channel in Play, Upside Target Towards 4,240
Brian – Focusing on buying the dip, watching for short setups near upper resistance
Market overview & structure
On the H4 chart, gold is moving neatly inside a well-defined ascending channel, with higher highs and higher lows. The current leg is pointing towards the 4,237–4,240 region, which aligns with:
The upper boundary of the channel.
A key resistance zone.
The 1.618 Fibonacci extension and resting liquidity above recent highs.
This keeps the broader bias bullish, but as price approaches 4,240, the probability of profit-taking and short-term selling pressure naturally increases.
Wave & technical context
The current move is an extension of the previous bullish structure after price broke out of the old bearish channel and started to consolidate in a new bullish one.
Liquidity levels around 4,193 and above suggest that the market has been building positions and has room to drive price into higher resistance.
The buy zone highlighted near the lower boundary of the channel, around 4,154–4,157, is where buyers are likely to step back in to defend the trend.
As long as price holds above 4,150–4,154, the scenario of a continuation towards 4,240 remains the higher-probability path.
Key zones & trading plan
Primary scenario – Buy with the trend inside the channel
Buy zone: 4,154–4,157 (channel support + marked buy zone).
Idea: Wait for a pullback towards the lower boundary of the channel, or a brief liquidity sweep into this zone, followed by a clear rejection candle on H1/H4 before entering long.
Targets:
Short-term: 4,190–4,200 (mid-channel / interim liquidity).
Extended: 4,237–4,240 (major resistance + 1.618 Fibonacci extension).
This is a trend-following “buy the dip” setup suitable for swing or short-term positional traders.
Secondary scenario – Short-term sell from 4,237–4,240
Sell zone: 4,237–4,240 – the confluence of strong resistance and the 1.618 Fibonacci extension.
Idea: If price tags this zone and shows clear rejection (long wicks, bearish reversal pattern on H1/M15), it may offer a counter-trend short back towards the mid-channel or 4,190–4,200 support.
This is a short-term, counter-trend idea, so:
Position size should be smaller than the main long setup.
Stop loss should be kept tight above 4,240 and not dragged wider out of emotion.
News & broader context
Liquidity conditions may thin out towards the end of the day due to the ongoing Thanksgiving holiday period in the US, which can lead to sudden spikes and stop hunts, especially around obvious liquidity pools.
On the political side, headlines such as Mr. Trump’s comments about “permanently suspending immigration from third-world countries” add to general policy uncertainty, but the impact on gold is mostly indirect through broader risk sentiment.
Another interesting point: silver has been rallying strongly, supported by solar-energy demand and supply concerns. It is acting like a “silent workhorse”, attracting fresh capital. This does not remove gold’s role, but shows that precious metals as a whole are gaining attention.
Strategy & risk management
For now, my focus remains on buying dips around 4,154–4,157 in line with the ascending channel, and only looking for short, tactical sell setups if price clearly rejects 4,237–4,240.
I prefer to avoid entering fresh trades when US liquidity is very thin or right into major holiday sessions, as spreads can widen and price action can become erratic.
Once price closes decisively below the buy zone and breaks the channel structure, this bullish plan loses validity, and it is better to step aside and reassess rather than forcing trades.
What do you think – does this channel still favour the bulls, or are you expecting a deeper correction from the 4,240 region? Feel free to share your view in the comments.

XAUUSD – H1 uptrend channel, short-term downside risk increasingXAUUSD – H1 uptrend channel, short-term downside risk increasing Brian – Prioritize short selling at the channel peak, wait to buy back at lower support
I. Strategy Summary Gold is trading in an uptrend channel on H1, but the rise around 4.160 shows signs of weakening, increasing short-term correction risk.
Preferred Scenario: Short sell at the channel peak 4.162–4.164, targeting support areas 4.145 – 4.130 – 4.115 – 4.100.
After the correction, the 4.100–4.080 area may become the foundation for the next rise in the larger trend.
Important price areas to watch: 4.139 – 4.127 – 4.110 – 4.088.
II. Macro Context & News 27/11
02:00 – Fed releases Beige Book This document updates the Fed branches' assessment of the US economic situation.
Describing slower growth, cooling price pressures will further reinforce expectations that the Fed will soon cut interest rates → supporting gold.
Conversely, if the Beige Book describes the economy as still “resilient,” the market may temporarily slow down pricing in rate cuts → causing a short-term adjustment for gold.
19:30 – ECB releases October meeting minutes
If the minutes lean towards the scenario of keeping high interest rates longer, the EUR may be supported, indirectly affecting the USD and gold inflows.
However, the impact is usually not as strong as US data, mainly affecting the overall risk-on/risk-off sentiment.
General Context: Gold has surpassed 4.160 USD/oz as the market increasingly expects the Fed to cut interest rates as early as December, reducing the appeal of interest-bearing assets and increasing the allure of gold – a non-yielding asset. This creates a support foundation for the medium-term uptrend, but after a hot rise, technical adjustments on H1 are normal.
III. Technical Structure – H1 uptrend channel
The price is within the H1 uptrend channel, with rising peaks and troughs, but the upper area near 4.160 coincides with:
The upper boundary of the price channel. The “Sell POC” area on the chart – where liquidity and sell orders are concentrated.
Preferred scenario on the chart: The price may slightly rebound to the POC area 4.162–4.164, then be rejected and slide to the important support area around 4.110 before extending the adjustment down to 4.100–4.080.
The lower trendline of the uptrend channel also acts as a short-term buy area if a clear candle reaction appears.
Notable price areas on H1: Resistance: 4.162–4.164 (channel peak + POC). Intermediate support: 4.139 – 4.127 – 4.110. Deep support: 4.088 – 4.080 – 4.100 (area that may form the bottom for the next rise).
IV. Trading Plan 1. Preferred Scenario – Short sell at the channel peak Idea: Short sell when the price rebounds to the upper boundary of the H1 uptrend channel and POC 4.162–4.164, expecting a correction to support.
Sell: 4.162–4.164 SL: 4.168 TP targets: TP1: 4.145 TP2: 4.130 TP3: 4.115 TP4: 4.100
This is a counter-move order in the uptrend channel, only targeting a short-term correction, not a major trend reversal scenario.
2. Supplementary Scenario – Short buy at support trendline Idea: When the price hits the lower trendline of the H1 uptrend channel and a nice candle reaction appears, consider a short-term buy according to the channel, prioritizing areas:
4.139 – 4.127 – 4.110 – 4.088
Specific Entry/SL levels will depend on the actual price reaction at the trendline, but the general principle:
Buy close to the trendline,
SL placed below the immediate support area,
TP aimed at the middle of the channel or the nearest resistance.
V. Risk Management & Notes
Do not open new positions right before or at the time of the Beige Book and ECB minutes release, as volatility may suddenly increase, widening spreads.
The sell order at 4.162–4.164 is a short-term counter-trend order in the uptrend channel, requiring moderate volume and strict adherence to SL 4.168.
If the price clearly breaks and holds above the 4.170 area, the H1 correction scenario weakens – in that case, stay out, wait for a new structure instead of trying to maintain a sell view.

USDJPY Vulnerable to Deep Pullback After Wave 5USDJPY has completed a full 5-wave rising structure inside a clear wedge pattern, which usually signals exhaustion. The final Wave (5) shows weakening momentum, and price is beginning to slip below the wedge support — an early sign that the trend may be reversing. This suggests the pair is likely entering a deeper corrective decline, potentially retracing toward 150 or lower in an impulsive A-B-C move. In simple terms: uptrend looks tired → wedge breakdown could trigger a strong downside correction.
Stay tuned!
@Money_Dictators
Thank you :)

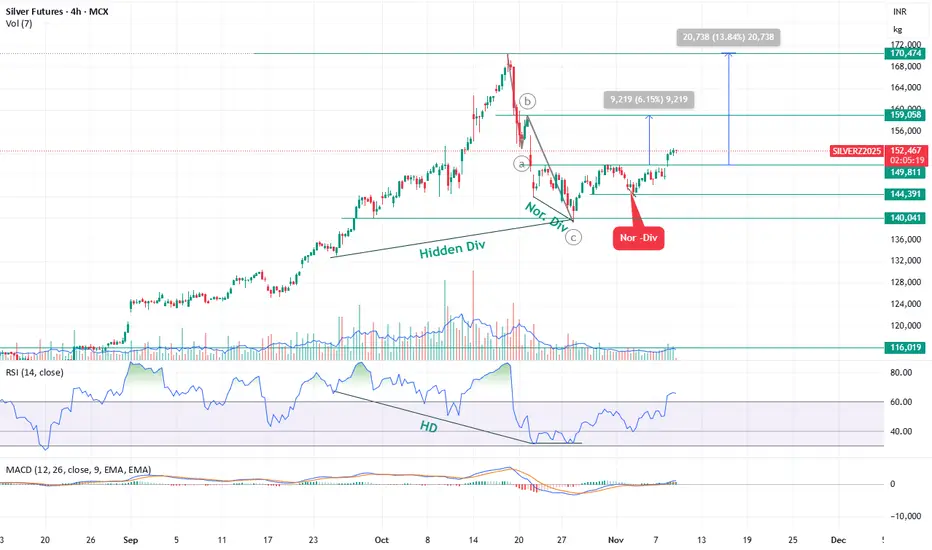
Bullish — Silver bounce expected toward ₹1,59,000 and ₹1,72,000 Silver Futures (SILVERZ2025 – 4H Chart) Technical Outlook
Elliott Wave Structure & Current Setup
Silver is currently trading in Wave 4, and the corrective phase appears to be complete.
Silver has completed its Wave 4 correction and has started a new impulsive leg (Wave 5).
A breakout above ₹1,50,000 has confirmed bullish momentum, supported by RSI and MACD signals.
📈 Upside Targets:
₹1,59,000 – first resistance / 6% upside
₹1,72,000 – extended target / 13.5% upside
⚙️ Supports:
₹1,49,000 – near breakout retest zone
₹1,44,000 – wave 4 base, invalidation below this level
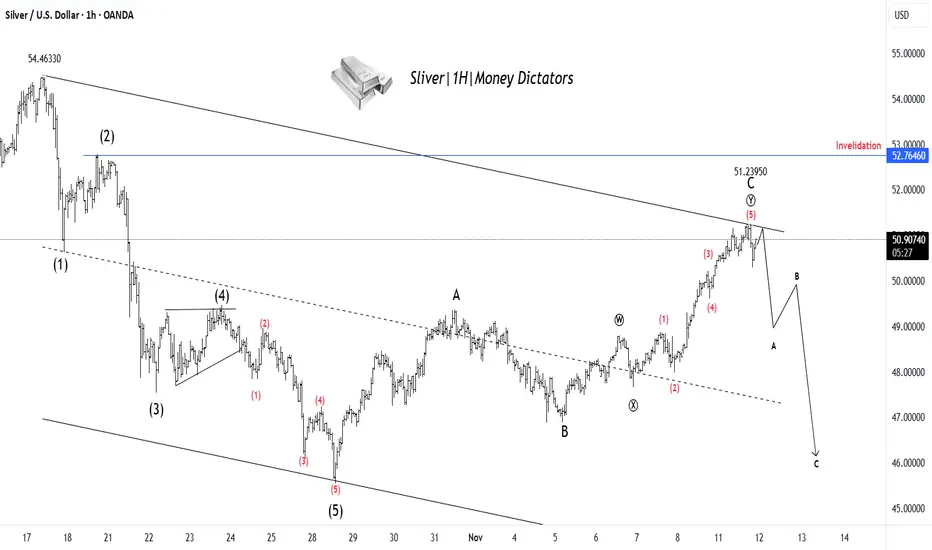
XAG/USD Set for Decline After Finishing Wave YSilver has completed a clear 5-wave upward move, ending near the 51.23 zone, which likely marks the completion of Wave C of the corrective structure. Price action shows rejection from the upper trendline, signaling that buying momentum is fading. This suggests the start of a new A–B–C corrective decline, where Silver could first drop toward 48–47 levels before any temporary bounce. The overall structure remains bearish in the short term unless the price breaks above the 52.76 invalidation zone. In simple terms: rally looks complete → downside correction likely ahead.
Stay tuned!
@Money_Dictators
Thank you :)
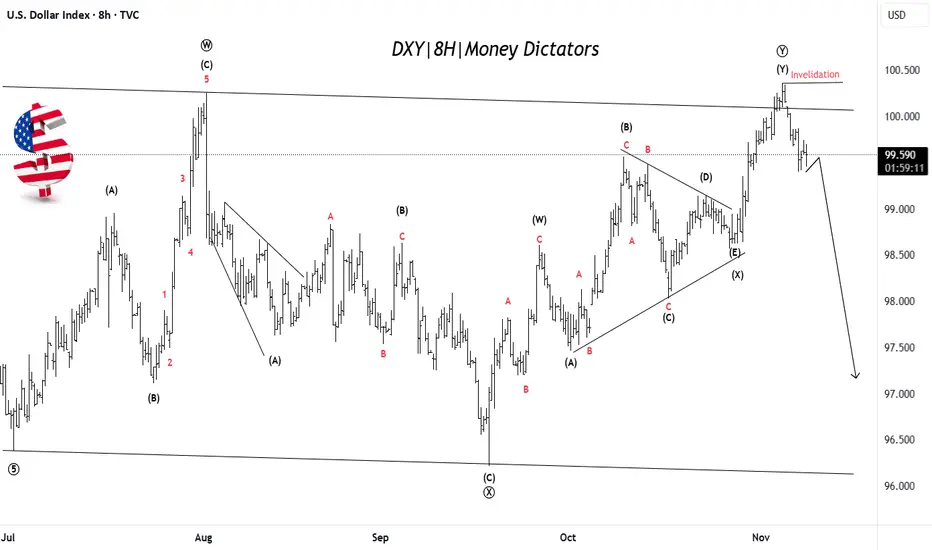
US Dollar Weakness Likely After Final Push UpDXY has completed a complex corrective W–X–Y pattern, with the final leg (Y) recently topping near the 100.50 zone. Price has failed to break above the invalidation level, suggesting the uptrend is losing strength. This signals that the dollar may have finished its corrective phase and could now start a fresh bearish wave targeting lower zones near 97–98. The overall structure indicates that momentum is shifting from bullish to bearish. In simple terms: rally is likely over → downside move toward new lows expected next.
Stay tuned!
@Money_Dictators
Thank you :)
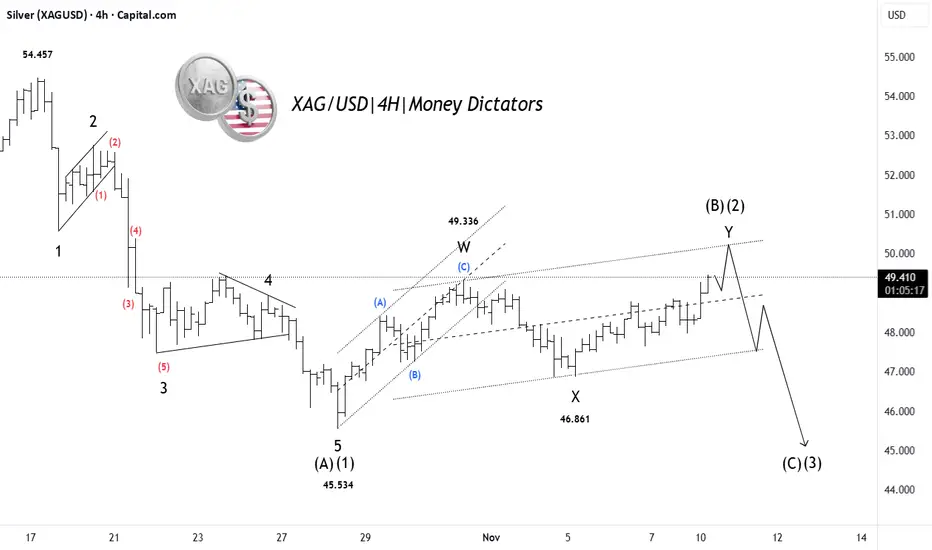
Silver Correction Ending: Major Drop AheadSilver (XAG/USD) has completed a 5-wave decline, marking the end of Wave (A)/(1) near the 45.53 level. Since then, price has been retracing upward in a complex W–X–Y corrective structure, which appears to be forming the final leg of Wave (B)/(2). The rise is losing strength near the upper channel, hinting that bulls may soon exhaust. Once Wave (B)/(2) finishes, the next big move is expected to be a strong bearish Wave (C)/(3) decline targeting lower zones near or below 45. In simple terms: last leg of correction nearly done → next big drop ahead.
Stay tuned!
@Money_Dictators
Thank you :)
Astral on the Verge: Technical Breakout & Investment Zones MappeAstral Limited : CMP: 1557.30: After studying its monthly chart structure and weekly Elliott Wave formations. Recent price action suggests a potential breakout setup, offering opportunities for both aggressive traders and patient investors.
Entry for Aggressive Traders:
• Aggressive traders can look for a breakout above the recent swing high near 1,579, as marked on both the monthly and weekly charts. This level has already shown strong momentum, with a notable price jump of +7.39% in the recent candle.
• Targets: 1630, 1725, 1795, 1935, 2200. Use trailing stop-loss: 1500, 1625, 1710, 1790, 1900 as you move up. Manage risk and adjust stop-loss as per levels.
Conservative Entry for Investors
• Investor Entry: Investors may enter on reasonable dips towards 1,440–1,460 support zone, as this range aligns with previous resistance turned support and is less volatile. Alternatively, entry after confirmation of the breakout above 1,579 with sustained volume is also suitable.
• Targets: Investors: Enter between 1,440–1,460. Targets: 1,935 and 2,200 for the medium term.
These represent major Fibonacci retracement zones and historical resistance levels, suggesting strong probability of acting as future price objectives. Investors can use a wider stop near 1,230 based on weekly chart support.
📌 Thanks a ton for checking out my idea! Hope it sparked some value for you.
🙏 Follow for more insights
👍 Boost if you found it helpful
✍️ Drop a comment with your thoughts below!

S&P 500 – Elliott Wave Breakdown & Long Setup (15-Min Chart)The S&P 500 has completed a full five-wave impulsive decline and is now progressing through a corrective A–B–C structure, offering a potential long setup on the horizon.
🔍 Wave Structure Recap:
- Wave (1) began on Oct 29, 2025, from a top of 6,920.33, and ended on Oct 31 at 6,814.27.
- Wave (2) retraced to the 61.8% Fib level of Wave (1), topping at 6,879.01.
- Wave (3) extended to the 161.8% Fib projection of Wave (1), bottoming at 6,707.52.
- Wave (4) retraced between the 23.6%–38.2% Fib zone, peaking at 6,757.64.
- Wave (5) concluded near the 61.8% extension, at 6,631.45.
📈 Current Setup:
- The index is now completing corrective Wave A, currently in its final sub-wave (v), targeting the 38.2% projection at 6,734.47.
- We anticipate a Wave B retracement toward the 50%–61.8% zone, near 6,670, which will be our entry level to go long and ride the upcoming Wave C.
🧠 Strategy:
- Wait for Wave A to complete near 6,734.
- Look for bullish confirmation around 6,670 during Wave B.
- Target Wave C extension with trailing stops to capture the move.

AUD/NZD Nearing Peak: Expect Controlled PullbackAUD/NZD has completed a clean 5-wave impulsive move to the upside, finishing Wave (1)/(A) near the recent peak. From here, the price looks ready to start a deeper correction in the form of Wave (2)/(B), which may pull back toward the lower support zone inside the rising channel. This corrective move could unfold in multiple legs before turning bullish again. Once Wave (2)/(B) completes, the chart expects a strong rally into Wave (3)/(C), aiming for new highs. In simple terms: a healthy pullback first, then a powerful upside continuation.
Stay tuned!
@Money_Dictators
Thank you :)

GOLD – TRIANGLE COMPRESSION ON H4 ✨ GOLD – TRIANGLE COMPRESSION ON H4, AWAITING A STRONG BREAKOUT IN WAVE 5 ✨
💬 Gold is accumulating in a compression triangle – when silence lasts too long, the market is about to speak.
Hi everyone 💖, Kristina is back with today's perspective on gold. I hope this analysis will help you – whether you're a new trader or have been trading gold for years – gain a clearer view to prepare for the upcoming breakout.
📉 Technical Analysis:
Currently, gold is moving within a triangle pattern on the H4 frame, indicating that market energy is being compressed. When the price breaks out of this area, the movement range could reach several tens of points.
Important support zone: 3960–3980
Strong resistance zone: 4035–4045
👉 When the price breaks one of these zones, the trend will be clearly confirmed.
According to Elliott Wave, Kristina is observing two scenarios:
1️⃣ Long-term: Wave (5) could be a downward wave, heading towards 3820.
2️⃣ Medium-term: Wave (5) can still rise if the price holds the 4000 zone, targeting around 4110–4130.
💎 Trading zone according to ICT:
Order Block around 4040 is a potential supply zone – a reversal signal is likely to appear.
The area around 4000 is a notable support point – it can create a bounce reaction if the price retests.
🎯 Reference trading scenarios:
Sell around 4040 when there is a reversal signal, SL 10 points, TP 4020–4000.
Buy around 4000 after the price retests the OB, SL 10 points, TP 4110.
If the price breaks 3970, wait to Sell around 3980, SL 10 points, TP 3820.
🕊️ Currently, gold is in a waiting phase – observe, don't rush, to act with the trend when the market "speaks."
🌷 The analysis reflects Kristina's personal perspective, not an investment recommendation.
If you share the same viewpoint or have a different perspective, please leave a comment below 💬💕

BAJAJ AUTOHello & welcome to this analysis
The decline from September 2024 high till April 2025 low appears to be a 5 waves down impulse that I have marked as A of the corrective ABC wave.
The rise from April 2025 low till September 2025 high appears to be corrective ABC in structure.
If we consider the corrective as completion of B of ABC then the current decline would unfold into another 5 waves impulse down to complete C of ABC
If we consider the corrective as completion of (A) of B of ABC then the decline would pause between 8400 - 8000 to attempt another leg up within the corrective.
In either scenario a decline is likely coming as long as it stays below 9200
Conclusion
Short term weakness, investors/buyers should wait for proper structure to unfold before attempting longs
All the best

[XAUUSD] New Week Scenario: Accumulation Awaiting Drop New Week Scenario: Accumulation Awaiting Drop - Watch for Selling at Liquidity Zone $4195
Hello traders community,
The new week begins with XAUUSD (Gold) being "restrained" in a sideways structure. However, don't let this calm deceive you. Technically, this is an accumulation pattern with a clear bearish bias.
The market is in "wait" mode, and patience will be the key to catching the next big wave.
📰 MACRO ANALYSIS: TUG OF WAR AHEAD OF FOMC
The market is caught between two opposing streams of information:
Bearish Pressure: Positive signs of a US-China trade deal are reducing the demand for safe-haven assets, putting pressure on Gold prices.
Bullish Support: The weakening USD due to expectations that the Fed will continue to cut interest rates, inadvertently provides some short-term support for the precious metal.
Decisive Factor: Traders are "lying low" waiting for this week's two-day monetary policy meeting (FOMC). This will be the main event, determining the medium-term trend of USD and Gold.
📊 TECHNICAL ANALYSIS: CONTINUATION OF BEARISH STRUCTURE
The H1 chart shows a very clear "Sell" scenario:
Price Structure: After a strong drop from the peak, the price is moving sideways in an accumulation pattern of a bearish pennant. This is a continuation structure, indicating that the Sellers are "resting" before pushing the price further down.
Ideal Sell Zone: The $4195 zone is an extremely strong resistance confluence, marked as "Liquidity strong" on the chart.
This is the 0.5 Fibonacci level, the "golden" retracement point of the entire previous decline.
This is the old support zone now turned into new resistance.
Optimal Scenario: We will wait for the price to pull back to test the $4195 liquidity zone. This is an opportunity for Sellers to enter the market with low risk and high profit potential.
🎯 TRADING PLAN (SELL SETUP)
Absolute priority is to Watch for Selling (Sell) in line with the main trend.
ENTRY (Sell): $4195
STOP LOSS: $4205
TAKE PROFIT: TP1: $4168-TP2: $4145-TP3: $4122-TP4: $4102
SUMMARY
In the context of the market awaiting FOMC news, Gold is likely to make a final "pullback" to the $4195 zone before continuing its downtrend. Be patient and wait for signals at this ideal sell zone.
Wishing traders a successful and disciplined new trading week!

