BN Short-term view as per EWPBN looks range bound and likely to go upward above 41350 with a less probability of slipping below if it breaks 41150 support
Elliotwaveanalysis

Silver possible Elliot wave counts (Now down and then Up)Silver is now ready to dip down and to unfold wave 5 of (C)
and as per equality, Target of (C) equal to (A) is pegged at 19.963 and 1.618 is pegged at $ 18.350,
which can be stop loss for fresh long positions to be made below $ 20.
Disclaimer.
I am not sebi registered analyst.
My studies are for educational purpose only.
Please Consult your financial advisor before trading or investing.
I am not responsible for any kinds of your profits and your losses.
Most investors treat trading as a hobby because they have a full-time job doing something else.
However, If you treat trading like a business, it will pay you like a business.
If you treat like a hobby, hobbies don't pay, they cost you...!
Disclaimer.
I am not sebi registered analyst.
My studies are for educational purpose only.
Please Consult your financial advisor before trading or investing.
I am not responsible for any kinds of your profits and your losses.

Banknifty's Short-term Analysis on 15 Min ChartWe've achieved our 2nd target of 41665 and may be undergoing short correction up to a level of 41400-41350, and if it trades above the 41450 level, we will another uptrend toward the final target of 42200

BANKNIFTY possible Elliott wave counts (now up then down)Hello Friends,
Hope you are doing well,
Today we are sharing banknifty possible Elliott wave counts along with invalidation levels and along with alternate wave counts, which can be overall road map for next moves expected further, in both current and alternate counts banknifty is looking good short candidate but only after some rally it means it looks like sell on rise along with strict stoploss of invalidation levels only, so it may go up side first then good move towards south is expected.
Our studies are only for educational purposes and not for trading purposes so we are not responsible for any kind of profits or losses in trading or in investing in market, so always please consult your financial advisor before trading or investing, do read disclaimer.
Thanks
Most investors treat trading as a hobby because they have a full-time job doing something else.
However, If you treat trading like a business, it will pay you like a business. If you treat like a hobby, hobbies don't pay, they cost you...!
Disclaimer.
I am not sebi registered analyst.
My studies are for educational purpose only.
Please Consult your financial advisor before trading or investing.
I am not responsible for any kinds of your profits and your losses.

#banknifty analysis for the week of Holi:-BN has given a trendline breakout of upside, as long as 40,348 holds, there are no shorting opportunities.
Wave 3 is in progress, monday will see a gap-up opening and the index will face resistance in the zone of 41,729 to 41,979 area.
If wave 4 triggers, we might see a correction close to 41,000 area, followed by the next upmove till (min) 42,344.
Always trade what you see, not what you feel.
We wish you a very Happy Holi. May the spirit of Holi bring you happiness. The warmth of Holi brings you joy, and the joy of Holi brings you hope.
Regards,
SG

Banknifty's Short-term Analysis on 15 Min ChartBN may remain range-bound today unless it breaks above 40725 or the day's high and breaks below 38.2% correction

Bank Nifty Wave CountsBank Nifty is completing triangle in Wave B which could end around 41200-41300 & can start next leg down in Wave C which could be good short trade.
I am not a SEBI Registered Analyst Charts are for Education Purpose i am not liable for any profit or loss for ideas shared here.

Nifty Wave CountsNifty Can pull back to 17484-17554 levels in Wave 4 Sequence looks incomplete so a last dip cannot be ruled out.

Nifty spot Possible Elliot wave countsHere we have plotted possible Elliott wave counts of Nifty spot chart on hourly time frame, we are assuming equality level of (W) and (Y) near 16600 levels.
Currently we are unfolding wave (Y) in which we are still in wave v of wave A near yet to complete, post wave A we are assuming to start wave B, which can just be counter trend rally, and also it can generate new opportunity to short fresh positions on completion of wave B to start fresh fall as wave C of wave (Y).
here we are assuming small rally to complete wave B along with invalidation level of bottom of wave A swing low, and then big fall to complete wave C of wave (Y) along with invalidation level of high of wave B swing high.
I am not sebi registered analyst.
My studies are for educational purpose only.
Please Consult your financial advisor before trading or investing.
I am not responsible for any kinds of your profits and your losses.
Most investors treat trading as a hobby because they have a full-time job doing something else.
However, If you treat trading like a business, it will pay you like a business.
If you treat like a hobby, hobbies don't pay, they cost you...!
Disclaimer.
I am not sebi registered analyst.
My studies are for educational purpose only.
Please Consult your financial advisor before trading or investing.
I am not responsible for any kinds of your profits and your losses.

NIFTY WAVE 3 BULL MARKET COMINGNSE:NIFTY seems to have completed wave 2 correction by retesting the Flag Breakout.
We shall be heading in Unprecedented Bull Run in Wave 3 of Bull market. Fortunes can be made in wave 3 of 3.

Bank nifty Elliot wave correction patternBank nifty hold 39600 ..
expecting one correction pattern upside abc structure
Expecting target 43200
Remember if any corrective structure down side dragged to 38400 level bank nifty.
Expecting upper move
First target 41200

BN Short-term view as per EWPBN is heading towards 40500 lvl making a-b-c correction and may even see 40775 lvl shortly. Would agree or not? Please share your view.

Nifty ascending triangle formation Nifty ascending triangle formation bullish only above 18260 daily closing


METAL STOCKS BOTTOMING OUT IN WAVE 2NSE:CNXMETAL Metal stocks are bottoming out in wave 2 correction. Shall be heading in wave 3 higher. Bought couple of them today.

Nifty correction Analysis ELLIOT WAVE Nifty look like wave structure show C OF c pending target 17660
stop 17855

Short Term Bearish Short term Bearish road map described on chart, down leg going to be completed in very short time sharply by nature of pattern.

Tata MotorsLooks like Wave 4 Triangle here. Wave 4 retracement is confined around 0.382 retracement. 445-447 is the immediate resistance. 430 is the support. Looks good here for 470-480 as Wave 5 Target.

Nifty's Short-term Analysis as per EWPNifty has completed its minor move-up (shown on 15 min chart) and correcting to 50% of the entire up move is very likely. So, we are expecting a further down move.

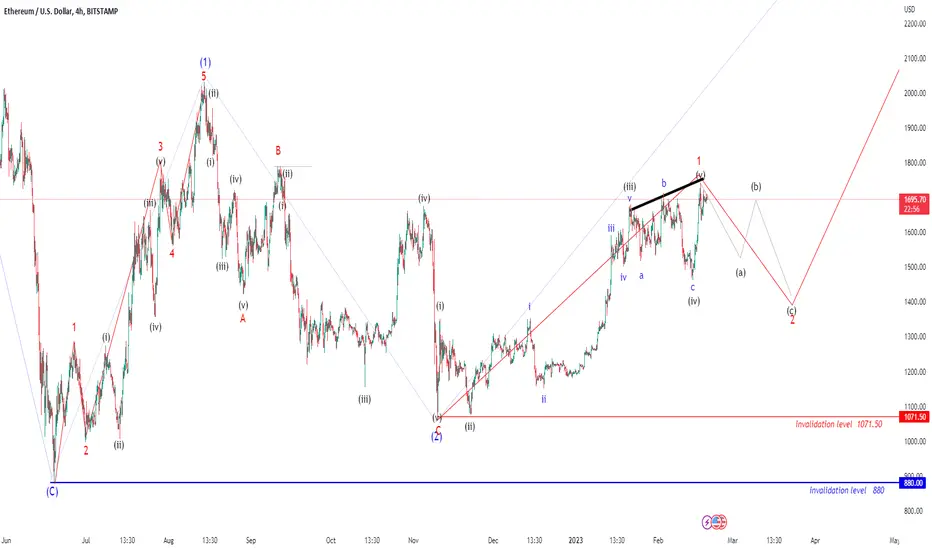
Ethereum possible Elliot wave counts Here we have shared possible Elliot wave counts of ETHUSD (for educational purpose only) which are suggesting correction for very short term and this correction can be used as good opportunity to go long for further trend which is expected post this correction, the invalidation level of further up move can be low of previous wave 1 which is pegged at 1071.50, if it breaks below this level then we can assume that our counting is missing something and we may invalidate this structure, Overall we are unfolding some impulse in which we had completed wave (1) and now possibly we are heading to unfold wave (2) and then, post correction we can start wave (3). wave (2) can unfold in three subdivisions like ABC and ABC can unfold in 5-3-5 structure or 3-3-5 structure. Lets see what happens next.
My studies are for educational purpose only.
Please Consult your financial advisor before trading or investing.
I am not responsible for any kinds of your profits and your losses.
Overall wave structure is shared below
Most investors treat trading as a hobby because they have a full-time job doing something else.
However, If you treat trading like a business, it will pay you like a business. If you treat like a hobby, hobbies don't pay, they cost you...!
Disclaimer.
I am not sebi registered analyst.
My studies are for educational purpose only.
Please Consult your financial advisor before trading or investing.
I am not responsible for any kinds of your profits and your losses.

USOIL CRUDE OIL possible Elliot wave countsUS OIL is looking good to go long as per Elliot wave structure with invalidation level of below $ 76.50, for target level of near $ 83.05.
My ideas as just for educational purpose only
I am not sebi registered analyst.
My studies are for educational purpose only.
Please Consult your financial advisor before trading or investing.
I am not responsible for any kinds of your profits and your losses.
Most investors treat trading as a hobby because they have a full-time job doing something else.
However, If you treat trading like a business, it will pay you like a business.
If you treat like a hobby, hobbies don't pay, they cost you...!
Disclaimer.
I am not sebi registered analyst.
My studies are for educational purpose only.
Please Consult your financial advisor before trading or investing.
I am not responsible for any kinds of your profits and your losses.

SUPPORT & RESISTANCE EXPLAINED IN NIFTYIn the Nifty chart, we can see that the Index was rejected multiple times along the trendline drawn and finally managed to give a breakthrough above the trendline.
Now, this resistance trendline is likely to act as a support trendline.
On Elliot wave analysis, the up move is currently at wave five, and we can expect a correction that will re-test the trendline.
The Index should test the support zone (17650 levels) and resume its upward rally.
