GOLD: Further levels using Elliott Wave TheoryWe successfully forecasted the path of gold in our post on May 12th.
Now, GOLD is looking like it's entering an impulse wave.
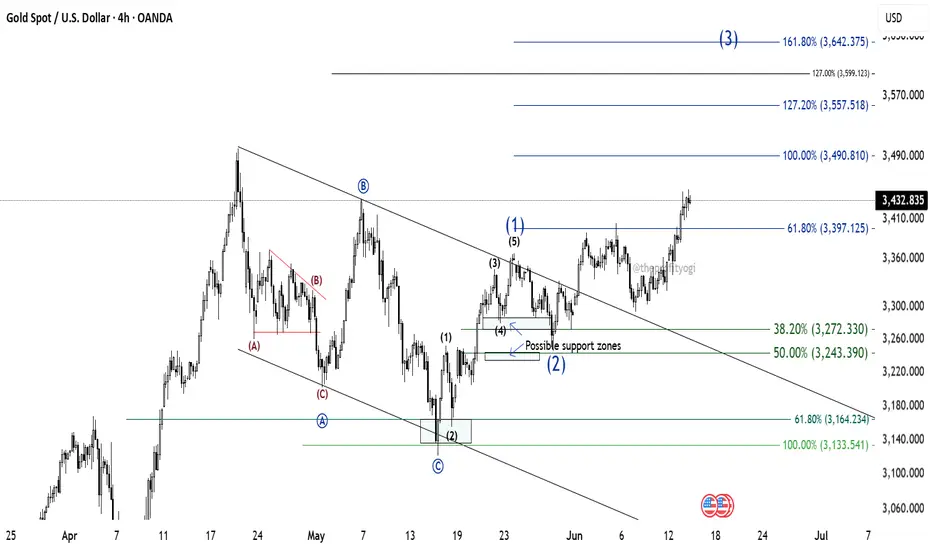
Wave (1) of this impulse was completed on 23rd May. The price then falls between the zone 38.2% and 50% to form wave (2). This was also predicted by us.
Currently, GOLD is in wave (3).
Now, to get the targets of wave (3), we have two possibilities.
1. Wave (3) goes to 100% and then reverses. This case is of the Terminal impulse. And the further path of GOLD can be predicted later.
2. Wave (3) goes to 161.8% (minimum). This is the case of Trending or normal impulse. And further path of GOLD can be predicted accordingly.
For now, GOLD is looking like going to touch at least the 100% (3490.81) level.
This analysis is based on Elliott Wave theory and Fibonacci.
This analysis is for educational purposes only.
This is not any buying recommendations.
Elliotwavesanalysis
TTML: Unlocking Potential with Elliott WavesHello friends, Welcome to RK Chaarts.!
Let’s analyse the chart of Tata Teleservices Maharashtra Limited from an Elliott wave perspective.
We can see that in March 2023, the stock formed a bottom around 49.65 and then moved upwards in an impulse wave. We can identify wave one as complete, ending around the July 2024 high.
After that, there was a sudden fall to the April 2025 low, which we assume to be the end of wave two. We expected it to reverse around the previous low, because wave II cannot retrace more than 100% of wave I (Elliott wave principles), and Same happened, it had reversed from that low to upside.
Looking at the weekly chart, we can see that post wave II, price has broken the 0-B trend line with strong volume intensity. If our wave counts are correct, we can measure wave I and project wave III’s target using Trend based Fib extensions as per Elliott wave theory.
According to the theory, wave III target could be around 150.70, which is 1.618 times the length of wave I.
Projected Targets as per Elliott waves:
So, friends, from an Elliott wave perspective, Tata Teleservices has strong potential to move upwards to around 150 rupees, with potential targets at 88, 112, 127, and 150 rupees.
Invalidation levels:
Please note that this analysis is for educational purposes only and involves multiple possibilities. The scenario presented focuses on one potential outcome, assuming the invalidation level of 49.65 is not triggered. If it is triggered, the chart would need to be reassessed, and wave counts would need to be reevaluated.
This is not a tip or advisory, but rather a educational analysis.
I am not Sebi registered analyst.
My studies are for educational purpose only.
Please Consult your financial advisor before trading or investing.
I am not responsible for any kinds of your profits and your losses.
Most investors treat trading as a hobby because they have a full-time job doing something else.
However, If you treat trading like a business, it will pay you like a business.
If you treat like a hobby, hobbies don't pay, they cost you...!
Hope this post is helpful to community
Thanks
RK💕
Disclaimer and Risk Warning.
The analysis and discussion provided on in.tradingview.com/u/RK_Charts/ is intended for educational purposes only and should not be relied upon for trading decisions. RK_Chaarts is not an investment adviser and the information provided here should not be taken as professional investment advice. Before buying or selling any investments, securities, or precious metals, it is recommended that you conduct your own due diligence. RK_Chaarts does not share in your profits and will not take responsibility for any losses you may incur. So Please Consult your financial advisor before trading or investing.

Elliott Waves Insights: Tesla’s Roadmap to SuccessHello friends, let's analyze Tesla's chart using theory. This is a 4-hour chart where we can clearly see that the higher degree, primary degree wave ((3)) in black has been completed. Currently, we're on the verge of completing wave ((4)) in black of the primary degree, which has three subdivisions marked in blue as (A), (B) & (C).
(A) and (B) are completed, and (C) is near completion. Within (C), we have five subdivisions in red, of which 1, 2, 3, & 4 are completed, and the 5th is also more than 60% complete. Once the red fifth is complete, it will mark the end of blue (C) and primary degree wave ((4)) in black.
As soon as wave ((4)) is complete, we can expect a reversal, which should be wave ((5)). Which should cross the high of wave ((3)) which is ATH, So, we're expecting wave ((5)) to start move upwards.
Now, friends, what's the invalidation level for this view? It's $139.20. This is a level that wave ((4)) should not cross, as it's the low of black wave ((2)). According to theory, wave 2 cannot retrace more than 100% of wave 1, wave 3 cannot be the shortest in impulse, and wave 4 cannot enter the territory of wave 1, which is here we’re witnessing in current scenario, which is considering we’re in any diagonal or triangle of higher degree.
If wave ((4)) crosses $139.20, it will invalidate our view. We might be missing some dots to join or create the picture perfectly. Currently, the price is around $222, and we might see a small bounce before making a lower low possibly around $200. If we witness a divergence there, it could lead to a reversal.
Please note that this study uses theory and structures, involves multiple possibilities, and focuses on one potential scenario. There's a risk of being completely wrong. This is for educational purposes only, and users should not trade or invest solely based on this study.
I am not Sebi registered analyst.
My studies are for educational purpose only.
Please Consult your financial advisor before trading or investing.
I am not responsible for any kinds of your profits and your losses.
Hope this post is helpful to community
Thanks
RK💕
Disclaimer and Risk Warning.
The analysis and discussion provided on in.tradingview.com/u/RK_Charts/ is intended for educational purposes only and should not be relied upon for trading decisions. RK_Charts is not an investment adviser and the information provided here should not be taken as professional investment advice. Before buying or selling any investments, securities, or precious metals, it is recommended that you conduct your own due diligence. RK_Charts does not share in your profits and will not take responsibility for any losses you may incur. So Please Consult your financial advisor before trading or investing.

#Banknifty directions and levels for July 19th.Banknifty:
Bank Nifty is still maintaining its range, so it might continue today as well. However, if it breaks the range, we can expect a move of a minimum of 50% to 78% to the upside. On the downside, if the market breaks the 50% Fibonacci level, we can expect a downside move to 78% to the swing low.

S&P 500 "Elliot Wave Analysis"S&P 500 "Elliot Wave Analysis"
Elliot Wave : 5 Wave Pattern
Wave 1,3 and 5 Effect direction of market
Wave 2 and 5 are counter move to Wave 1,3 and 5
Wave 2 never strike below Wave 1
Wave 3 is never the shortest
Wave 4 never enter Wave 1
Elliot Wave : Wave Structure
Wave structure takes place in two distinctive phases
The first phase is the Five Wave Structure know as Motive Waves
The second phase is the Three Wave Structure know as Corrective Wave
Motive and Corrective Wave together form the completed wave cycle of Eight Waves
Motive Wave : The below chart of S&P 500 has completed the 5 Wave structure
Corrective Wave : The below chart of S&P 500 has been started to form 3 Wave structure
Based on the wave analysis, we expect the S&P price to fall to $4105.
Happy Trading $$$$

Fabulous Idea on ITCNSE:ITC
In short term ITC finds support at Rs198-200.
A long term Bullish view on ITC.
Accumulation at major sell offs and sitting on it for a few years will yield good returns from here.

Triangle Ending Diagonal PatternElliott waves Ending Diagonal pattern (ABCDE)
Short entry @ point E.
Target Support trendline & then 0.618levels.

EW analysis on Nifty- Are we heading down?After an impulsive move from 12430 to 7511 we saw correction from 7511 to 10554 levels. Correction took the form of zig zag wherin A wave looks like leading diagonal followed by B wave (3wave move) and ongoing Wave C is near completion range. Now it looks like wave C will be followed by 5 wave downside impulsive move. So it is better to stay cautious with long positions at this level. View negates above 10560 levels.
