A Classic Case of Accumulation Turning into Momentum📈 SUPREME INDUSTRIES LTD – TECHNICAL ANALYSIS
📆 Date: May 27, 2025
🔍 Timeframe: Daily
Price Action:
Supreme Industries surged over 4% today and delivered a clean breakout after forming a consolidation triangle. The strong bullish candle closed near the day’s high with significant volume, confirming momentum on the upside.
Chart Pattern / Candlestick Pattern:
Symmetrical Triangle Breakout
Pullback Entry Zone Tested
Breakout Candle – wide range, strong body
Volume Surge – institutional interest visible
Technical Indicators:
RSI (Daily): 77 – strong bullish zone
MACD: Bullish crossover active
Stochastic: 98 – overbought but confirming strength
CCI: Above 200 – high momentum phase
Volume: 791.75K – supportive of breakout
Support & Resistance Levels:
Immediate Resistance: 4277.93
Next Resistance: 4355.47
Major Resistance: 4490.43
Immediate Support: 4065.43
Secondary Support: 3930.47
Major Support: 3852.93
Possible Fresh Demand Zone: 3837.60 – 3750.90
Chart Overview:
This visual clearly shows:
🔸 The symmetrical triangle pattern
🔸 Breakout + retest zone
🔸 Marked fresh demand zone for potential pullback opportunity
Educational Breakdown:
This setup combines:
Price Action: Triangle + Breakout
Volume Confirmation: Institutional participation
Momentum Indicators: Strong alignment
Demand Zone Mapping: Pre-breakout base
This is a classic trend continuation setup with clearly defined zones of interest. Risk control is key as price enters overbought territory.
Over the past few months, Supreme Industries displayed classic signs of an accumulation zone — a period marked by sideways movement, controlled volatility, and relatively stable volumes. This range-bound behavior typically indicates that long-term investors are quietly building positions while retail participation remains low. Recently, a strong bullish move supported by a significant rise in volume suggests the stock may have exited accumulation and entered the mark-up phase. This phase is often characterized by increased demand, higher price swings, and a clear shift in sentiment from neutral to bullish. The sharp breakout from the range, along with volume confirmation, signals the possible beginning of a new directional trend — where price tends to move swiftly as broader market participants join in.
How to Trade Supreme Industries (for learning purpose):
Entry Example: 4220.50
Stop Loss: 3781.50 (Risk: 439.00)
Target Example: 4659.50 (Reward: 439)
Sample Quantity: 50 shares
RR Ratio: ~1:1/1:2 etc.
Aggressive Traders: May consider riding the trend with trailing stop
Conservative Traders: Can wait for a pullback into the fresh demand zone (3837.60–3750.90)
⚠️ Risk Management Tip: Always trade with a clearly defined stop loss. Avoid entering positions impulsively. It is advisable to start with a smaller quantity and increase your exposure only if the price action confirms the continuation of the trend. Capital protection should always be the priority.
📢 Disclaimer
This content is created purely for educational and informational purposes. It is not intended as investment advice, stock recommendations, or trading tips. Trading and investing in the stock market involves risk. Please consult with a SEBI-registered financial advisor before making any investment decisions. The author/creator is not registered with SEBI and shall not be held responsible for any losses incurred based on this information. Always do your own research and use proper risk management.
👉 If you found this analysis helpful, don’t forget to Follow, so you never miss out on a trade-worthy setup, breakout opportunity, or valuable educational insight again. Stay updated and trade smarter! 💡📈
Ema200crossover

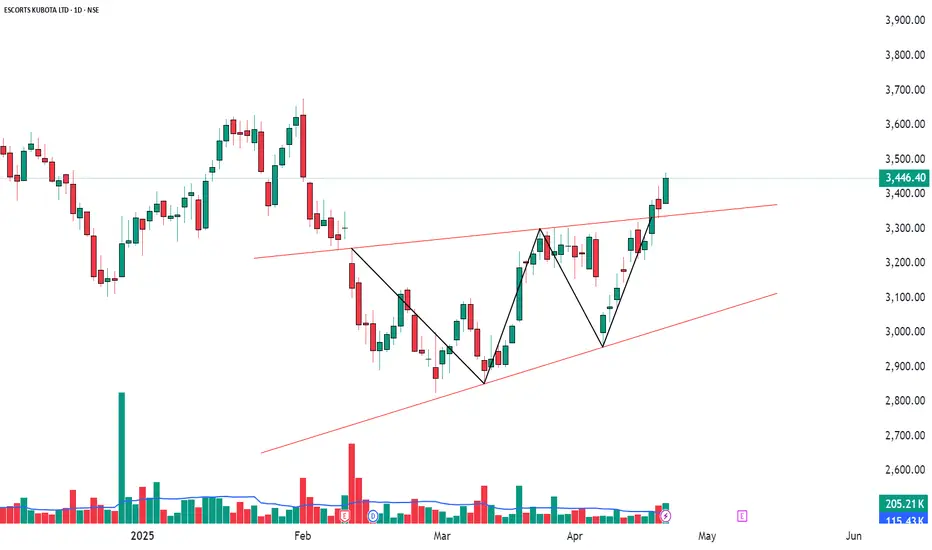
Bullish Signal with EMA Crossover and TTM SqueezeESCORTS (2.64%)
Bullish Signal with EMA and TTM Squeeze Breakout
ESCORTS shows a promising bullish setup, with a Strong Bullish Candle and an EMA 200 Crossover signaling a potential long-term trend reversal. The RSI Breakout and Bollinger Band Breakout further confirm the bullish outlook. A TTM Squeeze breakout also indicates increasing volatility, which could propel the stock further upwards.
Resistance Levels: 3482-3517-3572
Support Levels: 3392-3338-3302
Entry: @/above 3463.20
Stop Loss: @/below 3244.80
Volume Analysis: Volume has been increasing steadily, with higher than the average volume of 115.43K on 23rd April. This shows increased investor activity and potential momentum building.
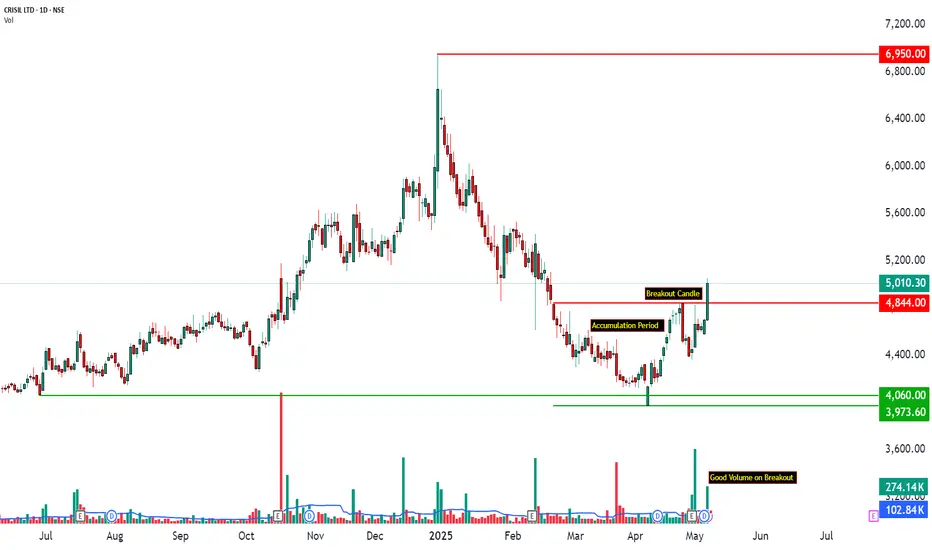
Bullish Momentum with EMA200 and Volume Confirmation📈 CRISIL Technical Analysis | Bullish Momentum with EMA200 and Volume Confirmation
📅 Date: May 08, 2025
📈 Timeframe: Daily
🔍 Stock: CRISIL(NSE)
📊 Price Action Update (Today):
CRISIL surged by +6.59%, closing at 5,010.30, after trading in a range between 4,690.20 and 5,050.00. The stock formed a strong bullish candle, resembling a Marubozu, with a close near the day’s high — a clear sign of aggressive buying. This breakout comes after a tight consolidation phase, and is supported by heavy volume, indicating strong participation and conviction in the move.
🧠 Technical Overview:
CRISIL has shown a decisive shift in structure with today’s breakout above its 200-day EMA, signaling a potential trend reversal. The stock had been consolidating in a narrow range for several sessions, building energy for a directional move. Today's breakout is validated by a surge in volume (2.5x the 20-day average), along with supportive indicators like RSI crossing 60, Bollinger Band expansion, and the TTM Squeeze turning OFF. These combined signals suggest that the stock is entering a momentum phase, where further upside is likely if follow-through buying continues. Immediate attention should be on price behavior around the next resistance at 5,143.
🧩 Chart Pattern Insight:
The price action on the daily chart reveals a rectangle consolidation breakout. CRISIL had been trading within a well-defined horizontal range, forming a base between 4,600 and 4,800 for several sessions. This pattern represents a period of accumulation. Today’s strong breakout candle marks a range breakout with volume confirmation, turning the previous resistance zone into potential support. The structure resembles a base breakout pattern, often seen before the start of a new uptrend. A sustained move above the breakout zone may lead to a measured move towards the next resistance levels.
🧱 Support & Resistance Analysis:
Post-breakout, CRISIL has established a new support base around 4,784, which was previously a resistance level during consolidation. Below this, the next key supports lie at 4,557 and 4,423, providing a cushion in case of any pullbacks. On the upside, the immediate resistance to watch is 5,143, a level where price previously reacted. If the momentum continues, CRISIL may test 5,276 and 5,503 in the coming sessions. These levels will be crucial in determining whether the breakout evolves into a sustained trend or faces short-term profit booking.
🔍 Volume Analysis:
The recent price movement in CRISIL shows a noticeable increase in volume, with traded volume at 2.5 times the 20-day average, suggesting heightened market activity. The breakout candle, paired with this significant volume, indicates a potential shift in the market trend. Prior to this, volume was relatively lower during the consolidation phase, indicating a period of accumulation or base-building. This typical volume pattern — lower during consolidation and higher during a breakout — strengthens the case for a potential trend change.
The volume profile suggests a shift in market sentiment, with buying interest becoming more prominent in the 4,700–4,800 range. The breakout candle shows a notable volume exceeded 270K, indicating increased buyer participation. Additionally, selling pressure observed in the 4,500–4,700 zone seems to have been absorbed, which may indicate a potential for further price movement.
📌 Educational Insight:
The recent breakout in CRISIL Ltd is a strong example of a trend reversal confirmed by volume, offering valuable insights for those studying price action, trend shifts, and volume dynamics. This setup illustrates how multiple indicators — including trend, volume, and volatility — align to suggest the potential for a trend continuation. Traders often look for such setups to make risk-defined entries during pullbacks. The breakout is characterized by significant volume and a full-bodied green candle on the daily chart, supported by several technical factors, such as volume and delta support, an EMA 200 crossover, and volatility expansion after a squeeze.
The outlook for CRISIL Ltd remains bullish, driven by multiple technical confirmations. However, caution is advised as the price approaches Resistance Levels 1 and 2 (R1–R2), where profit booking may occur. Additionally, if the price falls below 4,783 with volume confirmation, traders should consider reevaluating their positions.
⚠️ Disclaimer:
This analysis is purely educational and not a buy/sell recommendation. Please consult your financial advisor before making investment decisions. This content complies with SEBI guidelines and is intended to promote learning and market awareness.