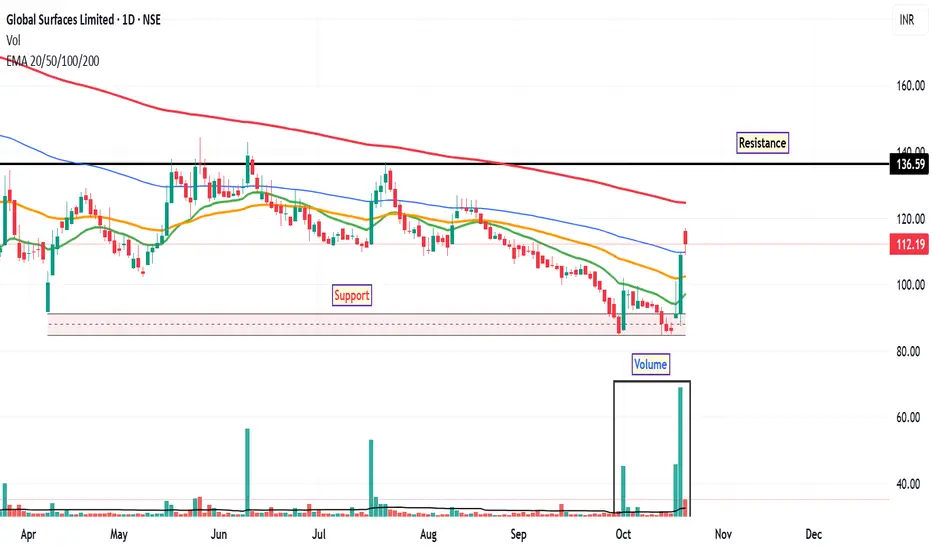
GSLSU: Trend Reversal Signals The stock of GSLSU has been in a sustained downtrend since May, revisiting its discount zone multiple times. However, recent price action suggests a possible shift in sentiment. On Friday, October 17, the daily chart printed an inverted hammer candlestick, a pattern often interpreted by technical analysts as a potential bullish reversal signal—especially when supported by volume and other indicators.
The inverted hammer on the daily timeframe may indicate buying interest at lower levels. This pattern gains significance when it appears after a prolonged downtrend and is accompanied by increased volume. The bullish signal is further supported by a rise in trading volume and a daily close above the 20-day, 50-day, and 100-day EMAs, suggesting short-term strength and potential trend reversal.
In the most recent trading session, the stock found support at the 100-day EMA and rebounded, reinforcing the validity of this level as a short-term base. The RSI has moved above 65, indicating increasing bullish momentum. This level is often seen as a sign of strengthening trend, though not yet in overbought territory.
If the stock sustains its upward movement, the next potential resistance level may be around ₹136 , based on previous price action. The discount zone near ₹84 may serve as a key support level. Traders often monitor such zones for invalidation of bullish setups or potential re-entry points.
Disclaimer: This analysis is intended for educational and informational purposes only. It does not constitute investment advice or a recommendation to buy, sell, or hold any financial instrument. Market participants should conduct their own research and consult with a licensed financial advisor before making any investment decisions.
Emacrossover
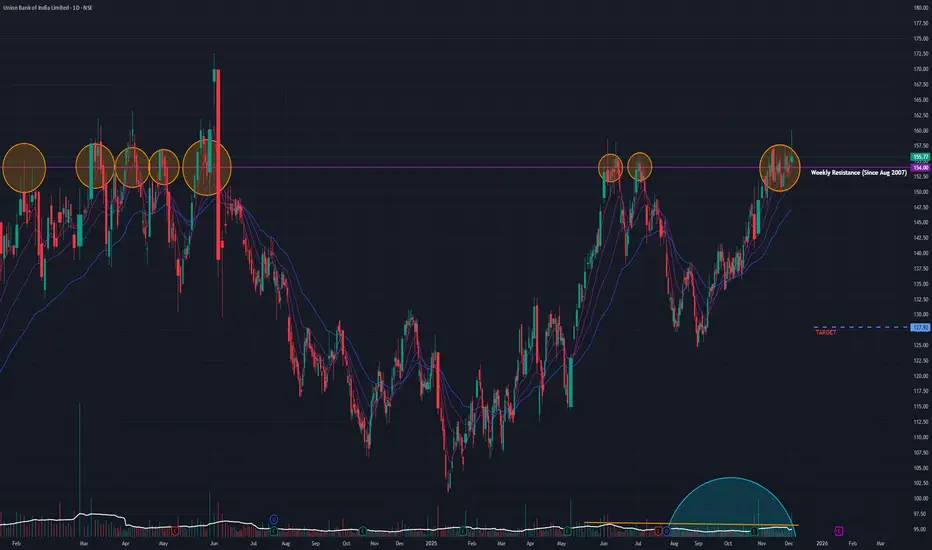
Union Bank (D): Cautiously Bullish - Breakout with RejectionTimeframe: Daily | Scale: Linear
The stock has attempted a breakout from a massive 15-year structural resistance, driven by index inclusion news. However, the daily price action signals strong profit-taking at higher levels, making the breakout fragile.
🚀 1. The Fundamental Catalyst (The "Why")
The massive 41.38 Million volume is a direct reaction to a major announcement:
- Bank Nifty Inclusion: It was announced that Union Bank will be added to the prestigious Nifty Bank Index starting Dec 31, 2025.
- Impact: This news forces passive funds (ETFs) to buy the stock, creating the volume spike. However, the "Shooting Star" suggests that active traders used this liquidity to book profits.
📈 2. The Long-Term Structure (The "Lid")
- The Cycle: .
- Peak: ATH in Oct 2010 .
- Bear Market: A decade-long spiral ending in May 2020 .
- Recovery: Since 2020, the stock has formed a "Higher Lows" structure, steadily attacking the resistance.
- The Resistance: The ₹154 – ₹155 zone is a "historic" resistance. It was a key level in Aug 2007 . Breaking a 15-year-old level is significant, but it requires a strong close to be valid.
🕯️3. The "Shooting Star" Warning (Today's Action)
> The Pattern: Today’s candle is a textbook Shooting Star .
- The Trap: The stock rallied to a high of ~₹160* , luring in breakout buyers.
- The Rejection: It was slammed back down to close near ₹155 , leaving a long upper wick.
> Interpretation: This signals that despite the good news (Index inclusion), massive supply (sellers) is still present above ₹155. The bulls failed to hold the high ground.
📊 4. Indicators
- EMA & RSI: The indicators (EMA PCO, Rising RSI) are bullish across Monthly, Weekly, and Daily timeframes. This supports the broader uptrend, but the daily candle overrides these in the short term.
🎯 5. Future Scenarios & Key Levels
The "Shooting Star" at a 15-year resistance is a classic "Bull Trap" warning.
- 🐂 Bullish Confirmation (The "Safe" Entry):
- Trigger: Ignore the current close. Wait for a Daily Close above the Shooting Star High (₹160) .
- Target: ₹220 . Once ₹160 is cleared, the 15-year supply is absorbed, and the path is open.
- 🐻 Bearish Rejection (The "Fakeout"):
- Trigger: If the stock slips back below ₹154 tomorrow.
- Consequence: This confirms today was a "fakeout." The price will likely drift down to the moving averages.
- Support: ₹125 is the deep support, but the 20-day EMA (~₹145) will likely be the first test.
Conclusion
While the trend is up, do not chase this breakout yet. The Shooting Star suggests the market is using the "Index Inclusion" news to sell. Wait for a close above ₹160 to confirm the bulls have won.
Motherson (W): Strongly Bullish, Post-Bonus Breakout(Timeframe: Weekly | Scale: Logarithmic)
The stock has confirmed a major structural breakout, emerging from a 7-month consolidation phase. This move is supported by a "Higher Low" structure, rising volume, and recent analyst optimism.
📈 1. The Structural Context (The Turnaround)
- The Adjustment (Context): It is important to note that the price levels (ATH ~₹144) reflect the 1:2 Bonus Issue that occurred in July 2025. The stock is now recovering from the post-bonus correction.
- The Cycle:
- Peak: ATH of ₹144.66 in Sep 2024.
- Correction: A downtrend lasted until April 2025 , finding a base.
- Reversal: Since April, the stock has shifted character, forming a clear series of Higher Lows , indicating steady accumulation.
💥2. The Breakout (This Week's Action)
- The "Lid" (Resistance Zone): The ₹113 – ₹116 zone has acted as a stiff resistance since Nov 2024. Breaking this level is significant.
- The Surge: This week, the stock decisively broke and closed above this zone with a 5.93% surge .
- Volume Confirmation: The move was backed by massive volume of 151.49 Million . Volume has been "drying up" since the ATH, so this sudden volume expansion is a classic "Ignition" signal.
📊 3. Technical Indicators
Indicator analysis shows a synchronized bullish trend:
- EMAs: Short-term EMAs are in a PCO (Price Crossover) state across Monthly and Weekly timeframes, confirming the trend is up.
- RSI: The Relative Strength Index is rising on both timeframes, showing momentum is building.
🎯 4. Future Scenarios & Key Levels
The breakout opens the door for a rally toward the previous highs.
- 🐂 Bullish Targets:
- Target 1: ₹132 . This is the immediate technical extension.
- Target 2: ₹145+ . If momentum sustains, a retest of the All-Time High is the structural goal. (Note: Some street estimates are as high as ₹162 ).
- 🛡️ Support (The "Must Hold"):
- Re-test Zone: The ₹113 – ₹116 zone has now flipped to support. A pullback to this level would be a healthy entry opportunity.
- Stop Loss: If the breakout fails (fakeout), the stock may slide to the ₹102 support zone.
Conclusion
This is a high-quality setup. The combination of Higher Lows , a Volume Breakout , and the Bonus Adjustment digestion makes this a strong candidate for a move to ₹132 . Watch for a sustained hold above ₹116 .

Suzlon Energy Ltd – EMA Crossover & Volume Confirmation (Daily CSuzlon Energy has shown a bullish EMA crossover on the daily chart, supported by a strong volume burst, signaling renewed buying interest after a corrective phase. The price has reclaimed the baseline resistance zone (₹59–₹61), and a sustained move above it could open the path toward the next major resistance near ₹68.
This setup suggests a potential trend reversal with strong momentum confirmation.
🎯 Key Levels:
CMP: ₹59.99 (+1.27%)
Baseline Resistance: ₹59 – ₹61
Target Zone: ₹67 – ₹69
Support Zone: ₹54 – ₹55
Stop-Loss: ₹53 (on daily close basis)
📊 Technical View:
20 EMA has crossed above 50 EMA, indicating a bullish trend shift.
Volume spike during the crossover adds strength to the move.
Price breakout from consolidation confirms accumulation.
Sustaining above the baseline could trigger a continuation rally toward ₹68+.
🧠 View:
Suzlon Energy is showing early signs of trend reversal after weeks of consolidation. A close above ₹61 with sustained volume can extend momentum toward ₹68, while ₹54 acts as key support.

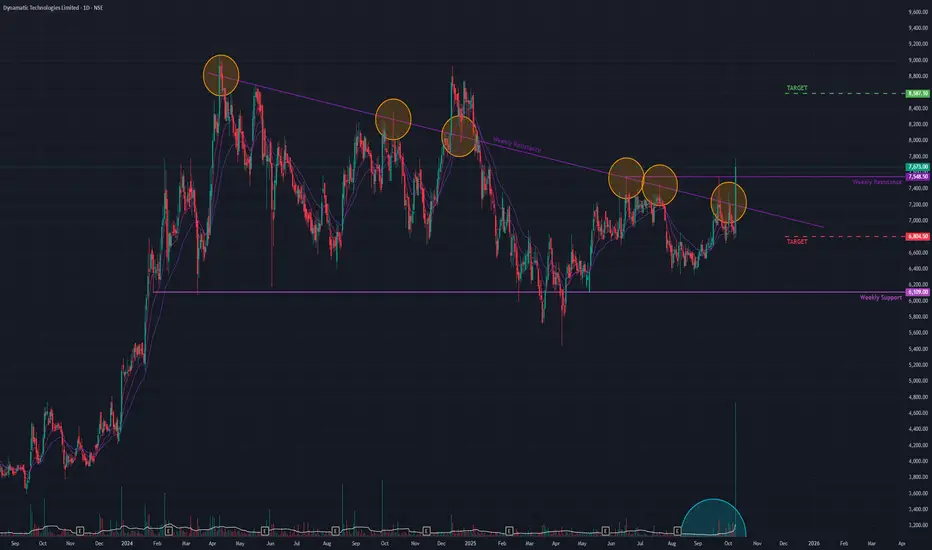
Dynamatic (D) - Double Breakout Signals Trend ContinuationAfter consolidating since its all-time high in April 2024, Dynamatic Technologies has delivered a powerful and technically significant breakout, suggesting its previous uptrend is ready to resume.
The Consolidation Pattern
For the past several months, the stock has been trading within a Triangle Pattern . This is a classic continuation pattern, indicating a pause in the trend rather than a reversal. While there have been several attempts to breach the upper descending trendline of this pattern in the past, all have failed, highlighting the strength of the resistance.
Today's Decisive Breakout
Today's session was exceptionally bullish and stands out from previous attempts for two key reasons:
1. Powerful Surge: The stock surged +12.19% , decisively breaking out of the triangle pattern's angular resistance.
2. Dual Confirmation: Critically, the move also pushed the stock's closing price above a key horizontal resistance level that has been in place since June 2025.
Breaking two distinct and significant resistance levels on the same day provides strong confirmation that this is a genuine breakout, not another "fakeout."
Outlook and Key Levels
With the consolidation phase likely over, the path of least resistance appears to be upward.
- Bullish Target: If this bullish momentum is sustained, the next logical target for the stock is the ₹8,590 level.
- Key Support: Should the momentum fade, the recently breached horizontal resistance near ₹6,800 is now expected to act as the primary support level.
The key confirmation to watch for in the coming days is sustained trading above the breakout zone. A successful retest of this area as support would further validate the bullish outlook.
Sigachi’s Technical Surge: Next Resistance in SightOver the past month, Sigachi traded within a well-defined consolidation range, reflecting a period of equilibrium between buyers and sellers. However, in the most recent week, the stock decisively broke out above this consolidation zone on increased trading volume a classic signal of renewed bullish momentum and heightened market interest.
From a trend perspective, the stock has managed to close above all key daily EMAs. Notably, a bullish crossover between the 20-day and 50-day EMAs has emerged, which is often interpreted by technical analysts as a sign of strengthening upward momentum.
Momentum indicators further reinforce this view. The RSI is currently above 75, placing the stock firmly in the overbought territory. While such elevated RSI levels can sometimes precede short-term corrections, they also reflect strong underlying demand during robust uptrends. This bullish sentiment is further supported by a MACD crossover on the weekly chart, which typically signals a continuation of upward price action.
At present, the stock is encountering a minor supply zone (as marked on the chart), which may serve as a near-term resistance. Should the price retrace and find support at the previously identified demand zone, the next potential resistance level is observed around ₹56 .
Disclaimer: This analysis is intended solely for educational and informational purposes. It does not constitute investment advice or a recommendation to buy, sell, or hold any financial instrument. Market conditions are dynamic, and trading decisions should be made based on individual research, risk tolerance, and consultation with a licensed financial advisor.

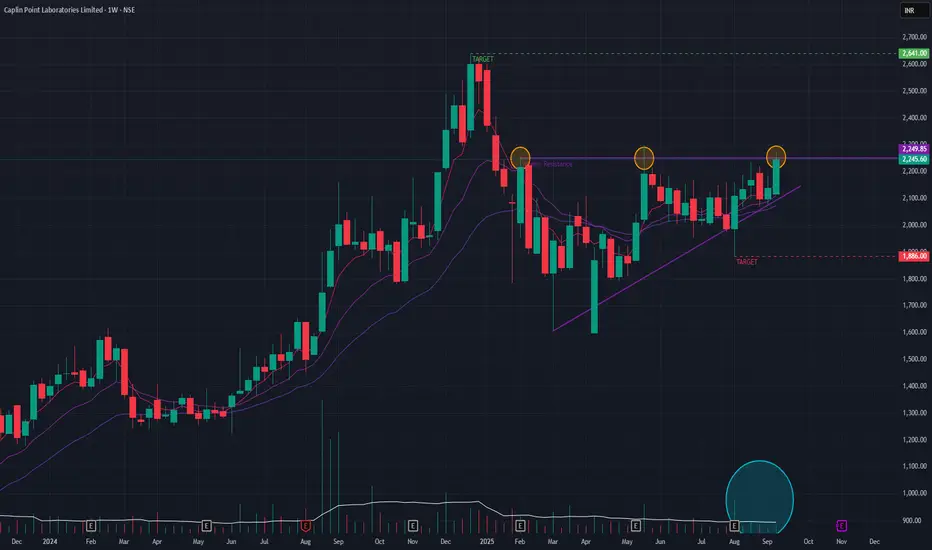
Caplin Point (Weekly Timeframe) - Will the uptrend continue ?After a brief downtrend, Caplin Point has formed a classic triangle pattern , which often acts as a continuation signal for the preceding long-term uptrend. Technical indicators are favorable, with the short-term EMAs arranged in a bullish formation that signals strong underlying momentum.
The one element of caution is that recent trading volumes have been average. Therefore, a breakout from the triangle must be accompanied by a significant increase in volume to validate buyer conviction. If such a breakout occurs, the next logical objective would be the all-time high, which also serves as a key resistance zone at ₹2640 . Conversely, if the pattern fails and momentum wanes, a pullback to the ₹1886 support level is possible.
Watchout for the price-action !!
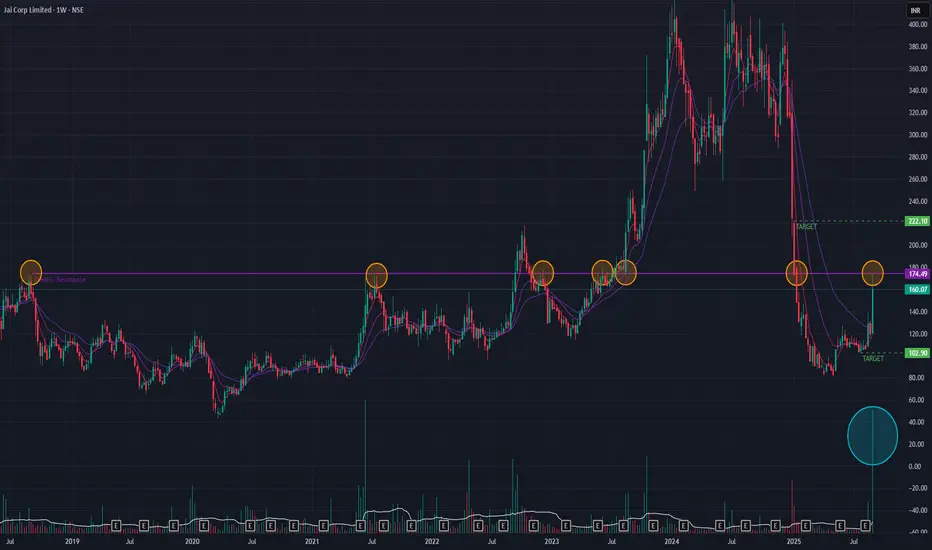
Jai Corp (Weekly Timeframe) - Is Jai on a bullish reversal?Overall the stock is in a sideways trend since 2009. The stock have been trying to Breakout of a major resistance but only succeeded once. Last week's stock spike accompanied with volume spike if sustained next week then it might be able to BreakOut of the resistance. The short-term EMAs are also in a Positive Cross-over state.
If the stock BreaksOut, then the upside target may be in the range of 222. If the stock is unable to BreakOut then on the downside we may expect it to go down to 102 range.
Keep monitoring the price-action during next week!!
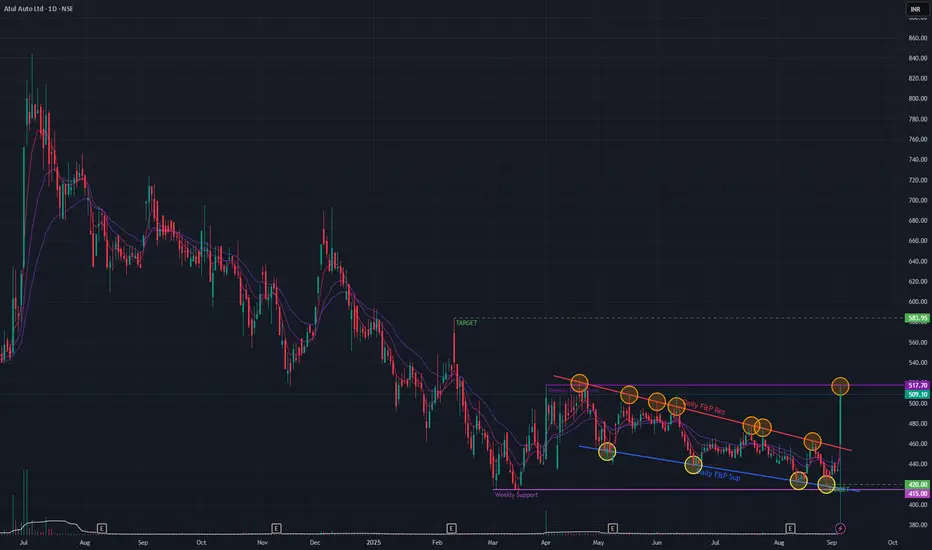
Atul Auto (Daily Timeframe) - Is it the Bullish reversal ??Atul Auto has been in a downtrend since the All Time High. Resistance & Support trendlines in the recent past has been respected well as marked. Today the stock BrokeOut of the angular trendline with a 17% spike and huge volume spurt. Currently the stock is encountering a key resistance.
Overall the stock is in a downtrend but a bullish divergence can be seen along with short-term EMAs in positive cross-over state. Till further positive price action, a bullish trend may not be foreseen.
If the stock moves in an uptrend then we might see the levels of 583 & in case of a downtrend we might see the levels of 420.
Keep monitoring!!
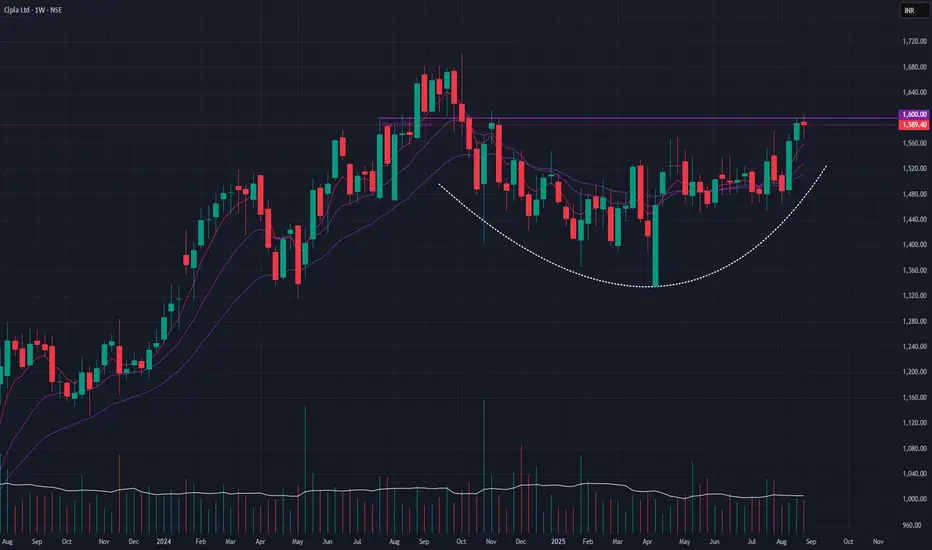
CIPLA (Weekly Timeframe) - Can it breakout ??Cipla has been in an accumulation stage for a while. Few attempts to breakout of the 1600 zone has not been successful. With EMAs in positive cross-over state, the stock looks to breakout of this key resistance zone. The volume is also OK in the past few weeks.
To be monitored on how it goes in the coming weeks.
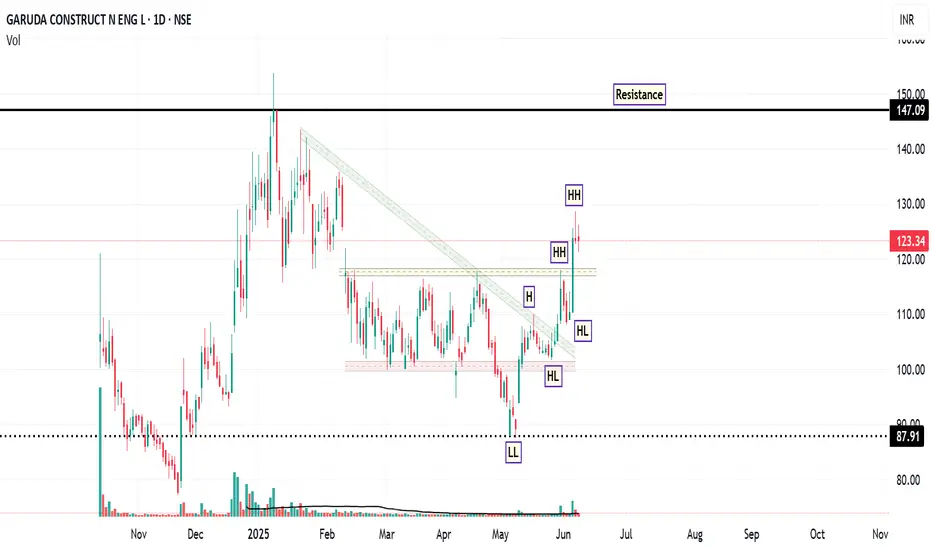
Garuda: Riding the Momentum WaveFrom February to late May 2025, the stock of GARUDA was trading in a sideways consolidation range, roughly between ₹100 (support) and ₹115-₹120 (resistance). The recent powerful green candles have shattered the upper boundary of this range. Also, the most significant event on the daily chart is the decisive breakout from a descending trendline that had capped prices. Also, LL and HH formation observed on daily chart.
The breakout was accompanied by a significant spike in volume ( 862.88K shares ), which is substantially higher than the average volume during the consolidation period. High volume on a breakout lends strong credibility to the move.
The RSI is at a strong 69.20 . It is in bullish territory and rising, indicating strong buying momentum. It is approaching the overbought region (>70), but is not there yet, leaving room for further upside before becoming extended.
If the stock consolidates above the ₹120-₹121 support level. Buyers step in on any minor dip till ₹118 , and the price then continues its upward trajectory towards the resistance targets of ₹129 and subsequently ₹149 .
Disclaimer: This technical analysis is for informational purposes only and should not be considered as financial advice. Trading in the stock market involves risk. Always conduct your own research and consult with a qualified financial advisor before making any investment decisions.
3rd july 2025 Nifty 50 trade plan levels
🔴 Upper Resistance Zones
25,830 – Above 10m Closing: Shot cover level
🔺 Strong resistance zone; if broken, short-sellers may start covering.
25,770 – Below 10m hold PE by Safe Zone
🔻 Safe zone for PE holders if price remains below this level.
🟠 Mid Resistance Zones
25,670 – Above 10m hold CE by entry level
🟢 If price sustains above this level, CE buying (bullish view) is favored.
25,600 – Below 10m hold PE by Risky Zone
⚠️ Below this, PE holders are at risk.
🟣 Key Intraday Sentiment Zone
25,520 – Above 10m hold positive trade view
📈 Market sentiment positive above this level.
25,500 – Below 10m hold negative trade view
📉 Market sentiment turns negative below this level.
⚫ Opening Support/Resistance
25,328 – Above Opening S1: 10m Hold CE by level
🟢 Support zone for CE holders.
25,300 – Below Opening R1: 10m Hold PE by level
🔻 Resistance zone for PE holders.
🟠 Lower Risk Zone
25,228 – Above 10m hold CE by Buy level
🟢 Strong buy level for CE if held.
25,200 – Below 10m hold PE by level
🔻 Risky level to hold PE below.
🟢 S upport/Unwinding Zone
25,092 – Above 10m hold CE by Safe Zone level
🛡️ Safe zone for bullish positions.
25,050 – Below 10m hold UNWINDING level
📉 If price drops below, expect unwinding pressure.

PepsiCo (PEP): A Potential Shift from Downtrend
Following a prolonged corrective phase that commenced in March 2025, PepsiCo's price action is exhibiting noteworthy signs of a potential bullish reversal. A significant breakout from a multi-week consolidation range on the daily timeframe suggests a possible shift from distribution to accumulation. This hypothesis is supported by strengthening momentum indicators and the reclamation of a key moving average, warranting a closer look at key technical levels.
Detailed Technical Analysis:
1. Price Action: Breakout from Consolidation
After establishing a clear downtrend, PEP entered a period of consolidation, forming a well-defined trading range with a base near the $127 level. Today's session saw a decisive breakout above the upper boundary of this range. Such a move often indicates an exhaustion of selling pressure and an influx of demand. For this bullish thesis to gain further conviction, continued closes above this breakout zone would be constructive. The quality of this breakout would be further substantiated by an accompanying surge in trading volume, which signals significant market participation.
2. Momentum Analysis: RSI Indicating Renewed Buying Interest
Daily RSI: The RSI on the daily chart has surged to 62. A move above the 60 level typically suggests that bullish momentum is accelerating and is now in a strong position.
Weekly RSI: On the weekly timeframe, the RSI has advanced above 42. While still below the key 50 midline, this upward trajectory from oversold territory indicates a notable waning of long-term bearish momentum and may be an early sign of a strengthening trend.
3. Trend Analysis: Reclamation of the 50 EMA
The stock has successfully achieved a close above its 50-Day EMA. This moving average is a widely watched indicator for the medium-term trend. For much of the recent downtrend, the 50 EMA acted as dynamic resistance. By reclaiming this level, it suggests a potential shift where it may now serve as dynamic support during any subsequent pullbacks.
Potential Forward Outlook & Key Levels to Monitor:
Primary Area of Resistance: The $143 zone stands out as the first significant technical hurdle. This level could coincide with prior price structure and may attract initial profit-taking from short-term traders.
Secondary Area of Resistance: Should the momentum carry the price decisively through the primary resistance, the next major level of interest appears to be around $158 . This area represents a more significant structural resistance from the preceding downtrend.
Area for Risk Management: The zone below $127 is a critical area to monitor. This level represents the floor of the recent consolidation base. A sustained break below this level would potentially invalidate the bullish breakout hypothesis and suggest a continuation of the prior downtrend.
Disclaimer: The information provided in this technical analysis is for informational and educational purposes only and should not be construed as financial or investment advice. It is an interpretation of historical price data and technical indicators. Market dynamics can change, and past performance is not indicative of future results. All trading and investment activities involve substantial risk. Always conduct your own thorough due diligence and consult with a qualified financial advisor before making any investment decisions.

Tirumalai: The Anatomy of a BreakoutOn the daily chart, TIRUMALCHM appears to be approaching a potential breakout from an ascending triangle pattern, a formation often associated with bullish continuation. Notably, the price has managed to close above all key EMAs, including the 200-day EMA, which is widely regarded as a long-term trend indicator.
From a momentum perspective, both the RSI and MACD indicators are showing strength on the daily and weekly timeframes. These signals may suggest the early stages of a sustained upward trend, contingent on broader market conditions and follow-through price action.
Given the current technical setup, the stock may be considered for gradual accumulation near the CMP. Alternatively, more conservative participants might prefer to wait for a potential retest of the breakout zone in the coming sessions, which could offer a more favourable risk-reward entry with a next long term resistance of ₹340 .
A technical invalidation level could be considered below the ₹251 mark, depending on individual risk tolerance and trading strategy.
Disclaimer: This analysis is intended solely for educational and informational purposes. It does not constitute investment advice or a recommendation to buy or sell any financial instrument. Market participants are strongly encouraged to conduct their own research or consult with a qualified financial advisor before making any investment decisions.

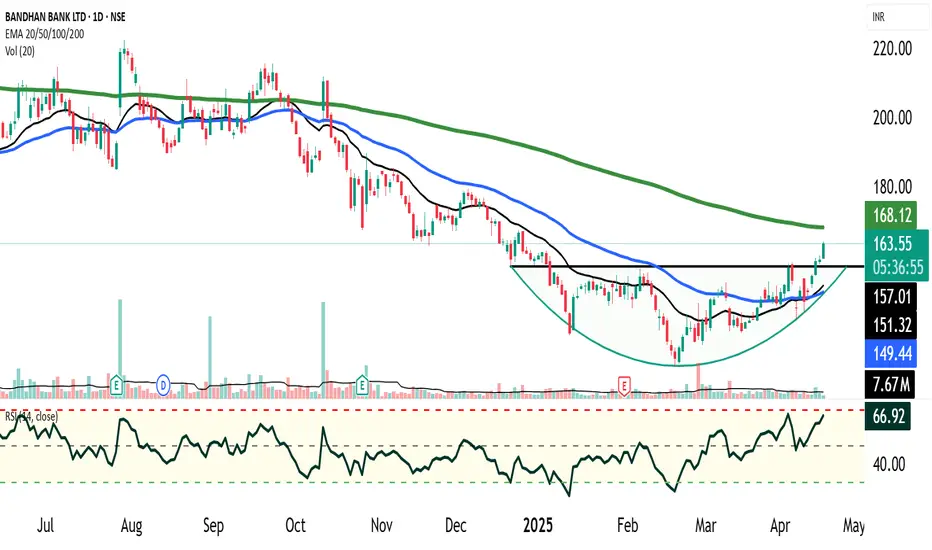
Bandhan Bank - Rounding Bottom Chart PatternBandhan Bank has recently formed a classic rounding bottom pattern after an extended long-term downtrend, indicating a potential shift in momentum from bearish to bullish. This basing structure suggests accumulation at lower levels and a possible trend reversal setup.
Pattern Activation: The rounding bottom pattern has triggered a breakout above the neckline resistance of ₹157, accompanied by a volume spike, confirming initial buyer interest and pattern validity.
Lack of Follow-Through Volume: Post-breakout, follow-through buying volume is missing, which raises caution. This could imply either a pause before further upside or an imminent retest of the breakout level around ₹157.
EMA Crossovers:
Bullish Crossover observed as the 20 EMA has crossed above the 50 EMA, suggesting improving short-to-medium term momentum.
However, price remains below the 200 EMA, signaling that the primary trend remains bearish. Sustained trading above the 200 EMA would be needed for confirmation of a longer-term trend reversal.
Risk Management & Strategy:
Cautious Optimism: While the breakout is promising, the stock remains under the long-term moving average and may face selling pressure at higher levels.
Retest Strategy: A pullback to ₹157 (neckline) could offer a low-risk entry point, especially if supported by bullish candlestick confirmation and renewed volume.
Staggered Investment Approach:
Do not park all your money in one go. : It is advised to invest in tranches, monitoring price action closely, especially near the 157–160 zone and at the 200 EMA level.
Conclusion:
Bandhan Bank is showing early signs of a technical base formation and potential trend reversal, but confirmation is pending due to lack of sustained volume and price being below the 200 EMA. The stock warrants close monitoring for a successful retest and possible breakout continuation. Investors should remain cautious, disciplined, and adopt a phased allocation strategy.
SERVOTECH: Volume Surge Signals StrengthAn analysis of the weekly chart for SERVOTECH indicates a noteworthy technical development. The security has exhibited a breakout above a key pivot level previously identified around the 148 price zone.
This price action was accompanied by a substantial volume surge. The weekly volume registered approximately 34 million shares, a figure representing a more than five-fold increase compared to its 50W moving average of volume. Such a significant expansion in volume on a breakout can suggest strong institutional interest and conviction behind the move.
Further supporting a bullish outlook of RSI is situated above the 60 level on both the weekly and daily timeframes. A confluence of strong RSI readings across multiple timeframes is often interpreted by market participants as a sign of robust and broad-based upward momentum.
Based on this technical structure, the following price levels may be of interest for observation:
From a strategic standpoint, the stock may present a potential accumulation zone around the 150 level. The 195 level is identifiable as the next area of potential overhead supply, or resistance, where selling pressure might emerge. From a risk management perspective, a breach of the 136 level could challenge the validity of the recent bullish structure and might be monitored accordingly.
Disclaimer: The information provided in this stock analysis is for informational and educational purposes only and should not be construed as financial advice. Always seek the advice of a qualified financial advisor or conduct your own thorough research before making any investment decisions. Market conditions are dynamic, and past performance is not indicative of future results.

JKLAKSHMI CEMENT - Bullish Inverted H&S Breakout (Daily T/F)Trade Setup
📌 Stock: JK Lakshmi Cement ( NSE:JKLAKSHMI )
📌 Trend: Strong Bullish Momentum
📌 Risk-Reward Ratio: 1:3 (Favorable)
🎯 Entry Zone: ₹862 (Breakout Confirmation)
🛑 Stop Loss: ₹807 (Daily Closing Basis) (~6.4% Risk)
🎯 Target Levels:
₹899.60
₹938.85
₹979.80
₹1,022.50 (Final Target)
Technical Rationale
✅ Bullish Inverted H&S Breakout - Classic reversal pattern confirming uptrend continuation
✅ Strong Momentum - Daily & Weekly RSI >60 (Bullish zone)
✅ Volume Confirmation - Breakout volume 376K vs previous day's 193K (Nearly 2x surge)
✅ Multi-Timeframe Alignment - Daily and weekly charts showing strength
Key Observations
• The breakout comes with significantly higher volume, validating strength
• Well-defined pattern with clear neckline breakout
• Conservative stop loss at recent swing low
Trade Management Strategy
• Consider partial profit booking at each target level
• Move stop loss to breakeven after Target 1 is achieved
• Trail stop loss to protect profits as price progresses
Disclaimer ⚠️
This analysis is strictly for educational purposes and should not be construed as financial advice. Trading in equities involves substantial risk of capital loss. Past performance is not indicative of future results. Always conduct your own research, consider your risk appetite, and consult a financial advisor before making any investment decisions. The author assumes no responsibility for any trading outcomes based on this information.
What do you think? Are you watching NSE:JKLAKSHMI for this breakout opportunity? Share your views in the comments!

Gic Housing Fin co., Looking good ; min 65 % Roi ; swingAdd this to watchlist and wait for entry.👁️🗨️
For short term investment ;
Leave a " Like If you agree ".👍
.
Wait for small retracement & daily candle to close above - "185".
Trade carefully untill ENTRY level.
.
Entry: 185 / 175
target:201-226-262-300-321
sl:167
major stoploss/ support: 160
.
.
Enter only if market Sustains above
"Yellow box" mentioned.
.
.
Don't make complicated trade set-up.📈📉
Keep it " simple, focus on consistency "💹
Refer our old ideas for accuracy rate🧑💻
Follow for daily updates👍
.
Refer old posted idea attached below.

RELIANCE INDUSTRIES - Bullish Flag & Pole Breakout (Daily T/F)Trade Setup
📌 Stock: Reliance Industries ( NSE:RELIANCE )
📌 Trend: Strong Bullish Momentum
📌 Risk-Reward Ratio: 1:3 (Favorable)
🎯 Entry Zone: ₹1454 (Breakout Confirmation)
🛑 Stop Loss: ₹1373 (Daily Closing Basis) (~5.6% Risk)
🎯 Target Levels:
₹1499.70
₹1546.85
₹1595.45
₹1648.50
₹1697.00 (Final Target)
Technical Rationale
✅ Bullish Flag & Pole Breakout - Classic bullish pattern confirming uptrend continuation
✅ Strong Momentum - Daily & Weekly RSI >60 (Bullish zone)
✅ Golden Crossover - 50 DEMA crossed above 200 DEMA
✅ Volume Confirmation - Breakout volume 20.18M vs previous day's 5.57M (Nearly 4x surge)
✅ Multi-Timeframe Alignment - Daily and weekly charts showing strength
Key Observations
• The breakout comes with significantly higher volume, validating strength
• Well-defined pattern with clear price & volume breakout
• Conservative stop loss at recent swing low
Trade Management Strategy
• Consider partial profit booking at each target level
• Move stop loss to breakeven after Target 1 is achieved
• Trail stop loss to protect profits as price progresses
Disclaimer ⚠️
This analysis is strictly for educational purposes and should not be construed as financial advice. Trading in equities involves substantial risk of capital loss. Past performance is not indicative of future results. Always conduct your own research, consider your risk appetite, and consult a financial advisor before making any investment decisions. The author assumes no responsibility for any trading outcomes based on this information.
What do you think? Are you watching NSE:RELIANCE for this breakout opportunity? Share your views in the comments!

Mangalore chemical:(Ready to shoot up); Take a look; Min 50% RoiHuge potential is there.
For short term investment ;
Leave a " Like If you agree ". 👍
.
.
Wait for Breakout & then Daily candle to close above - "135"
.
If you want to enter now "Go for it with stoploss".
.
.
Enter after Price Breaks
"Yellow box" mentioned.
.
Don't make complicated trade set-up.📈📉
Keep it " simple, focus on consistency " 💹
Refer our old ideas for accuracy rate🧑💻
Valuable comments are welcomed-✌️
.
Follow for regular updates.👍

SBI - Bullish Head and Shoulder patternState Bank of India (SBI) has completed the formation of a bullish inverse head and shoulders pattern on the daily chart — a strong technical indicator of trend reversal from bearish to bullish.
Neckline Breakout:
The pattern has confirmed a clean breakout above the neckline at ₹785, accompanied by rising volume, validating the breakout and signaling that buyers have taken control from sellers.
Support Structure:
Both the left and right shoulders of the pattern have been formed around the strong support zone of ₹725, further strengthening the reliability of this setup.
Candle Confirmation:
The head of the pattern was formed with a Morning Star candlestick pattern, a classic bullish reversal signal, reinforcing the likelihood of an upward move.
Volume Analysis:
During the formation of the head and shoulders pattern, volume was gradually declining, indicating healthy consolidation.
The volume spike at the breakout point adds conviction, showing renewed interest and participation by buyers.
Momentum & Moving Averages:
RSI (Relative Strength Index): RSI is trading above 60, indicating strong bullish momentum without yet entering overbought territory.
EMA Crossover: A bullish crossover has occurred, with the 20-day EMA crossing above the 50-day EMA, a classic trend continuation signal.
The positive slope of both EMAs supports a sustained uptrend.
Price Target & Risk Management:
Target (as per measurement rule): The price target is calculated by measuring the distance from the bottom of the head to the neckline and projecting that from the breakout point.
Estimated Upside Target: ₹880
Stop-Loss (SL) Options: Fixed SL: Below the right shoulder, around ₹730.
Trailing SL: Use the 50-day EMA to dynamically protect gains as the price moves higher.
Conclusion:
SBI is exhibiting a strong bullish setup, with confirmation from price action, volume, and momentum indicators. The inverse head and shoulders pattern breakout, supported by key technical signals like EMA crossover and RSI strength, indicates potential for a trend continuation to the upside. Long positions can be considered with a clear risk-reward structure.

#SARDAEN VCP Formation in DTF - Keep In WL 📊 Script: SARDAEN
Key highlights: 💡⚡
📈 VCP BreakOut in Daily chart.
📈 Price gave a good up move and consolidated before BO.
📈 Volume spike on Breakout
📈 MACD Cross Over
📈 One can go for Swing Trade.
BUY ONLY ABOVE 511 DCB
⏱️ C.M.P 📑💰- 506
🟢 Target 🎯🏆 – 20%
⚠️ Stoploss ☠️🚫 – 108
️⚠️ Important: Market conditions are not great, Paper Trade Only. Protect Capital Always
⚠️ Important: Always Exit the trade before any Event.
⚠️ Important: Always maintain your Risk & Reward Ratio.
✅Like and follow to never miss a new idea!✅
Disclaimer: I am not SEBI Registered Advisor. My posts are purely for training and educational purposes.
Eat🍜 Sleep😴 TradingView📈 Repeat 🔁
Happy learning with MMT. Cheers!🥂

Chola Fin co., Looking good ; min 20% Roi ; swingFor short term investment ;
Leave a " Like If you agree ". 👍
.
Wait for small retracement & daily candle to close above - "1260".
Trade carefully untill ENTRY level.
.
Entry: 1260
Target: 1430-1560
sl: 1199
major stoploss/ support: 1190
.
.
Enter only if market Breaks
"Yellow box" mentioned.
.
.
Don't make complicated trade set-up.📈📉
Keep it " simple, focus on consistency "💹
Refer our old ideas for accuracy rate🧑💻
Follow for daily updates👍
.
Refer old posted idea attached below.
