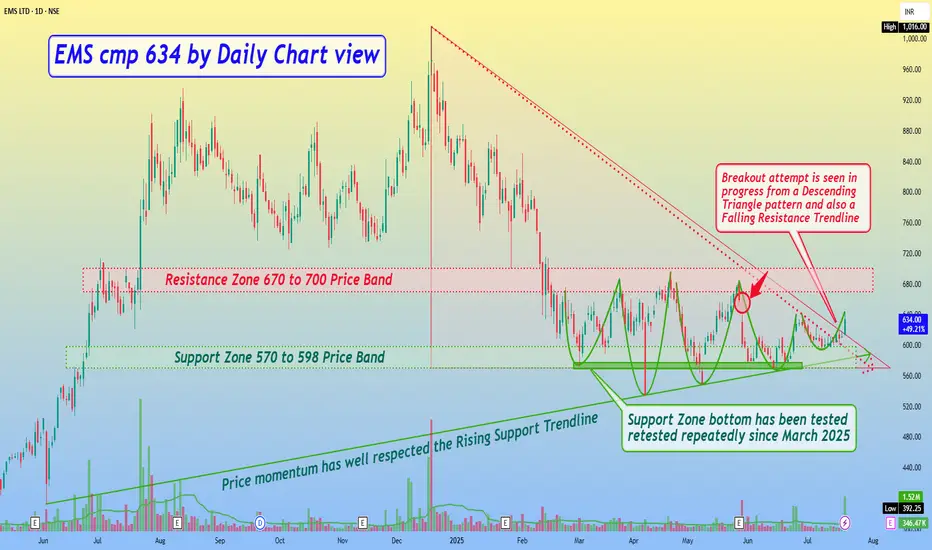
EMS cmp 634 by Daily Chart viewEMS cmp 634 by Daily Chart view
- Support Zone 570 to 598 Price Band
- Resistance Zone 670 to 700 Price Band
- Price momentum has well respected the Rising Support Trendline
- Support Zone bottom has been tested retested repeatedly since March 2025
- *Gap Down Opening of 29-May-2025 will act as tiny hurdle resistance crossing*
- Breakout attempt is seen in progress from a Descending Triangle pattern and also a Falling Resistance Trendline
EMS
Syrma SGS Tech. at Buy Breakout#Syrma SGS Technology Ltd. Breakout above 570 sustained closing basis. CMP 574.
Resistance 595/685. Expected Level 765. Mid-Long Term.
View negated below 519.
#TMPV #EMS #BreakoutStock #StockInvesting #SmartEye

Chainlink (LINK) – Momentum Shift with Strong EMA ReclaimLINK is showing a clear structural shift, having reclaimed both the 20-week and 200-week EMAs, signaling a potential transition from accumulation to expansion. The recent sweep of liquidity near $14 further strengthens the bullish case.
This setup provides a clean opportunity to enter on retracement to support, with solid upside if the momentum holds.
🔹 Entry Zone:
$13.00 – $13.50 (support + previous liquidity sweep zone)
🎯 Take Profit Targets:
🥇 $20 (HTF resistance)
🥈 $25 (macro range mid/high)
🥉 $30 (prior major resistance)
🛑 Stop Loss:
Daily close below $12.00 (structure invalidation)

Identifying Winning Sectors Before the Big MoveIn this video, we dive deep into how to identify winning sectors before they make their big moves—with a real-world case study on the EMS (Electronic Manufacturing Services) sector.
You'll learn:
How to spot early signs of sector strength using price action and volume.
Why the EMS sector is showing promising signs based on recent market behavior.
Whether you're a swing trader, positional investor, or just looking to sharpen your edge—this video will equip you with actionable insights to stay ahead of the curve.
⚠️ Important: Market conditions are getting better, Position size 20% per Trade. Protect Capital Always
⚠️ Important: Always Exit the trade before any Event.
⚠️ Important: Always maintain your Risk:Reward Ratio as 1:2, with this RR, you only need a 33% win rate to Breakeven.
✅Like and follow to never miss a new idea!✅
Disclaimer: I am not SEBI Registered Advisor. My posts are purely for training and educational purposes.
Eat🍜 Sleep😴 TradingView📈 Repeat 🔁
Happy learning with MMT. Cheers!🥂

EMS Ltd cmp 969 by Weekly Chart view since stock was listedEMS Ltd cmp 969 by Weekly Chart view since stock was listed
- Price Band 713 to 735 Support Zone
- Breakout is done from the Falling Resistance Channel
- Price has sustained above the Rising Support Trendline
- Volumes seen rising gradually over the past few weeks now
- Weekly Support at 785 > 646 > 533 with Resistance only at ATH 935

EMS LIMITED swing Idea....Positives
EMS LIMITED broke out ATH today.
Water management theme, Supporting theme.
negitives
Broader market heated up, breakouts may fail.
Note: No idea about fundamentals

EMS Ltd cmp 869.40 by Weekly Chart view since it was listedEMS Ltd cmp 869.40 by Weekly Chart view since it was liste*
- Price Band 71d to 735 Support Zone
- Rising Support Trendline is been sustained
- Volumes seen rising gradually over the past few weeks now
- Breakout Attempts in progress from Falling Resistance Channel
- Weekly basis Support at 785 > 646 > 533 with Resistance only at ATH 935

EMSLTDEMSLTD seems good to go long. As it rebounced from support zone. Also shown lesser participation while going down. This confirms the trend change!

EMS limited showing good strength on weekly chartsEMS limited- A recently listed Electronics manufacturing company is showing strength on weekly charts. After retracing from recent highs the price bounced from fibbonacci 23.6% levels and is looking prime to touch recent highs. A buy above 500 with stop of 420.

EMS hits new high, soars 16% in 2 days;EMS hits new high, soars 16% in 2 days; commands 46% premium to issue price
A combined 1.22 million equity shares representing 2.5 per cent of total equity of EMS have changed hands in first 25 minutes of trade on the NSE and BSE.
Shares of EMS hit a new high of Rs 322.20, as they rallied 6 per cent on the BSE in Friday’s intra-day trade on the back of heavy volumes. The stock of the company, engaged in water supply & management business, has soared 16 per cent in past two trading days.

BHCL SWING TRADEAs per the 4h chart the bullish candle in devloped at the support levels.
The RS indicating positive.
The RSI also indicating good strenght.
The Break out in smaller time frame.
The price at Moving avrage Support.
Entry : 111
SL : 106
T1 : 120
T2 : 128
