Bullish Engulfing Pattern🔎 Overview
Overview
The Bullish Engulfing Pattern is a strong price-action formation that appears after a decline or extended consolidation. It occurs when a large bullish candle completely engulfs the previous bearish candle, signaling a decisive shift in control from sellers to buyers. This pattern often reflects accumulation by stronger participants and can mark the early stage of a long-term market transition rather than a short-term reaction.
------------------------------------------------------------
📘 Concept – Bullish Engulfing
A Bullish Engulfing forms when:
• A small bearish candle is followed by a strong bullish candle
• The bullish candle’s body fully engulfs the previous bearish candle
This structure shows buyers stepping in decisively and overpowering sellers.
------------------------------------------------------------
🧭 How to Use
• Validation Line → If price holds and closes above the validation line, continuation strength is supported.
• Devalidation Line → If price closes below the devalidation line, the setup fails and weakness dominates.
------------------------------------------------------------
📊 Chart Explanation
1️⃣ Engulfing Formation
A strong bullish candle fully engulfs the prior bearish candle, signaling a momentum shift.
2️⃣ Protection Zone
The upper highlighted zone acts as a control area. Acceptance above this zone suggests follow-through potential.
3️⃣ Failure Zone
The lower zone defines risk. Price acceptance below this level invalidates the structure.
4️⃣ Price Reaction
Above the validation line → strength and continuation bias.
Below the devalidation line → loss of structure and failed setup.
------------------------------------------------------------
👀 Observation
• Engulfing patterns work best near support or after consolidation.
• Candle close is more important than intrabar movement.
• Structure confirmation improves reliability.
------------------------------------------------------------
📝 Summary
• Strong bullish candle absorbs prior selling
• Clear validation and failure zones define structure
• Confirmation depends on price acceptance, not prediction
------------------------------------------------------------
⚠️ Disclaime r
📘 For educational purposes only.
🙅 Not SEBI registered.
❌ Not a buy/sell recommendation.
🧠 Purely a learning resource.
📊 Not Financial Advice.
Engulfingpattern

Bullish Engulfing Pattern: Spotting Reversals with Discipline🔎 Intro / Overview
Managing risk is just as important as finding an entry. The Bullish Engulfing is one of the most effective candlestick patterns to identify potential reversals. When traded with discipline, it signals a shift from seller pressure to buyer control, helping traders time their entries with confidence.
📔 Concept
A Bullish Engulfing occurs when:
The first candle is a small red candle that continues the downtrend.
The next candle is a large green candle whose body completely engulfs the red candle’s body .
👉 This shows a clear psychological shift — sellers push lower (red candle), but buyers step in strongly (green candle) and reclaim control.
📌 How to Use
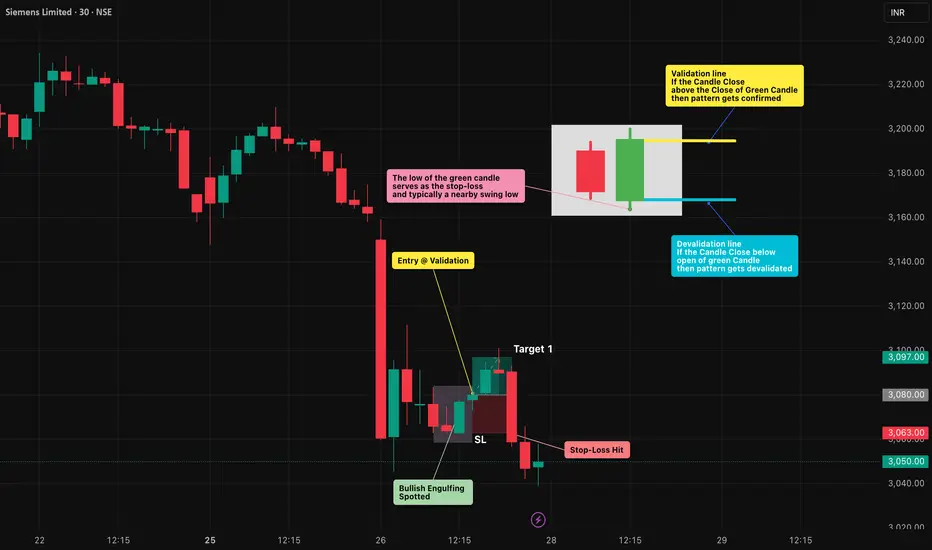
✅ Validation → The candle must close above the close of the green candle.
❌ Invalidation → If price closes below the open of the green candle before confirmation.
Trading Plan:
Entry → After confirmation of the green candle’s close.
Stop-Loss (SL) → Below the low of the green candle.
Take-Profit (TP) :
Conservative → 1R (Entry → SL distance)
Moderate → 2R
Aggressive → Book partial at 1R and trail the rest using tools like ATR, Fibonacci levels, or structure-based stops to ride any extended upside move.
📊 Chart Explanation
On the chart, the first small red candle shows sellers continuing the downtrend. The next large green candle completely engulfs the red candle’s body and closes higher — signaling that buyers have taken control.
The pattern was validated at the close of the green candle , where the long entry was taken. The low of the green candle is used as the stop-loss level, while the targets are mirrored in reverse using the same distance.
In this example, Stop-loss was quickly achieved . From there, traders can apply trailing stop methods to lock in profits and manage further upside targets.
👀 Observation
Most effective at support zones or after a prolonged downtrend .
A high-volume green candle adds conviction to the signal.
In sideways/choppy markets , it can produce false signals — always filter with structure and indicators.
❗ Why It Matters?
The red candle shows seller pressure .
The green candle shows buyer strength .
This clear shift in control creates a rule-based setup with defined entry, SL, and TP.
🎯 Conclusion
The Bullish Engulfing is a strong sign of reversal — but only when combined with structure, confirmation, and disciplined risk management.
🔥 Patterns don’t predict. Rules protect.
⚠️ Disclaimer
For educational purposes only · Not SEBI registered · Not a buy/sell recommendation · No investment advice — purely a learning resource
Bearish Engulfing Pattern: Spotting Reversals with Discipline🔎 Intro / Overview
Managing a trade after entry is just as important as finding the right setup. The Bearish Engulfing is one of the most reliable candlestick patterns to spot potential reversals. When traded with discipline, it helps you recognize momentum shifts early and manage risk objectively.
📔 Concept
A Bearish Engulfing occurs when:
The first candle is a small green candle that continues the uptrend.
The next candle is a large red candle whose body completely engulfs the green candle’s body .
👉 This shows a clear psychological shift — buyers push higher (green candle), but sellers step in aggressively (red candle) and erase those gains.
📌 How to Use
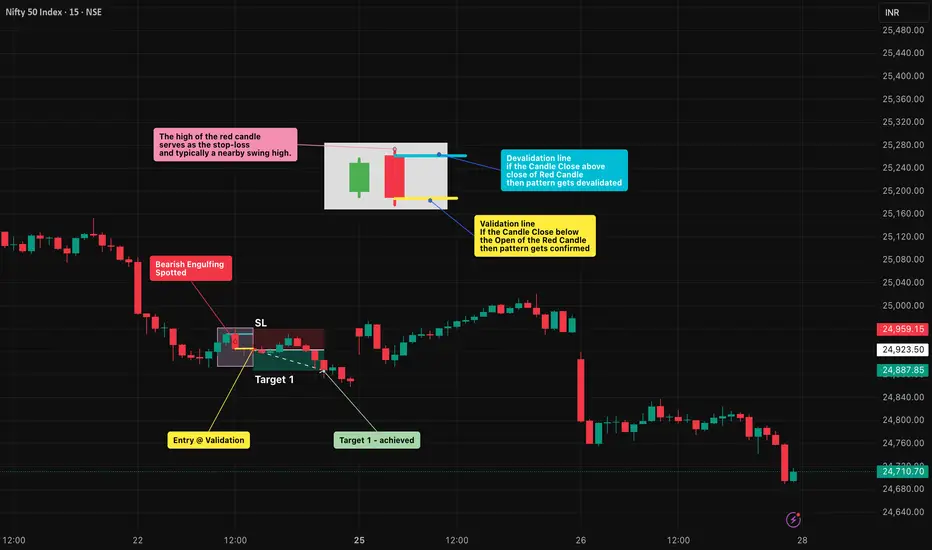
✅ Validation → The candle must close below the open of the red candle.
❌ Invalidation → If price closes above the close of the red candle before confirmation.
Trading Plan:
Entry → After confirmation of the red candle’s close.
Stop-Loss (SL) → Above the high of the red candle which is also a swing high.
Take-Profit (TP) :
Conservative → 1R (Entry → SL distance)
Moderate → 2R
Aggressive → Book partial at 1R and trail the rest using tools like ATR, Fibonacci levels, or structure-based stops to ride any extended downside move.
📊 Chart Explanation
On the chart, the first small green candle represents buyers continuing the uptrend. The next large red candle completely engulfs the green candle’s body and closes lower, signaling that sellers have taken control.
The pattern was validated at the close of the red candle , where the short entry was taken. The high of the red candle is used as the stop-loss level, while the targets are mirrored in reverse using the same distance.
In this example, Target 1 was quickly achieved . From there, traders can apply trailing stop methods to lock in profits and manage further downside targets.
👀 Observation
Works best when the pattern forms at major resistance levels or after a sustained uptrend .
A high-volume red candle strengthens the reliability of the signal.
In sideways or choppy conditions , false signals are common — always confirm with structure and indicators before acting.
❗ Why It Matters?
The green candle shows buyer optimism .
The red candle shows seller dominance .
This clear flip in control creates a rule-based setup with defined entry, SL, and TP.
🎯 Conclusion
The Bearish Engulfing is a strong sign of reversal — but it’s powerful only when combined with structure, confirmation, and disciplined risk management.
🔥 Patterns don’t predict. Rules protect.
⚠️ Disclaimer
For educational purposes only · Not SEBI registered · Not a buy/sell recommendation · No investment advice — purely a learning resource
My Favorite Reversal Candle Pattern (Works Like Magic!)Hello Traders!
What if I told you that one single candlestick pattern could give you an 80% win rate — when traded with the right context and strategy? That’s right! Today, we’re talking about the powerful Engulfing Candlestick Pattern — backed by data, tested across timeframes, and loved by price action traders.
Let’s break it down properly so you can spot it, trade it, and win with it.
The Candle Setup: Bullish & Bearish Engulfing Patterns
Bullish Engulfing Pattern:
This forms at the end of a downtrend or pullback . A strong green candle completely engulfs the previous red candle’s body, signaling a shift from sellers to buyers.
This setup is most effective at key support zones, trendline bounces, or bullish reversals with volume confirmation .
Bearish Engulfing Pattern:
Seen after an uptrend or rally . A solid red candle engulfs the previous green candle’s body, showing a shift from buyers to sellers.
Best used near resistance levels, psychological zones, or after a parabolic price move .
Check the chart above to understand better!
Note: I’ve used real chart examples from the past to demonstrate Bullish & Bearish Engulfing patterns exactly as they appear in price action textbooks — so you can recognize them with clarity and confidence.
How to Trade the Engulfing Candle Effectively
Entry:
Enter above the bullish engulfing candle’s high (long) or below the bearish engulfing candle’s low (short) after the candle closes.
Stop Loss:
Place SL just below the bullish engulfing candle's low or above the bearish candle’s high.
Target:
Use a 1:2 or 1:3 risk-reward ratio, or set targets based on nearby support/resistance or Fibonacci levels.
When to Use:
Only trade engulfing patterns when they form at a confluence zone — such as support/resistance, trendlines, moving averages, or breakout retests .
Backtesting Insights
When tested across Nifty 50, Bank Nifty, and large-cap stocks on the 15 min, 1H, and Daily charts , the Engulfing pattern — when combined with structure — showed up to 80% success rate with proper risk management and discipline.
Rahul’s Tip
Don’t blindly trade the pattern—trade the location! Context is everything. Always confirm with structure and volume. Engulfing candles are powerful, but only when they appear where it actually matters.
Conclusion
The Engulfing Candle is one of the most reliable patterns if traded with patience and planning. Combine it with key zones and risk control , and it can become a high-probability weapon in your trading arsenal.
Have you used this pattern before? Share your success (or lessons) in the comments — let’s grow together!

NIfty Expiry Day Special Analysis || Hero Zero Trading Day.Good Morning Traders,
Nifty done smart recovery in yesterday session and given closing above 19700, and formed a bullish candlestick pattern on daily chart, this pattern is indicating further upside can seen from here.
Let me explain a bit about bullish Engulfing Pattern to you guys'.
A bullish Engulfing is a two candlestick pattern where in a small red candle is followed by a large green candle that completely covers the previous day's red candle. It is considered a reversal pattern and formed after downtrend.
Well i think any dip will be a good opportunity accumulate in downside in nifty. On the Upper side, the resistance is situated at 19750. A clear breakout is necessary to anticipate a substantial rally in nifty. A decisive move beyond 19750 could potentially push Nifty towards 19900 levels. On the downside the support is established at 19550-19600 levels.
Important Levels for Nifty:-
Strong support zone 19550-19600
Strong resistance zone 19850-19900
Buy above 19767, if levels sustain at least for 15 mints.
Targets we can see in upside 19883/19884+
Keep stop loss at 19677
Sale below 19677, if levels sustain at least for 15 mints.
Targets we can see in downside 19588/19521
Keep stop loss at 19767
Note:- Hero Zero Trade will be in 2nd half somewhere 1:15pm. So, we will update in afternoon according to price action, so stick with us and follow us to get notity at right time. Till then enjoy but don't overtrade and Always wait for the best entry or levels to execute trades. And always follow strict stop loss to save your capital from unexpected market direction.
Disclaimer:- Please always do your own analysis or consult with your financial advisor before taking any kind of trades.
Dear traders, If you like my work then do not forget to hit like and follow me, and guy's let me know what do you think about this idea in comment box, i would be love to reply all of you guy's.
Thankyou.

Head and shoulders pattern NIFTYMarker reached all time high and got rejected. The selling pressure formed a bearish engulfing pattern at the top.
In the 15 TF head and shoulders pattern has formed and the break out is already done.
all the levels and analysis is only for educational purpose

Apollo Hospital Pro-gap Strategy from Breakout in DTFApollo Hospital has reacted from the pro gap with a bullish candle (engulfing pattern) and taking off from EMA 8 in DTF.
Entry to be taken at breakout of the Pro gap >= 4390
Stop Loss near = 4260
Target 1 = 4771 ( P/L 2.5:1)
With other targets as marked in the chart.
NSE:APOLLOHOSP
The investment is short term.

Head and Shoulder Pattern along With Bearish Engulfing Today in Bank Nifty
Today Bearish Engulfing took place which is a strong sign of negative trend.
Also in Daily chart,Head and Shoulder pattern formed
Downside breakout is expected as red candle is formed on the Neckline . Almost broke,.
Ready for a Big Fall...
*For Education Purpose Only

Nifty Futures (9 March)Nifty Futures (09 March)
Bullish engulfing candle stick pattern.
it would be a reversal sign.


DIXON FOR LONGDATE: 17/06/2021.
DIXON FORMS A VERY GOOD ASCENDING TRIANGULAR PATTERN.
AND TODAY IT ALSO FORMS A CLEAR BULLISH ENGULFING CANDLESTICK PATTERN.
FUNDAMENTALLY ALSO IT'S A FANTASTICK STOCK FOR LONG TERM INVESTMENT AND NOW IT HAS A GOOD BUYING OPPORTUNITY.
ALWAYS ADD IN DIPS....:)

POWER GRID CORP :)DATE:18/06/2021.
Powergrid has clear rsi bullish divergence in"1 hour time frame".
and also today it forms clear bullish engulfing represents buyers took charge
buy at 235
target at 243(3.80%)
stoploss at 230(1.90%)
C0NS: in 1D chart it has big bearish candle with increased volumes represents bearish trend in 1D chart but uptrend stock in long time.
FOLLOW ME for more updates :)

Two Candlestick Pattern - Bullish EngulfingA bullish engulfing pattern is a candlestick pattern that forms when a small Red candlestick is followed the next day by a large Green candlestick, the body of which completely overlaps or engulfs the body of the previous day’s candlestick.
Bullish engulfing patterns are more likely to signal reversals when they are preceded by four or more black candlesticks.
Investors should look not only to the two candlesticks which form the bullish engulfing pattern but also to the preceding candlesticks.
Limitations -
A bullish engulfing pattern can be a powerful signal, especially when combined with the current trend; however, they are not bullet-proof. Engulfing patterns are most useful following a clean downward price move as the pattern clearly shows the shift in momentum to the upside. If the price action is choppy, even if the price is rising overall, the significance of the engulfing pattern is diminished since it is a fairly common signal.
The engulfing or second candle may also be huge. This can leave a trader with a very large stop loss if they opt to trade the pattern. The potential reward from the trade may not justify the risk.
Establishing the potential reward can also be difficult with engulfing patterns, as candlesticks don't provide a price target. Instead, traders will need to use other methods, such as indicators or trend analysis, for selecting a price target or determining when to get out of a profitable trade.
Important Points-
The Green candlestick of a bullish engulfing pattern typically has a small upper wick, if any. That means the stock closed at or near its highest price, suggesting that the Candlestick Closed while the price was still surging upward.
This lack of an upper wick makes it more likely that the next candlestick will produce another Green candlestick that will close higher than the bullish engulfing pattern closed, though it’s also possible that the next day will produce a Red candlestick after gapping up at the opening. Because bullish engulfing patterns tend to signify trend reversals, analysts pay particular attention to them.
{Source - Investopedia.com}

Aarti ind shortAarti ind short
Bearish engulfing Candlestick pattern
Wait for close below 1680
Sell at- 1675
SL-1820
Target open
Disclaimer- We are not SEBI registered advisor.
Charts and views are only for educational purpose.

BPCLBPCL GIVE A BIG BULLISH ENGULFING PATTERN ON CHART NOW IT'S ON REVERSAL. NEXT TARGET 435, 445, 460. IF YOU GET PROFIT SO PLEASE LIKE AND FOLLOW FOR MORE UPDATE.

Triple Top on EURUSDShorted Triple top on eurusd with strong bearish engulfing candle on H1 and also same engulfing pattern is forming on H4.

Reliance longReliance Long
Bullish engulfing candle stick pattern found yesterday
single candle covered 100 day and 50 day ema
high made exactly at 2095 (20 day ema)
Buy above 2095
SL- 2020
Target- 2178, 2205, 2305
Disclaimer- We are not SEBI registered advisor.
Charts and views are only for educational purpose.


Change in polarity: When resistance becomes support1. Change in polarity spotted
2. Bullish engulfing pattern for re-entry
3. Trade on confirmation Only
**trade safe**

APPOLO HOSPITAL SELL AT 1735 STOP-LOSS AT 1810 TARGET 1580RSI DIVERGENCE WITH BEARISH ENGULFING PATTERN CONFIRMING A TOP SIGNALING BEARS MAY TAKE CONTROL FROM HERE AND WE MAY SAY A GOOD DOWNWARD RALLY.
APPOLO HOSPITAL SELL AT 1735 STOP-LOSS AT 1810 TARGET 1580
