Bullish Engulfing Pattern: Spotting Reversals with Discipline🔎 Intro / Overview
Managing risk is just as important as finding an entry. The Bullish Engulfing is one of the most effective candlestick patterns to identify potential reversals. When traded with discipline, it signals a shift from seller pressure to buyer control, helping traders time their entries with confidence.
📔 Concept
A Bullish Engulfing occurs when:
The first candle is a small red candle that continues the downtrend.
The next candle is a large green candle whose body completely engulfs the red candle’s body .
👉 This shows a clear psychological shift — sellers push lower (red candle), but buyers step in strongly (green candle) and reclaim control.
📌 How to Use
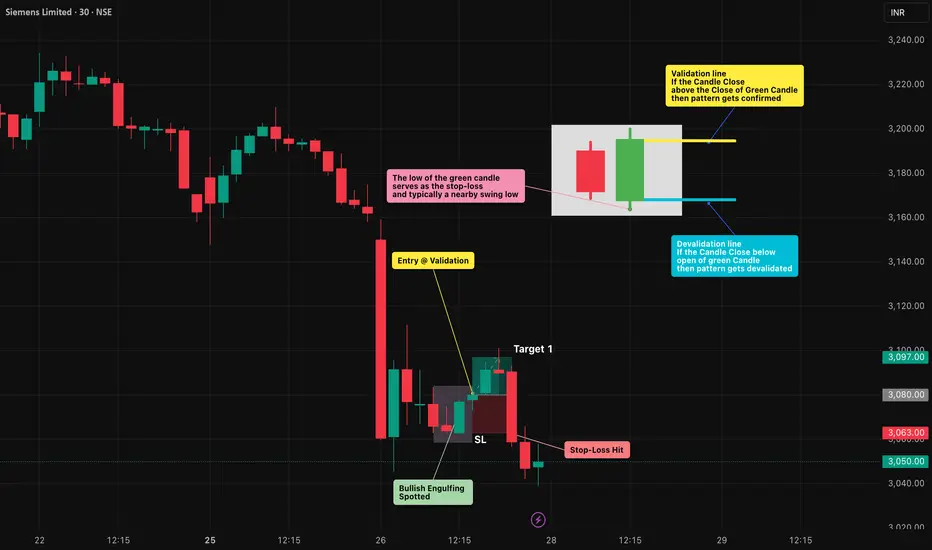
✅ Validation → The candle must close above the close of the green candle.
❌ Invalidation → If price closes below the open of the green candle before confirmation.
Trading Plan:
Entry → After confirmation of the green candle’s close.
Stop-Loss (SL) → Below the low of the green candle.
Take-Profit (TP) :
Conservative → 1R (Entry → SL distance)
Moderate → 2R
Aggressive → Book partial at 1R and trail the rest using tools like ATR, Fibonacci levels, or structure-based stops to ride any extended upside move.
📊 Chart Explanation
On the chart, the first small red candle shows sellers continuing the downtrend. The next large green candle completely engulfs the red candle’s body and closes higher — signaling that buyers have taken control.
The pattern was validated at the close of the green candle , where the long entry was taken. The low of the green candle is used as the stop-loss level, while the targets are mirrored in reverse using the same distance.
In this example, Stop-loss was quickly achieved . From there, traders can apply trailing stop methods to lock in profits and manage further upside targets.
👀 Observation
Most effective at support zones or after a prolonged downtrend .
A high-volume green candle adds conviction to the signal.
In sideways/choppy markets , it can produce false signals — always filter with structure and indicators.
❗ Why It Matters?
The red candle shows seller pressure .
The green candle shows buyer strength .
This clear shift in control creates a rule-based setup with defined entry, SL, and TP.
🎯 Conclusion
The Bullish Engulfing is a strong sign of reversal — but only when combined with structure, confirmation, and disciplined risk management.
🔥 Patterns don’t predict. Rules protect.
⚠️ Disclaimer
For educational purposes only · Not SEBI registered · Not a buy/sell recommendation · No investment advice — purely a learning resource
Engulfingpattern
Bearish Engulfing Pattern: Spotting Reversals with Discipline🔎 Intro / Overview
Managing a trade after entry is just as important as finding the right setup. The Bearish Engulfing is one of the most reliable candlestick patterns to spot potential reversals. When traded with discipline, it helps you recognize momentum shifts early and manage risk objectively.
📔 Concept
A Bearish Engulfing occurs when:
The first candle is a small green candle that continues the uptrend.
The next candle is a large red candle whose body completely engulfs the green candle’s body .
👉 This shows a clear psychological shift — buyers push higher (green candle), but sellers step in aggressively (red candle) and erase those gains.
📌 How to Use
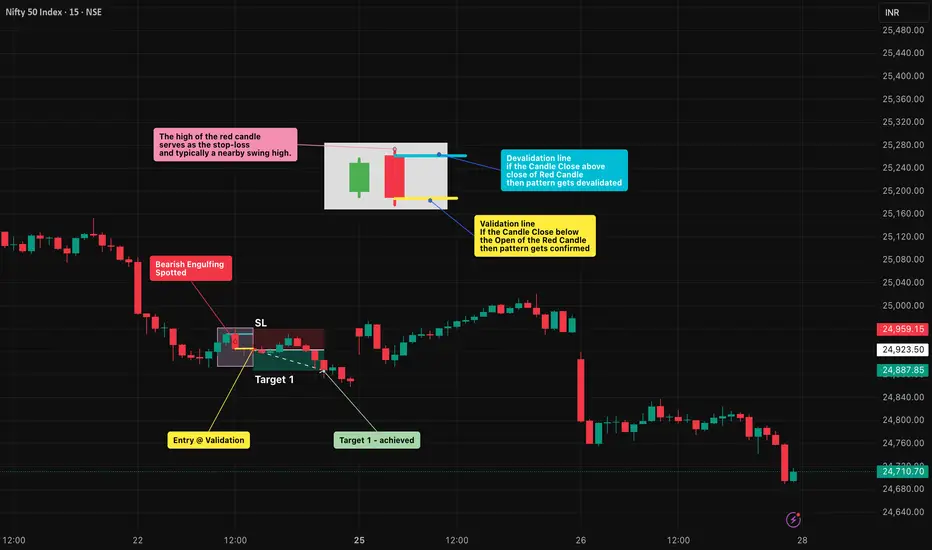
✅ Validation → The candle must close below the open of the red candle.
❌ Invalidation → If price closes above the close of the red candle before confirmation.
Trading Plan:
Entry → After confirmation of the red candle’s close.
Stop-Loss (SL) → Above the high of the red candle which is also a swing high.
Take-Profit (TP) :
Conservative → 1R (Entry → SL distance)
Moderate → 2R
Aggressive → Book partial at 1R and trail the rest using tools like ATR, Fibonacci levels, or structure-based stops to ride any extended downside move.
📊 Chart Explanation
On the chart, the first small green candle represents buyers continuing the uptrend. The next large red candle completely engulfs the green candle’s body and closes lower, signaling that sellers have taken control.
The pattern was validated at the close of the red candle , where the short entry was taken. The high of the red candle is used as the stop-loss level, while the targets are mirrored in reverse using the same distance.
In this example, Target 1 was quickly achieved . From there, traders can apply trailing stop methods to lock in profits and manage further downside targets.
👀 Observation
Works best when the pattern forms at major resistance levels or after a sustained uptrend .
A high-volume red candle strengthens the reliability of the signal.
In sideways or choppy conditions , false signals are common — always confirm with structure and indicators before acting.
❗ Why It Matters?
The green candle shows buyer optimism .
The red candle shows seller dominance .
This clear flip in control creates a rule-based setup with defined entry, SL, and TP.
🎯 Conclusion
The Bearish Engulfing is a strong sign of reversal — but it’s powerful only when combined with structure, confirmation, and disciplined risk management.
🔥 Patterns don’t predict. Rules protect.
⚠️ Disclaimer
For educational purposes only · Not SEBI registered · Not a buy/sell recommendation · No investment advice — purely a learning resource
My Favorite Reversal Candle Pattern (Works Like Magic!)Hello Traders!
What if I told you that one single candlestick pattern could give you an 80% win rate — when traded with the right context and strategy? That’s right! Today, we’re talking about the powerful Engulfing Candlestick Pattern — backed by data, tested across timeframes, and loved by price action traders.
Let’s break it down properly so you can spot it, trade it, and win with it.
The Candle Setup: Bullish & Bearish Engulfing Patterns
Bullish Engulfing Pattern:
This forms at the end of a downtrend or pullback . A strong green candle completely engulfs the previous red candle’s body, signaling a shift from sellers to buyers.
This setup is most effective at key support zones, trendline bounces, or bullish reversals with volume confirmation .
Bearish Engulfing Pattern:
Seen after an uptrend or rally . A solid red candle engulfs the previous green candle’s body, showing a shift from buyers to sellers.
Best used near resistance levels, psychological zones, or after a parabolic price move .
Check the chart above to understand better!
Note: I’ve used real chart examples from the past to demonstrate Bullish & Bearish Engulfing patterns exactly as they appear in price action textbooks — so you can recognize them with clarity and confidence.
How to Trade the Engulfing Candle Effectively
Entry:
Enter above the bullish engulfing candle’s high (long) or below the bearish engulfing candle’s low (short) after the candle closes.
Stop Loss:
Place SL just below the bullish engulfing candle's low or above the bearish candle’s high.
Target:
Use a 1:2 or 1:3 risk-reward ratio, or set targets based on nearby support/resistance or Fibonacci levels.
When to Use:
Only trade engulfing patterns when they form at a confluence zone — such as support/resistance, trendlines, moving averages, or breakout retests .
Backtesting Insights
When tested across Nifty 50, Bank Nifty, and large-cap stocks on the 15 min, 1H, and Daily charts , the Engulfing pattern — when combined with structure — showed up to 80% success rate with proper risk management and discipline.
Rahul’s Tip
Don’t blindly trade the pattern—trade the location! Context is everything. Always confirm with structure and volume. Engulfing candles are powerful, but only when they appear where it actually matters.
Conclusion
The Engulfing Candle is one of the most reliable patterns if traded with patience and planning. Combine it with key zones and risk control , and it can become a high-probability weapon in your trading arsenal.
Have you used this pattern before? Share your success (or lessons) in the comments — let’s grow together!

Two Candlestick Pattern - Bullish EngulfingA bullish engulfing pattern is a candlestick pattern that forms when a small Red candlestick is followed the next day by a large Green candlestick, the body of which completely overlaps or engulfs the body of the previous day’s candlestick.
Bullish engulfing patterns are more likely to signal reversals when they are preceded by four or more black candlesticks.
Investors should look not only to the two candlesticks which form the bullish engulfing pattern but also to the preceding candlesticks.
Limitations -
A bullish engulfing pattern can be a powerful signal, especially when combined with the current trend; however, they are not bullet-proof. Engulfing patterns are most useful following a clean downward price move as the pattern clearly shows the shift in momentum to the upside. If the price action is choppy, even if the price is rising overall, the significance of the engulfing pattern is diminished since it is a fairly common signal.
The engulfing or second candle may also be huge. This can leave a trader with a very large stop loss if they opt to trade the pattern. The potential reward from the trade may not justify the risk.
Establishing the potential reward can also be difficult with engulfing patterns, as candlesticks don't provide a price target. Instead, traders will need to use other methods, such as indicators or trend analysis, for selecting a price target or determining when to get out of a profitable trade.
Important Points-
The Green candlestick of a bullish engulfing pattern typically has a small upper wick, if any. That means the stock closed at or near its highest price, suggesting that the Candlestick Closed while the price was still surging upward.
This lack of an upper wick makes it more likely that the next candlestick will produce another Green candlestick that will close higher than the bullish engulfing pattern closed, though it’s also possible that the next day will produce a Red candlestick after gapping up at the opening. Because bullish engulfing patterns tend to signify trend reversals, analysts pay particular attention to them.
{Source - Investopedia.com}

ADANI PORTS - JOURNEY OF THE SINKING PORTGuys today we are going to discuss about Adani port initially I would would discuss how it was in a uptrend, there after I will show that how we could have identified that it will turn into a down Trend.
(Please open this post in a Separate Tab. And using mouse click on the chart and move cursor to the left to see the remaining part of the chart)
Adani port was in a uptrend starting from 2017 initially creating series of higher highs and Higher Lows.
In this chart, the first two are the base low and base high. The Lows and High thereafter created are used to draw trend lines / channel which is being followed.
The points of reversal have been highlighted along with corresponding pattern they are forming. The share followed a fixed channel for 11 Straight months. The details of Highs and Lows during these 11 months are as below: (refer chart as well)
Higher Low 1 – No Specific Pattern here. Normal reversal was here. Since we now have 2 Lows (Base Low and Higher Low) these are used to create a trend line .
Higher High 1 – The share was near its its historic resistance and created Hangman pattern (Reversal Pattern) and thereby reversed from here.
Higher Low 2 – The Share was near its Lower Channel and created an Inside Bar Pattern which indicated reversal. The share moving up thereafter.
Higher High 2 – The share was near Its upper channel and created a Doji (Confusion after a series of uptrend) near the resistance, which indicated Confusion after a series of uptrend. Traders were unsure whether the share will continue its upward trend or not and there share started reversing from here.
Higher Low 3 – The shared touched the lower channel and the immediately next candle made a Doji / Hammer but it was formed below the Lower Channel. Doji / Hammer indicates weakness in the ongoing trend. So, though share was trading below lower channel, same could not be considered as a breakdown. Also, the share reversed post this.
Higher High 3 – The share showed certain consolidation and confusion in the market. So no specific pattern formed here.
Higher Low 4 – In the process to make next Low. The share breached Channel and the next 2-3 candles including one big red candle) was formed below the channel thereby confirming breakdown. The share thereafter created Hammer Pattern and reversed from here.
Now although On First December it created a higher Low (which indicates uptrend) it gave a channel breakdown. Thereby giving hints of further breakdown. But Since we always follow multiple confirmations, we would not trade a simple breakdown and would require more surety to ensure the same.
The share further moved on make a Higher High 4 and reversed with Bearish Engulfing Pattern.
The share then continuously moved down and created a Lower Low. As mentioned in the first part, the first indication was the Channel Breakout and Lower Low gave the second confirmation of downfall coming up. Here we should rely on the confirmation and find a good level to short the share.
Since the share is near its crucial support, it would be correct to short this share if :
1. It breaks support with Volume
2. If reverses from Support, we should short near next resistance.
The share as expected took support of the major support at 350 and reversed from here creating a Bullish Belt Hold Pattern.
Since then the share has formed a channel between support and resistance and moving in between. Shorting near resistance and Going long near Support would have been a good strategy.
On 22nd the share broke the support with Volume , there confirming the further breakdown..
Historic Support and Resistance have great significance and such levels are always respected by the shares. Further double confirmation should be used while taking position.
Every person has different way of analyzing shares. Some follow Candlestick Patterns, Some follow trend-lines, some follow Elliot Wave and there is nothing wrong with any of these methods. Each of these methods is successful in their own and you need to believe in the strategy you believe and religiously follow it.
Just to hold onto your faith and continue with your strategy. Even the basic Candlestick patterns have the ability to reap you awesome results.
Thanks, i hope this is Helpful.
Keep sharing the list of shares you want an analysis on. Thanks :)
PS : All views welcomed if they intend a fruitful discussion. And If Warren Buffet says he still learns, who are we to say or believe that we know all. Lets learn together and Earn together.
#JOURNEYOFATRADE

WHAT HAPPENED WITH MARUTI? 10000 to 6800 Journey!Maruti reached its 52W high at 10,000 and has been faaling continuously since then. The way Maruti % fell shocked alot of people, However it was not all that difficult to determine the fall and I will share, how I proceeded and made money in Maruti 5.71% .
On 25 July, Maruti reached its prior top weeks high zone of 9900-10000 again. It was a good resistance and If it is broken with Good volumes, Maruti can go upto 12K-13K, The next day Maruti reversed from the resistance zone and created a Double Top (as shown in the chart), also the Day Candle formed a Bearish Engulfing Pattern which indicates the start of the downfall.
Double Top Pattern is a fairly successful pattern and Share is expected to reach the neckline at 8200-8300 zones before changing its direction.
Maruti immediately the next day formed a large 500 points Bearish Candle which gave me good profits, And I continued waiting for my Initial target of 8200 (Neckline). In the meanwhile share gave a lot of green candles, But I since I was already in profits, I had margin of bear some green Candles.
Each time Maruti showed a couple of green candle, a Big Red candle wiped out gains forming Bearish Engulfing Pattern repetitively, which posted my confidence. Share reached up to 9000 after that Rose 250 points.
I though of squaring off position but the prior experience showed that there has not been 3 consecutive green candles in the past 9 months, So I decided to wait for the next day. Maruti reversed and showed red candles for the next 3 days and formed a 3 Blacks Crows pattern, which is sign of huge fall coming.
Near 14 September One Gap Up for formed, but the next day there was a Gap Down thereby forming a Evening Star Pattern.
On 19 September, Share finally reached my initial target of 8200 after I squared off and decided to play a LONG STRANGLE, to up my possibilities of winning. I took a Put and a Call at 3% Difference.
Soon The share broke the neckline and started to go more downwards, I squared up my call and waited for gains in Put.
Every person has different way of Analyzing. But the idea is to hold onto your faith and continue with your strategy. Even the basic Candlestick patterns have the ability to reap you awesome results.
Thanks, i hope this is Helpful.
Keep sharing the list of shares you want an analysis on. Thanks :)
