EOSUSDT - FACES RESISTANCE - IS A DOWNTURN ON THE HORIZON?Symbol - EOSUSDT
CMP - 0.820
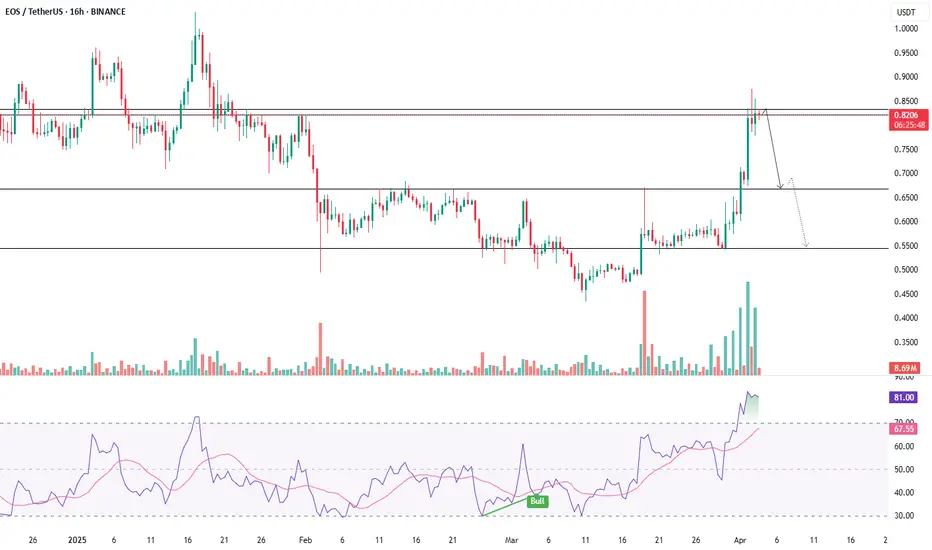
EOSUSDT has reached key resistance within the consolidation range of 0.54 - 0.60, where it has formed a false breakdown, signaling a lack of potential for further upward movement. The broader cryptocurrency market is currently displaying signs of weakness, exacerbated by yesterday’s speech by President Trump and the subsequent approval of new tariffs, which have introduced additional risks and pressure on the market. Following a rally, Bitcoin has returned to a negative trend, while altcoins are continuing to seek new lows. EOSUSDT, however, has shown notable strength, suggesting that its recent price movement may be part of a countertrend accumulation strategy aimed at capturing liquidity within the 0.7 – 0.8 range. This distribution pattern is further characterized by a false breakout within the 0.82 – 0.86 range.
Key resistance levels: 0.820, 0.860
Key support levels: 0.793, 0.666
If bearish pressure manages to maintain resistance between 0.82 – 0.86 and the consolidation below this range culminates in a breakout at 0.793, followed by price consolidation in the selling zone, a potential reversal and decline towards key zones of interest - such as the FVG, 0.64, and 0.541 - could occur.
Eosusdtechnicalanalysis
EOS/USDT : Bullish Momentum in Sight Amidst Correction ?
In this technical analysis, we delve into the EOS/USDT trading pair to identify potential opportunities for traders.
1. Correction/Resistance Area - 0.775 - 0.785:
Currently, EOS/USDT is encountering a significant correction/resistance area between 0.775 and 0.785. This range has historically posed challenges for the pair, limiting further upward movement.
Traders should closely monitor price action within this zone as it could offer valuable insights into the potential market direction.
2. Price Expectations - Buying Opportunity at 0.650:
Based on our analysis, we anticipate a corrective movement in EOS/USDT, leading the price to retrace towards the 0.650 level.
This retracement presents an attractive buying opportunity for those looking to build positions or add to their existing holdings.
3. Invalidation Point - 0.800 - 0.820 Breakout:
Traders must exercise caution and vigilance as the price approaches the 0.800 - 0.820 range. A sustained breakout above this level could indicate a significant shift in momentum, signaling a bullish trend for EOS/USDT.
plan your trade and trade your plan.


Eosusdt Daily. looking bearishBullish structure broke down from price 2.70 which was a critical level.
Reasons:
1. Rsi divergence
2. Price broke down and made lower high
3. Fib level confluence at 2.70 to 2.10

EOSUSDT Daily looking bearish.EOSUSDT Daily.
2.9390 is a strong resistance if that resistance 2.93 and 3.18 rejects price to up word then we will see another bottom at 1.63 till Jun 15/2020.
Reasons:
1. Price following through a narrow parabolic channel.
2. Price is still making lower low on HTF.
3. Assuming Rsi will be at overbought condition when price reaches to resistance zone 2.93.
