Equity Market Trends: An In-Depth Analysis1. Defining Equity Market Trends
At its core, an equity market trend refers to the general direction in which stock prices move over a period. These trends can be upward (bullish), downward (bearish), or sideways (neutral/consolidation). Bullish trends indicate sustained buying pressure, reflecting optimism about the economy or specific sectors. Conversely, bearish trends signify prolonged selling pressure, often triggered by negative economic signals, corporate earnings disappointments, or geopolitical tensions. Sideways trends occur when the market fluctuates within a range without a clear directional bias, often reflecting indecision among investors.
Trends are influenced by a combination of fundamental, technical, and behavioral factors. While fundamental factors relate to corporate earnings, macroeconomic indicators, and monetary policies, technical factors focus on price patterns, moving averages, and market volumes. Behavioral factors capture investor psychology, herd behavior, and sentiment-driven trading.
2. Historical Trends and Market Cycles
Historically, equity markets exhibit cyclicality. Markets move in long-term secular trends, lasting several years, superimposed with short-term cyclical fluctuations driven by economic and corporate cycles. For instance, the post-World War II era saw sustained growth in global equities, punctuated by periods of correction during recessions, oil crises, and financial meltdowns such as the 2008 Global Financial Crisis.
Equity markets often follow the four phases of market cycles:
Accumulation Phase: Smart money or institutional investors begin buying stocks at undervalued levels.
Mark-Up Phase: Rising prices attract broader participation, leading to bullish trends.
Distribution Phase: Early investors start booking profits, slowing growth.
Mark-Down Phase: Pessimism prevails, resulting in sustained declines.
Recognizing these phases helps investors anticipate trend reversals and manage risk effectively.
3. Key Drivers of Equity Market Trends
Equity trends are shaped by a multitude of interconnected factors:
a. Macroeconomic Indicators
Economic indicators such as GDP growth, inflation, interest rates, unemployment, and industrial production heavily influence stock market trends. For example, strong GDP growth and low unemployment generally foster bullish sentiment. Conversely, rising inflation or tightening interest rates may trigger bearish trends as borrowing costs increase and corporate profits are pressured.
b. Corporate Earnings
Earnings growth is a primary determinant of stock performance. Consistently strong earnings growth supports rising stock prices, while disappointing results can trigger corrections. Investors often rely on forward-looking earnings estimates to gauge potential market directions.
c. Monetary and Fiscal Policy
Central bank policies, including interest rate adjustments and quantitative easing, directly impact equity markets. Lower interest rates reduce borrowing costs, making equities more attractive relative to fixed-income securities. Similarly, fiscal stimulus measures, such as tax cuts or government spending, can boost investor confidence and drive market rallies.
d. Global Events
Equity markets are increasingly interconnected. Geopolitical tensions, trade wars, pandemics, and technological disruptions can create volatility. For example, the COVID-19 pandemic caused a sharp market sell-off in early 2020, followed by an unprecedented recovery fueled by global stimulus.
e. Sectoral Trends
Not all sectors move in unison. Technology, healthcare, energy, and financials often exhibit independent trends based on sector-specific developments. Investors track sector rotation strategies to capitalize on these divergences, moving capital from overvalued sectors to those with higher growth potential.
4. Technical Analysis and Trend Identification
Technical analysis plays a critical role in identifying and confirming market trends. Common tools include:
Moving Averages: Indicators like the 50-day and 200-day moving averages help identify bullish or bearish momentum. A crossover between short-term and long-term averages often signals trend reversals.
Trendlines and Channels: Connecting price highs and lows visually highlights the market’s direction.
Momentum Indicators: Tools like RSI (Relative Strength Index) and MACD (Moving Average Convergence Divergence) help assess whether the market is overbought or oversold.
Volume Analysis: High trading volumes during price increases suggest trend strength, while low volumes may indicate weakening momentum.
Technical analysis provides insights into entry and exit points, trend duration, and potential reversals, complementing fundamental analysis.
5. Investor Behavior and Sentiment
Equity trends are also heavily influenced by behavioral finance. Psychological factors, such as fear, greed, and herd mentality, often exaggerate market movements. For instance:
Fear-driven sell-offs can lead to panic-induced bearish trends.
Speculative bubbles form when optimism drives overvaluation, as seen during the dot-com bubble of the late 1990s.
Market sentiment indicators, such as the VIX (Volatility Index), measure investor anxiety and help anticipate trend shifts.
Understanding sentiment allows investors to make contrarian moves, buying during pessimism and selling during irrational exuberance.
6. Recent Equity Market Trends
In the past decade, global equity markets have exhibited several notable trends:
Technology-led Bull Market: Growth in digitalization, cloud computing, and AI has fueled long-term bullish trends in technology stocks.
Sustainable and ESG Investing: Increasing focus on environmental, social, and governance factors has shifted capital toward sustainable investments, impacting sector trends.
Market Volatility: Geopolitical tensions, inflationary pressures, and interest rate cycles have resulted in alternating bullish and bearish phases.
Retail Investor Influence: Platforms enabling easy stock trading have introduced new dynamics, contributing to rapid price swings and short-term trends.
Emerging trends include AI-driven investment strategies, algorithmic trading, and growing interest in thematic and global ETFs, further diversifying equity market behavior.
7. Risk Management in Trending Markets
While trends offer opportunities, they also carry risks:
Trend Reversals: Markets can suddenly reverse due to economic shocks or geopolitical events, causing significant losses.
Overvaluation: Extended bullish trends may lead to asset bubbles.
Liquidity Risks: Sudden sell-offs can strain liquidity, especially in small-cap stocks.
Investors manage these risks through diversification, hedging strategies, and systematic monitoring of trend indicators. Setting stop-loss limits and maintaining a balanced portfolio are essential for capital preservation.
8. Conclusion
Equity market trends are a dynamic interplay of economic fundamentals, corporate performance, investor sentiment, and global events. Understanding these trends requires a holistic approach that combines macro analysis, technical tools, behavioral insights, and risk management. Long-term success in equities depends on recognizing the market cycle, tracking macroeconomic shifts, and identifying sector-specific opportunities.
While trends offer avenues for wealth creation, they demand disciplined investment strategies, continuous learning, and the ability to adapt to changing market conditions. With globalization, technological innovation, and increasing retail participation, equity market trends are becoming more complex, volatile, and interconnected, presenting both opportunities and challenges for investors worldwide.
In essence, equity market trends are not just about price movements—they are reflections of economic realities, corporate health, investor psychology, and global dynamics. By studying trends rigorously, investors can navigate the uncertainties of the market, capitalize on growth opportunities, and safeguard their investments against volatility. In the modern financial ecosystem, staying attuned to equity market trends is both an art and a science, requiring analytical acumen, emotional discipline, and strategic foresight.
Equity

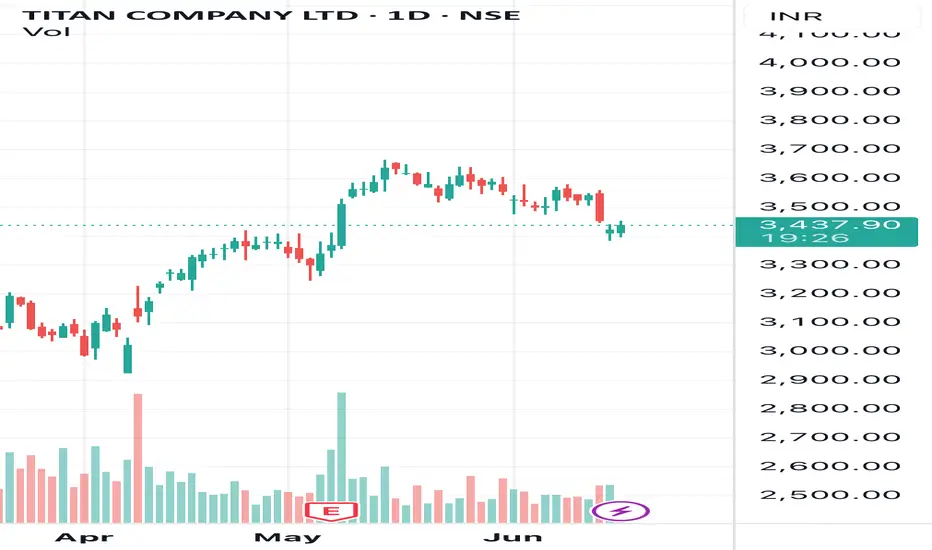
Technical Analysis (TITAN - Daily Chart):📊 Trend and Candle Pattern:
• The stock showed strong recovery between March and April.
• There was a bullish rally from April to May, reaching highs above 3600.
• After hitting resistance, it has seen a minor correction and is now trading around 3436.40.
🔴 Moving Average (Likely 200-DMA):
• The red line on the chart appears to be the 200-day moving average (DMA), which is currently at 3385.91.
• The current price is above the 200-DMA, indicating that the stock remains in a bullish zone.
• If the price falls below 3385, it may signal weakness or a trend reversal.
🧱 Support and Resistance:
• Immediate Support: 3385 (200 DMA)
• Major Support: Around 3300
• Resistance Zone: 3600–3650 (recent highs)
📈 Performance:
• The stock has shown a 5.80% gain, indicating positive momentum over the recent period.
⸻
📌 Conclusion:
• As long as the price remains above the 200-DMA (3385), the trend is bullish, and traders can consider a “buy on dips” strategy.
• A close below 3385 could trigger further downside.
• The current trend appears to be sideways to mildly bullish.
Note : not a buying or selling recommendation only for education purposes
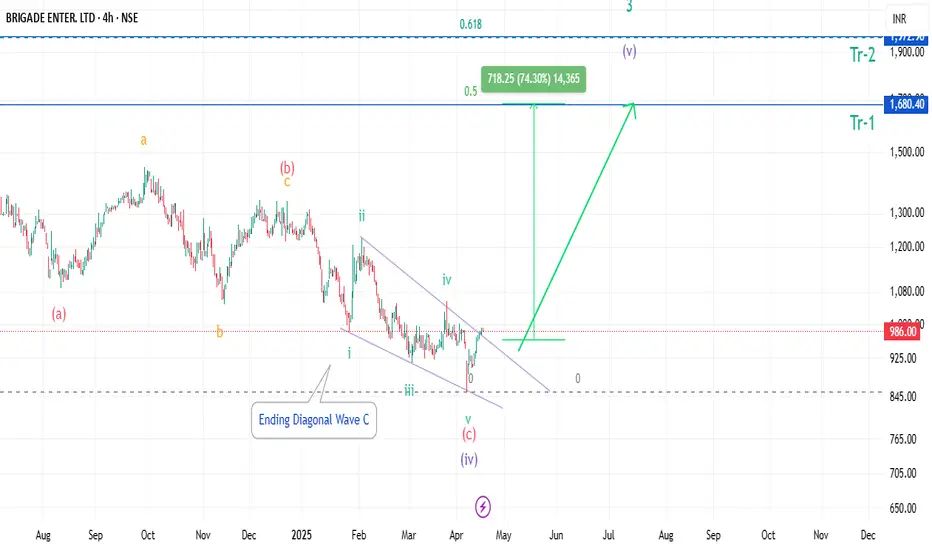
Brigade Ent falling wedge Breakout.Brigade Enterprises has made a falling wedge or ending Diagonal pattern, its near breakout. As per Elliott wave the Correction looks Complete, good for short-term Buy,
This Idea is shared purely on Technical basis,
Fundamental parameters are not considered,
take entry on your own risk.
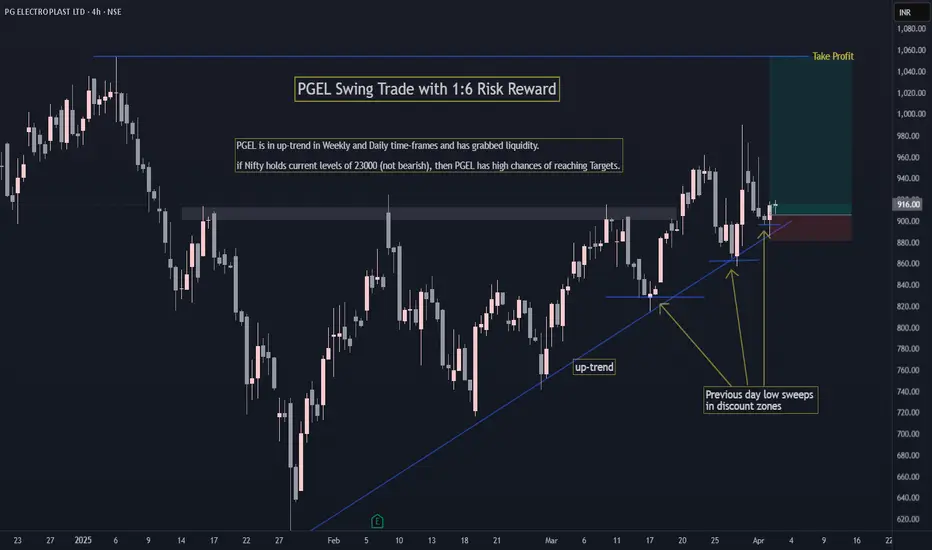
PGEL Swing Trade with 1:6 RRPGEL is in up-trend in Weekly and Daily time-frames.
It has grabbed liquidity from previous day low.
1:6 Risk to Reward. (on a safer side you can take 1:5 RR trade by increasing your SL a bit).
if Nifty holds current levels of 23000 (ie. not bearish), then PGEL has high chances of reaching Targets.
Happy trading!
MOIL LEVELS 08.12.2024MOIL forming inverse heading and shoulder pattern, once it's come right shoulder (retracement)
@ 310-320 buying opportunity target will be 350- 410
Stop Loss 280 @ Daily candle closing basis
(DYOR)

Nifty 50 Gap fill doneNifty 50 Gap fill done. 23900 is important support.
Index under pressure due to IT Sector.
DXY has cooled off.

NESTLEIND looks good for swing tradeAs shown in the chart, the price was previously coming down every time it was touching its resistance line. But recently, it has broken its resistance and took support on the same resistance line and formed an inverted head-and-shoulders pattern, which is a bullish-reversal signal. So, these all are suggesting that NESTLEIND is ready for the next bullish move.

Stock of the day for 19 August Markets I make educational content videos for swing / positional trading

2000 Days Pattern breakout in Whirlpool I make educational content videos for swing / positional trading

SWING IDEA - GRASIMGrasim Industries , a prominent player in the Indian conglomerate landscape, presents an intriguing prospect for swing traders, as evidenced by a convergence of technical factors signaling a potential upward rally.
Reasons are listed below :
The repeated testing of the 2175 level underscores its significance as a critical support/resistance zone. With the recent breach accompanied by strong candle activity, the stage is set for a significant market movement.
A bullish engulfing candle, spanning daily price action over the past two months, serves as a powerful signal of bullish momentum, marking a pivotal juncture for traders.
The presence of the 50-day Exponential Moving Average (EMA) as a support level on the daily timeframe adds further credence to the bullish outlook.
Elevated trading volumes serve as a corroborating factor, indicating heightened market participation and conviction behind the price movement.
The recent breakout from a two-month consolidation phase signifies a significant shift in market dynamics. Such breakouts often herald the onset of a new trend or the resumption of an existing one, presenting lucrative opportunities for traders to capitalize on directional movements.
The consistent formation of higher highs underscores the underlying strength of the uptrend. This pattern of ascending peaks reaffirms the prevailing bullish trajectory, offering traders confidence in the sustainability of the upward momentum.
Target - 2360 // 2575
Stoploss - Daily close below 2045
DISCLAIMER -
Decisions to buy, sell, hold or trade in securities, commodities and other investments involve risk and are best made based on the advice of qualified financial professionals. Any trading in securities or other investments involves a risk of substantial losses. The practice of "Day Trading" involves particularly high risks and can cause you to lose substantial sums of money. Before undertaking any trading program, you should consult a qualified financial professional. Please consider carefully whether such trading is suitable for you in light of your financial condition and ability to bear financial risks. Under no circumstances shall we be liable for any loss or damage you or anyone else incurs as a result of any trading or investment activity that you or anyone else engages in based on any information or material you receive through TradingView or our services.
@visionary.growth.insights

SWING IDEA - HFCLHFCL emerges as an attractive swing trade prospect, combining technical strength, breakthrough dynamics, and heightened market participation. Traders eyeing potential opportunities should keep a keen eye on these developments, as HFCL navigates its path in the market.
Reasons are stated below :
After enduring multiple tests at the 92 levels, HFCL has successfully broken through, signifying a notable shift in market sentiment.
A noteworthy spike in trading volumes accompanied the breakthrough, underscoring heightened market interest and potential sustained momentum.
The stock is exhibiting a pattern of forming higher highs, a crucial sign of an ascending trend and an encouraging signal for traders.
A strong bullish candle on the weekly timeframe serves as a powerful breakout signal, further affirming the positive trajectory for HFCL.
Adding to the bullish narrative, HFCL exhibits a robust 900-day consolidation, reflecting stability and resilience in the face of market fluctuations.
Target - 121 // 153
StopLoss - weekly close below 82
DISCLAIMER -
Decisions to buy, sell, hold or trade in securities, commodities and other investments involve risk and are best made based on the advice of qualified financial professionals. Any trading in securities or other investments involves a risk of substantial losses. The practice of "Day Trading" involves particularly high risks and can cause you to lose substantial sums of money. Before undertaking any trading program, you should consult a qualified financial professional. Please consider carefully whether such trading is suitable for you in light of your financial condition and ability to bear financial risks. Under no circumstances shall we be liable for any loss or damage you or anyone else incurs as a result of any trading or investment activity that you or anyone else engages in based on any information or material you receive through TradingView or our services.
@visionary.growth.insights

PKTEA was give good breakout with volume.PKTEA was give good breakout with volume. lets see next moves of stock.
Educational purposes only


GTLINFRA is give good Price Moves.GTLINFRA is give good Price Moves. and its last 3-4 Qtr results was good . Most probability its break consolidation face and resistance. lets see next Moves.
Educational Purpose only.

Make sure add "LGBFORGE" in your Watch list.Because , in "LGBFORGE" previous month Volume and Price movement is solid . Most probability its consolidation face is over in future week and months.. lets see Next Qtr results , if Qtr result will good so high probabilities for take entry in bullish Stock.
Educational purposes only.

MICEL is give good moves.MICEL is give good moves. Current and previous month is solid performing. But for enter in stock my suggestions is retest and wait for 9 EMA and 20 EMA for better price. and plus point is its QTR result is solid .
Educational purpose only

RS Software Is Bullish in long term.RS Software Is Bullish in long term. Because QTR result are solid and its give Good Rally in Previous months , currently its take successfully reset and high probability for Bull continuation . Lets see what is next moves of Stock.
Education Purpose Only..

Good Breakout stock for 28 June markets I daily make educational content videos for swing / positional trading

SWING IDEA - RAIN INDUSTRIESRain Industries has emerged as an intriguing prospect, presenting a compelling case for a potential upswing.
Reasons are listed below :
Rain Industries has established a sturdy support base at the 145 level, providing a solid foundation for potential upward movement.
The weekly timeframe reveals a bullish engulfing candle, signaling a potential shift in sentiment and setting the stage for a positive trend reversal.
A bullish marubozu candle on the daily chart further strengthens the bullish case, indicating strong buying interest and potential momentum in the short term.
The stock is bouncing back from the golden Fibonacci zone, adding a technical aspect to the trade setup and reinforcing the probability of a favorable price movement.
The uptick in trading volumes is a positive indicator, suggesting growing market interest and participation in Rain Industries.
Despite highs shifting down, the absence of new lows is a noteworthy observation, hinting at a potential reversal and the resilience of the stock in the face of downward pressure.
Target - 184 // 206 // 253
StopLoss - weekly close below 145

SWING IDEA - WELSPUN LIVINGWelspun Living , a company engaged in the home textiles and furnishings sector, presents a potential swing buying opportunity based on several technical factors.
Reasons are listed below :
The repeated testing of the 155-165 zone suggests the establishment of a robust support/resistance level. A potential breakout from this range could signify a notable market movement.
Head and shoulders patterns are often seen as trend reversal patterns. In this case, if there's a head and shoulders pattern forming, and if it's confirmed with a breakout, it could indicate a reversal from a downward trend to an upward trend.
An engulfing candle formed in weekly timeframe followed by a doji candle typically indicates a potential continuation in the prevailing market trend.
Breakouts from long-term consolidation zones can lead to significant price movements, as they indicate a shift in market sentiment and a breakout from a period of indecision.
Consistently forming higher highs is a characteristic of an uptrend and suggests that buyers are in control of the market.
Increased trading volume can confirm the strength of a price movement. If volumes are increasing as the price moves higher, it suggests strong buying interest.
Target - 185 // 215 // 255
Stoploss - weekly close below 137
DISCLAIMER -
Decisions to buy, sell, hold or trade in securities, commodities and other investments involve risk and are best made based on the advice of qualified financial professionals. Any trading in securities or other investments involves a risk of substantial losses. The practice of "Day Trading" involves particularly high risks and can cause you to lose substantial sums of money. Before undertaking any trading program, you should consult a qualified financial professional. Please consider carefully whether such trading is suitable for you in light of your financial condition and ability to bear financial risks. Under no circumstances shall we be liable for any loss or damage you or anyone else incurs as a result of any trading or investment activity that you or anyone else engages in based on any information or material you receive through TradingView or our services.
@visionary.growth.insights

Kotak: Short term reversal (6 May onwards)On this Daily Chart, we can see that Kotak has made a recent swing low of 1546 on Friday after losing support from its 1650 level. The results were out yesterday and Kotak has announced 26% increase in profits beating the market estimates. This should potentially cause a reversal in price going forward. In the short term, price is likely to touch the 200D SMA (purple line) which also coincides with a trend line (in blue) creating an upside of about 15% from current levels.
Indicators:
1. The EPS chart shows solid growth while the P/E is almost at a decadal low of 16.9
2. The RSI has bottomed out both in the Daily and Weekly
3. The price hit the lower threshold band of Fibonacci Bollinger Band (solid green line) indicating a possible bottoming out of price
4. The price is currently below both the 50D and 200D SMA, indicating short term bearish territory
Risks: The current downtrend can also continue in the next week and the next visible support is at 1450 implying a downside of 6%
Strategy: Given the growth drivers and a ridiculous valuation of the bank, the price is sure to make a reversal in coming days. Watch for the price action on Monday, and based on lower time frame price action, take entry. If the price comes down, towards 1450 levels, it should be used as an opportunity to build more positions instead of thinking about Stop loss and exiting.
Happy Trading!

3 Amazing Weekly swing trading ideas for 29 April Markets I make educational content videos for swing / positional trading

SWING IDEA - JKLAKSHMI CEMENTJK Lakshmi Cement , a key player in the cement industry, is currently exhibiting compelling signals that shouldn't be overlooked. In conclusion, stock's technical landscape is painting a promising picture for prospective investors.
Reasons are listed below :
The stock has undergone multiple tests at the critical 890 levels, showcasing resilience and now displaying a promising attempt to break through.
Over the past 7 weeks, stock has demonstrated robust consolidation at its all-time high, indicating a solid foundation for potential upward movement.
A clear bullish trend is evident as the stock continues to establish higher highs, signifying positive momentum and growing investor confidence.
The stock is currently trading above both the 50-day and 200-day EMAs, affirming the continuity of the prevailing uptrend.
Target - 1069 // 1158
Stoploss - weekly close below 819
