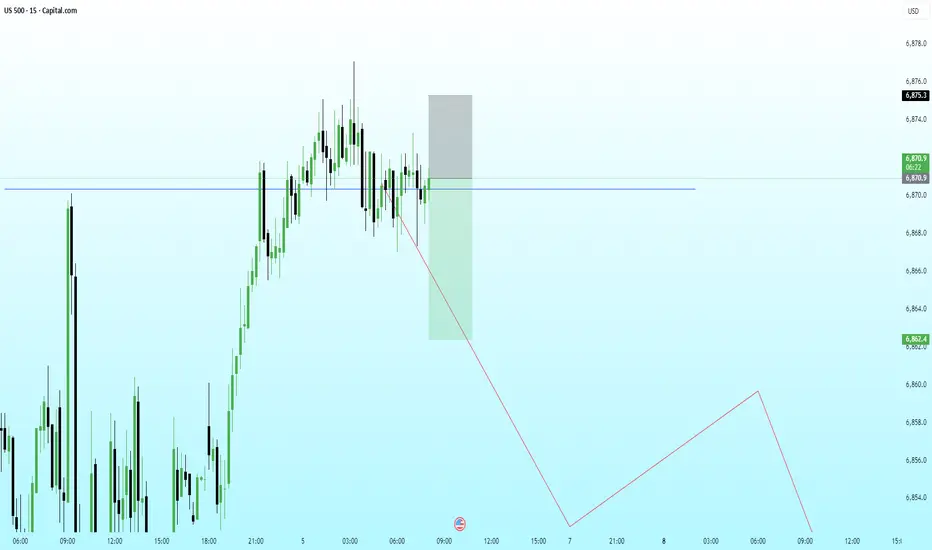
US500 – Clean Retest of Broken Structure With Bearish ContinuatiPrice has retested the broken structure level (blue line) and is now reacting inside a premium zone, suggesting sellers may re-enter the market from this region. The consolidation and repeated rejections indicate absorption of buy-side pressure.
With HTF context still pointing toward a deeper correction, this LTF retest offers a potential distribution setup before a continuation lower toward the next major liquidity pocket.
Bearish Path:
• Retest of the broken structure
• Reaction from premium supply zone
• LTF breakdown and structure shift
• Continuation toward downside liquidity + inefficiencies below
Es1
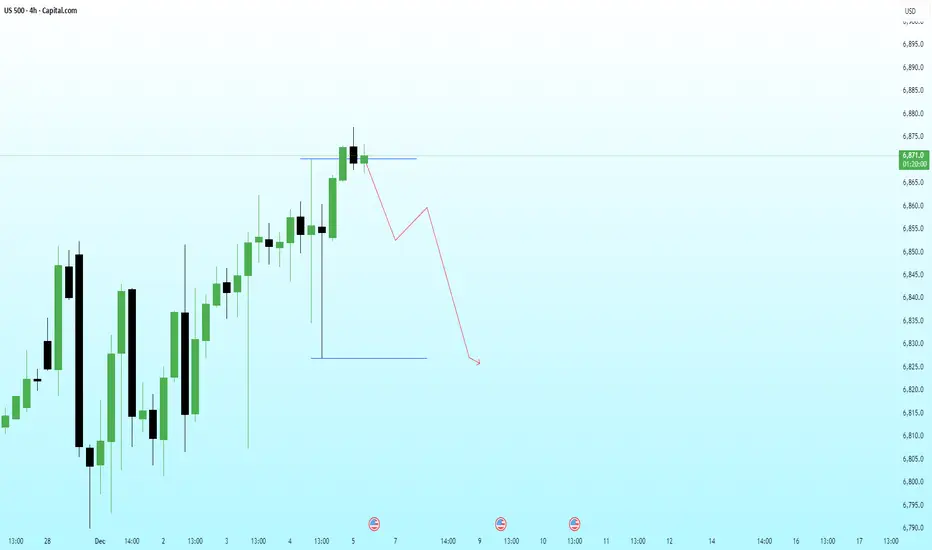
US500 – Liquidity Sweep at the Highs With Bearish Continuation PPrice has swept the immediate buy-side liquidity sitting above the recent high and is already showing signs of exhaustion. The reaction suggests a possible distribution phase forming near the top, aligning with the broader HTF narrative for a corrective leg.
If price fails to reclaim the swept high, the next logical target becomes the sell-side liquidity resting at the lower blue line.
Bearish Path:
• Sweep of the highs
• Failure to sustain above the level
• LTF shift into bearish structure
• Continuation toward downside liquidity + imbalance fill
⚠️ ENTRY CONDITION (IMPORTANT):
I will execute this trade only if the LTF replicates the structural behavior I expect from the HTF.
No LTF confirmation = No trade.
ES1- Reversal After Extended SelloffPrice has experienced a clean, directional drop with consistent Sell signals and EMA slope confirmation.
Current Buy signal has appeared near potential support, offering a short-term reversal watch.
EMAs still show downward pressure, so caution is warranted until breakout confirmation occurs.
🔍 Educational Setup Observation:
Observed Entry Zone: Near 6,408.00
Stop Level: Below 6,399.25 (below structural low)
Potential Target Area: 6,442.75 — prior imbalance and reaction zone
🧠 SignalPro Highlights:
This is the first Buy signal after a strong sell sequence — often used as a potential momentum shift marker.
Short-term reversal setups like this often require clear candle confirmation above moving averages to validate direction.
⚠️ This chart and setup is for educational purposes only. It is not financial advice. Always conduct your own due diligence and apply proper risk management.

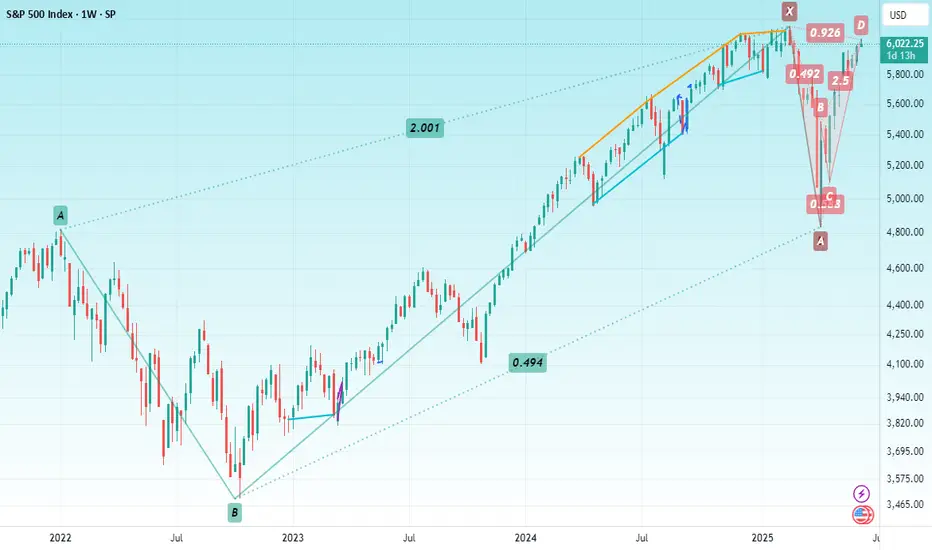
S&P 500Hello & welcome to this analysis
After making a monthly time frame Bullish Harmonic Reciprocal ABCD in April, the index has now formed a Bearish Harmonic Bat in daily time frame.
A pullback till 5800 - 5750 should not be ruled out as long as its below 6100
All the best
Falling wedge in S&P 500 4H chartS&P 500 index futures has completed a falling wedge on 4H chart. Falling wedge is a reversal signal and indicates lack of strength in the bears. Hence, we may see price correct back to 50MA (red line) and the wedge high of 3739.
We will watch for price action as it touches the 50MA. If the price reverses and bears come back at 50MA, bullish bet would be called off. If not, bulls are strong and 3739 becomes a fair possibility.

SPX Triangle breakout possible.SPX looks like an impulse up unfolding from this swing low.
Buy on triangle breakout or preferably after a retest dip..
SL 3721, Target ATH

ES is in its final leg to bottom out around 4085-4075The S&P is in its 5th wave from the high of 4327, nearing the confluence target area of 4085-4075.
Ideally wait till the entire 5th wave is complete (all the subwaves) and wait for a reversal to take a low risk entry.
Targets can be the mid 4200s.
New idea will be updated there

ES emini wave analysis from 3693 lowThis whole rise has from 3693 low (yes, not the actual low at 3639. Refer: wave 5 truncation) has been a 3 wave move so far.
Wave 1/A has been a clear 5 wave followed by an extended 3/C wave with the iii of 3 extension.
The 3/C wave ended with wave 5 as an ending diagonal.
Now, the fall from the absolute high of 4327 has been impulsive so far with a series of 1-2-i-ii.
The first target post a completion of 5 waves up is the range of the 4th wave of lower degree. This comes at 4113-4080.
This level also coincides with the 0.382 retracement of the entire rise from 3723.
Given that the entire move from the top is impulsive, we can expect a minimum of a 5-3-5 correction. After that is done, we can evaluate if it evolves into a further decline, or pushes towards a new high.
Summary: Target - 4080. Further decline to be evaluated based on the evolving structure after that.
-ansible/entropy

S&P500 Index analysis with vixplosion, and vixcrush. What is ViXplosion & ViXcrush?
ViXplosion is a phase during which the VIX rises and ViXcrush is a phase during which VIX cools off.
The last ViXplosion was triggered on 06-04-2022 and the latest ViXcrush was triggered on 16-06-2022.

ES1 Short 4140 - 4050Downtrend HVN near 4100. Confluence of descending channel in red line. 0.382 Fib also present here. Also acceptance back into prior ascending channel reference here blue line.

SPX - AnticipationI expect this index to do this PA for the rest of the year if the situations are not too grim..
A good amount of relief, even tag new ATH before getting a good amount of further correction.
Can be wrong (duh), NFA

S&P 500 As per Price & Time Square We are expecting 4300 near before 22nd April
This is purely based on PriceTime Square

Dow Jones 26 Feb 2020 - Indian Traders & Worldwide Traders As asked by many Indian and overseas traders about Dow Jones. I updated live on social media platforms that a big bear hammer is going to strike dow jones in this week.
As I post dow jones is trading = 27410 with a low at 27402.
Support for dow = 27219-27402
Expectation
Low hit today evening or early morning tomorrow , range bound session could continue for 24 hours
My trade
I'm trying to buy this dip

S&P 500 E-MINI FUTURES: Still no signs of exhaustionOn Daily, 4 Hour, 2 hour, all timeframes, E-mini doesnt seem to have exhausted at all.
Close below 2662 can be the first sign of exhaustion...
