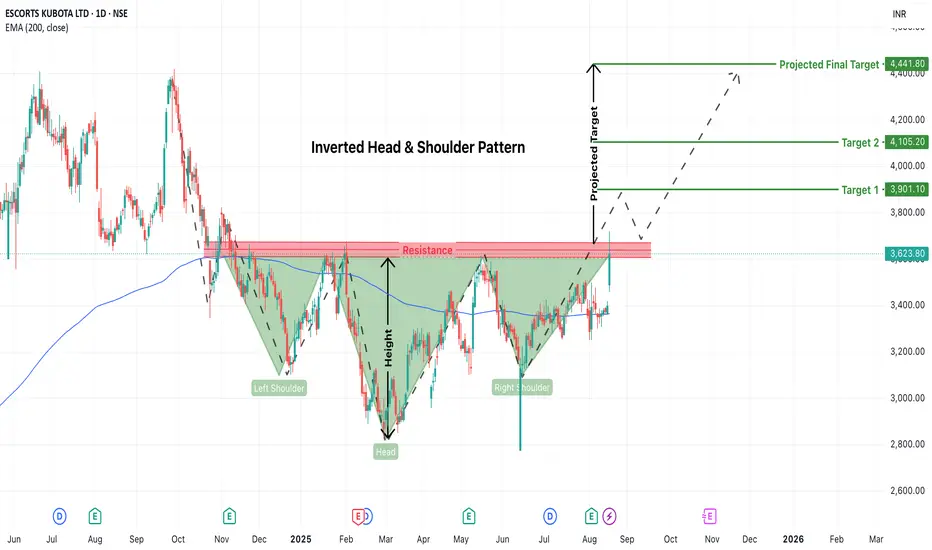
ESCORTS Potential Breakout Alert: Inverted Head & ShoulderThe chart of ESCORTS KUBOTA LTD (daily timeframe) is currently displaying a well-formed Inverted Head and Shoulder pattern, a powerful reversal setup often seen at the end of prolonged downtrends. This pattern suggests a shift in momentum from bearish to bullish—but the key breakout level still remains unconfirmed.
The left shoulder formed around November 2024, the head during March 2025, and the right shoulder recently shaped up through June and July 2025. The neckline resistance, drawn near the ₹3,580–₹3,620 zone, has been tested multiple times but has not yet been breached with conviction. A successful breakout above this resistance zone with strong volume would validate the pattern and signal a potential upside move.
At the moment, the price is hovering just around the neckline, attempting to build enough momentum to push through. This indicates a decision point—either the bulls gather strength to break out and push the stock higher, or the neckline acts as a ceiling, resulting in another round of consolidation or even a reversal.
Until confirmation, it remains a watchlist stock rather than an immediate entry.
Escortanalysis
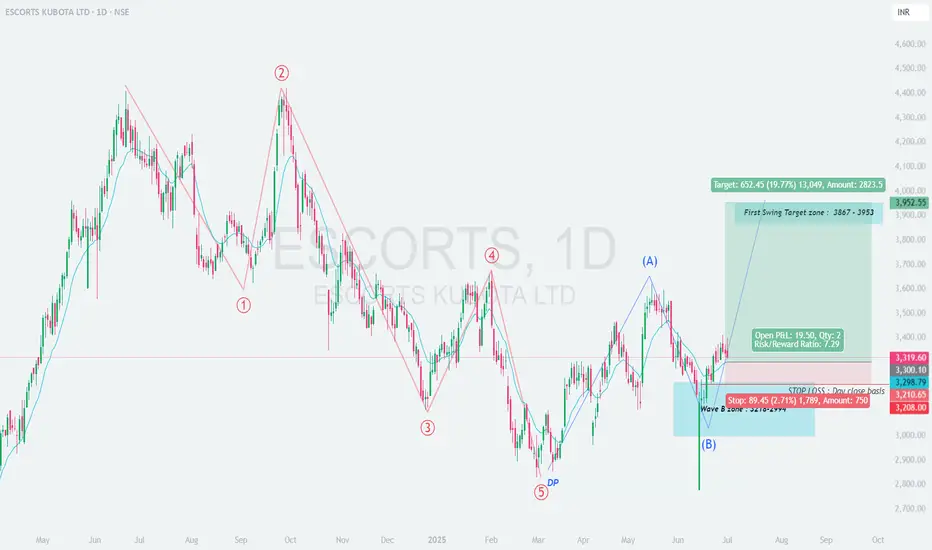
ESCORTS – Positional Swing Trade Setup (Daily Chart)
# 📊 \ ESCORTS – Positional Swing Trade Setup (Daily Chart)\
🧩 \ Elliott Wave Completion + ABC Corrective Breakout\
---
## 🌀 \ Wave Structure Insight:\
• Completed \ 5-wave impulsive decline\
• Followed by an \ ABC corrective pattern\
• Wave (B) appears to have bottomed in the \ ₹3120–3190\ Demand Zone
➡️ Reversal signs seen with strong price rejection and higher-low formation
---
## 🟦 \ Support Zone – ₹3120 to ₹3190\
🔹 Strong confluence support
🔹 Marked Demand Zone + ABC Wave (B) low
🔹 Bullish structure forming above this zone
---
## 🟩 \ Swing Target Zone: ₹3867 – ₹3953+\
🎯 Target 1: ₹3867
🎯 Target 2: ₹3953+ (full ABC projection)
⚡️ \~20% potential upside from breakout zone
---
## 📝 \ Trade Setup & Plan:\
📈 \ Entry:\ Around ₹3319–₹3330 (Post-breakout confirmation)
🎯 \ Targets:\
• T1: ₹3867
• T2: ₹3953+
❌ \ Stop Loss:\ Close below ₹3208 (below Wave B low)
📏 \ Risk-Reward Ratio:\ \~7.29 (ideal for positional traders)
---
## 🧠 \ Trade Logic:\
• Wave (B) has likely completed with a volume-backed reversal
• A sustained move above ₹3330 confirms bullish bias
• Pullback to ₹3240–₹3280 zone may offer a second entry
• Suitable for swing/positional setups with trend-following bias
---
📌 \ Conclusion:\
ESCORTS is setting up for a probable medium-term rally with a strong base in place. A move above ₹3330 with volume confirms the breakout. As long as ₹3208 holds, the trade offers high reward potential toward ₹3953.
Escorts - Stuck !!!Stock currently stuck in DBD as well as Strong Flip Zone
Area of resistance from 3280 - 3320
Upside Sl 3370
Downside 2900 - 2930
Lower Time Frame (Stock in a zone)
Possible entry either near top or on the break of lower zone in LTF
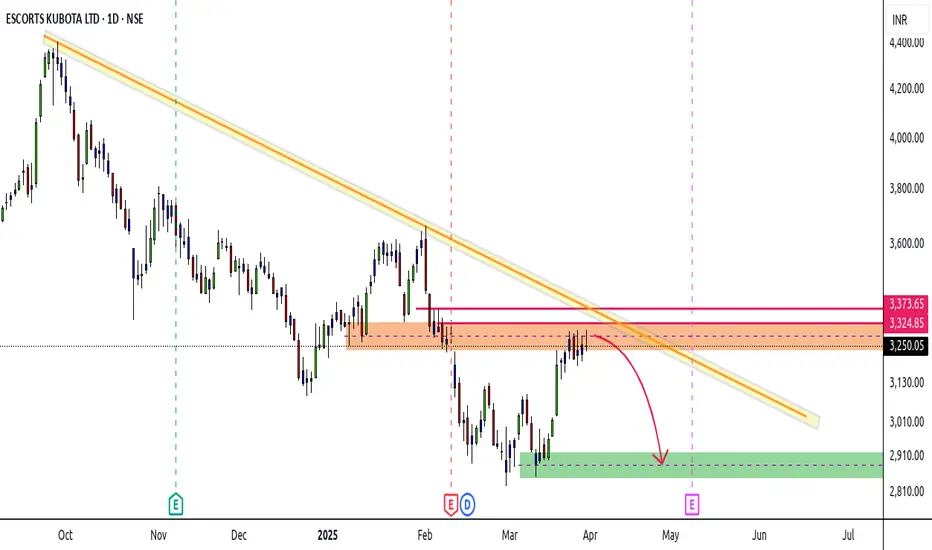
Escorts - BearishPrevious support now turned resistance zone
Also DBD base zone
Zone area 3380 - 3405
Point of rejection
View negates above 3420
Downside targets 3300 - 3225

Potential Breakout Alert: Escorts Kubota (KUBOTA) - Bullish Flagechnical Analysis:
Escorts Kubota (KUBOTA) appears to be forming a promising bullish flag and pole pattern on the charts, suggesting a potential breakout opportunity. The stock has shown a strong upward move followed by a period of consolidation, forming a flag pattern. This consolidation phase typically represents a temporary pause before the continuation of the prior uptrend.
Bullish Flag and Pole Pattern:
Flagpole: The initial sharp upward move in KUBOTA's price action forms the pole of the pattern.
Flag: Subsequent to the pole, there's a period of consolidation where the price oscillates within a narrow range, forming the flag portion of the pattern.
Breakout Potential:
A breakout from the upper boundary of the flag pattern could signal a continuation of the previous upward momentum, potentially leading to a significant price movement to the upside. This breakout point typically represents a bullish signal, attracting traders and investors looking to capitalize on the anticipated upward momentum.
Key Levels to Watch:
Resistance: Keep an eye on the resistance level near 2935 (example figure), which marks the upper boundary of the flag pattern.
Support: The lower boundary of the flag pattern, along with any nearby support levels, should be monitored to gauge the stock's ability to maintain its bullish momentum.
Potential Targets:
Based on the bullish flag and pole pattern formation, a potential target for KUBOTA could be around 3500 (example figure). However, it's essential to exercise caution and closely monitor price action for confirmation of the breakout before considering entry positions.
Conclusion:
Escorts Kubota (KUBOTA) is currently exhibiting a bullish flag and pole pattern, indicating the potential for a breakout to the upside. Traders and investors may want to keep a close watch on key resistance and support levels for confirmation of the breakout before considering entry positions. As always, it's crucial to implement proper risk management strategies and conduct thorough research before making any trading decisions.
Disclaimer: This analysis is for informational purposes only and should not be considered financial advice. Trading and investing carry inherent risks, and individuals should conduct their own research or consult with a financial advisor before making any investment decisions.
Please ensure to customize the price levels and targets according to the current market situation and provide appropriate disclaimers before sharing or acting upon this information.

Escort - 22.11.2023Trigger line above - 59.10, will reach 66.42, Cash price -34-56 Rs
Trigger Line below - 54.60 will reach 45.74, Cash Price - 35-78 Rs.

Escort -20.11.2023if trigger line (Brown) goes above 60.81. may reach 67.35, cash price - 30-80
if trigger line (Brown) goes below 54.69. may reach 48.00, cash price - 25-60

Escort -Intraday -15.11.2023If trigger line crosses over 54.12, may reach 65.50, cash Price may reach 55-90 with a gap up.
If trigger line crosses over 46.43, may reach 36.61, Option Price may reach 20-35.

Escort -Intraday -06.11.2023If trigger line crosses over 51.64, it may reach to 62.64, 40 to 60 Rs in cash.
If trigger line crosses below 43.22, it may reach to 32.89, 26 to 35 Rs in cash.

ESCORT 15 MINUTE CHART -INTRADAY 01.11.2023If signal Line Crosses Over 52.82 may give you good return.
If signal Line Crosses below 44.44 may give you good return.


Escorts Analysis Stock has formed flag and pole pattern and ready to give BO, very soon ATH will be broken, follow chart for proper support and resistance levels.

Potential breakout - Escortcheckout the potential breakout - escort
If the price > 350 then we will have the confirmation.
wait and keep it watching

Escort Trend line Trading # Escort Daily Chart
1. TL BO & retesting
2. Price drops after TL BO but doesn't goes below Swing low.
3. Trend will change above Swing High
4. 50 EMA BO
5. Price Closed above PDH 1977.95
6. Volume is rising
*Educational purpose only

Intraday Escort Sell callSell below 1925 TGT 1915-1910-1905 with SL 1932. Wait for the price to BD the support area. Only after the BD sell entry is to be taken. This is for your educational purpose only.

Escorts Kubota Limited :LONG TERM TRADEEscorts Kubota Limited, formerly Escorts Limited, is an India-based engineering company. The Company offers solutions for agriculture, infrastructure and railways. The stock is in retracement stage on daily and weekly time frame forming a PENNANT PATTERN. The Pattern has been broken out a shown in the chart. The Fundamentals of Company are strong with a Market Cap of Rs 27,177 Cr and YOY stock yield of 13.77 % .
Analysis on Weekly Chart :
The technical indicators at current level are as under :
CMP : 2107.05
MA20 : 2101.70
MA50 : 2083.82
MA200 : 2081.12
RSI : 57.47 crossing over
MACD (12,26) : 6.97
ADX (14) : 28.98 ( Directional Strength - In range )
ATR (14) : 17.07 ( less Volatile )
The Targets are as detailed in the chart , and is a strong buy.

escortsescorts support majar 1975 support near 0.38% fibbo
2000 levels break go for shorts tomorrow okh

Escorts KubotaEscorts Kubota in a really tight range, Either accumulation or distribution going on !
Mostly, Distribution going on, wait for a really trending move.
Keep it under your radar is my request

Escorts Kubota Range Breakout or Breakdown, Help Yourself with any volume indicator which will help you navigate thru the breaks !

Escort intra day TradeSell Escort below 1990 TGT 1985-1979 SL 1996. Stock is expecting to BD the Support line. Entry on 15 min candle after the complete closing of the candle. This is for your educational purpose only.

SWING TRADE : ESCORTS1. Buy above BO 1195
2. TARGET 1270/1380/1460
3. SL 1080
Analysis:
1. Breakout happened on descending channel
2. Trend reversal started at harmonic PRZ and support level. Now It is in accumulation phase.
3. Next would be uptrend if it breaks the accumulation zone.
Disclaimer: This is educational purpose only.
Please share your thoughts in the comments section below.

Long Escort for intradayLong Escort Above 1715. Target 1718-1722-1725 SL 1709. Stock taking the trend line supoort . Expected clean BO from the resistance zone. having low volume thats why selected for intraday.

ASHOKLEY Symmetric triangle BONSE:ASHOKLEY
#NSE:ASHOKLEY formed symmetrical triangle BO and trading @ TL Support.
Sustainability may give good upside momentum.
Short to medium term.
Happy LEarning !!
