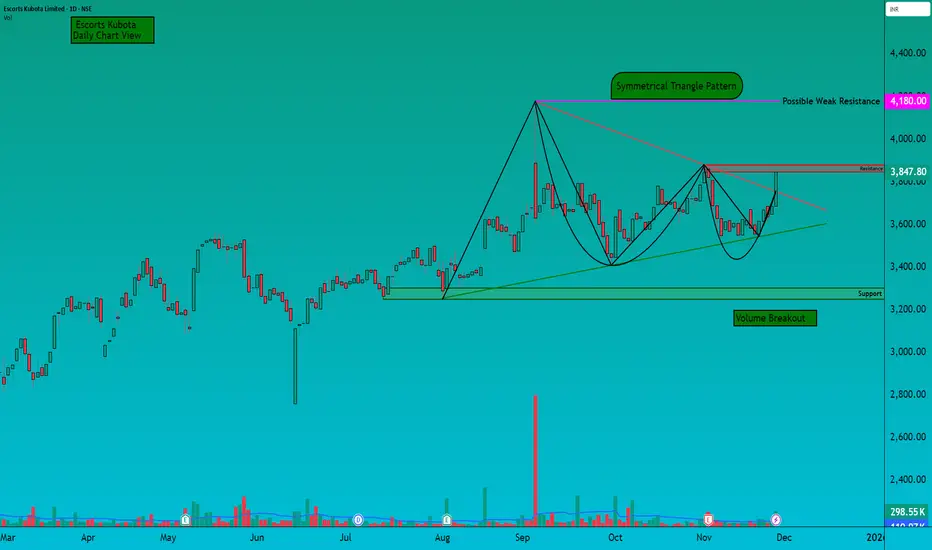
ESCORTS - Symmetrical Triangle Breakout Attempt
💹 Escorts Kubota Ltd (NSE: ESCORTS)
Sector: Machinery & Tractors | CMP: 3847.80 | View: Symmetrical Triangle Breakout Attempt
Chart Pattern: Symmetrical Triangle Pattern
Candlestick Pattern: Strong Bullish Momentum Candle
Swing High: 4180
Swing Low: 3250
STWP Trade Analysis:
Bullish Breakout Level: 3880
Stop Loss: 3535
Momentum: Strong
Volume: High institutional participation
The price has pushed strongly from the rising demand line, breaking into the upper zone of the triangle pattern with a decisive bullish candle. The surge in volume confirms institutional activity, and the structure shows a clear shift from compression into expansion. Buyers have regained dominance and are defending higher lows consistently.
Resistances:
3915 | 3982 | 4105
Supports:
3725 | 3662 | 3535
STWP Stock Analysis:
Final Outlook:
Momentum: Strong | Trend: Bullish Bias Developing | Risk: Moderate | Volume: Very High
Escorts Kubota has completed a clean coiling phase inside a symmetrical triangle and has now delivered a strong bullish candle directly into the breakout zone. Volume expansion confirms that this is not a random spike — it reflects accumulation by stronger hands.
RSI has rebounded toward the balanced zone, Stochastic has turned upward from oversold territory, and MACD is preparing for a positive signal, reflecting internal strength building beneath the price. EMA compression is easing gradually, hinting at the start of a new directional phase.
The VCP-like contractions across the last two months indicate a steady reduction in volatility, followed by today’s expansion candle — a behaviour often associated with the first ignition leg of a breakout. Sustaining above 3725–3662 keeps the bullish bias intact and allows the stock to challenge the upper resistance band near 3915 → 3982 → 4105.
Overall, Escorts Kubota stands at the edge of a potential breakout continuation, supported by strong volume, healthy structure, and a clear upshift in price behaviour. Holding the demand zones below can unlock further upside toward the higher resistance levels.
Traders should watch how the stock behaves on minor dips or pullbacks toward the 3719.60 - 3620.10 demand band. Healthy retests within this zone can strengthen the breakout structure and often act as secondary entry points in strong momentum setups
⚠️ Disclaimer
This document is strictly for educational and informational purposes. All examples, charts, levels, and option structures discussed are illustrative and are not intended as buy, sell, or hold recommendations. STWP does not provide investment advice, trading tips, signals, or personalized financial guidance of any kind, nor is it a SEBI-registered intermediary or research analyst.
The analyses, illustrations, and risk–reward structures included here are generic in nature and based on publicly available data and observed market behaviour, which may change without notice. Financial markets involve significant risk; derivatives in particular carry the potential for substantial losses. Option premiums, implied volatility, open interest, delta, and other market variables can fluctuate rapidly and unpredictably. Readers are solely responsible for their trading decisions, capital management, and risk assessment. Before making any investment or trading decision, please consult a SEBI-registered investment advisor. STWP, its representatives, and affiliates shall not be liable for any direct or indirect loss arising from the use of this material. Historical patterns or past market behaviour do not guarantee future outcomes. Nothing in this document should be interpreted as a promise of performance, accuracy, or returns.
Position Status: No active position in ESCORTS at the time of analysis.
Data Source: TradingView & NSE India .
💬 Found this useful?
🔼 Boost this post to support structured learning
✍️ Drop your thoughts or questions in the comments
🔁 Share with traders who benefit from clean technical studies
👉 Follow for disciplined, structured, STWP-style analysis.
🚀 Stay Calm. Stay Clean. Trade With Patience.
Trade Smart | Learn Zones | Be Self-Reliant 📊
ESCORTS
BUY TODAY SELL TOMORROW for 5%DON’T HAVE TIME TO MANAGE YOUR TRADES?
- Take BTST trades at 3:25 pm every day
- Try to exit by taking 4-7% profit of each trade
- SL can also be maintained as closing below the low of the breakout candle
Now, why do I prefer BTST over swing trades? The primary reason is that I have observed that 90% of the stocks give most of the movement in just 1-2 days and the rest of the time they either consolidate or fall
Resistance Breakout in ESCORTS
BUY TODAY SELL TOMORROW for 5%

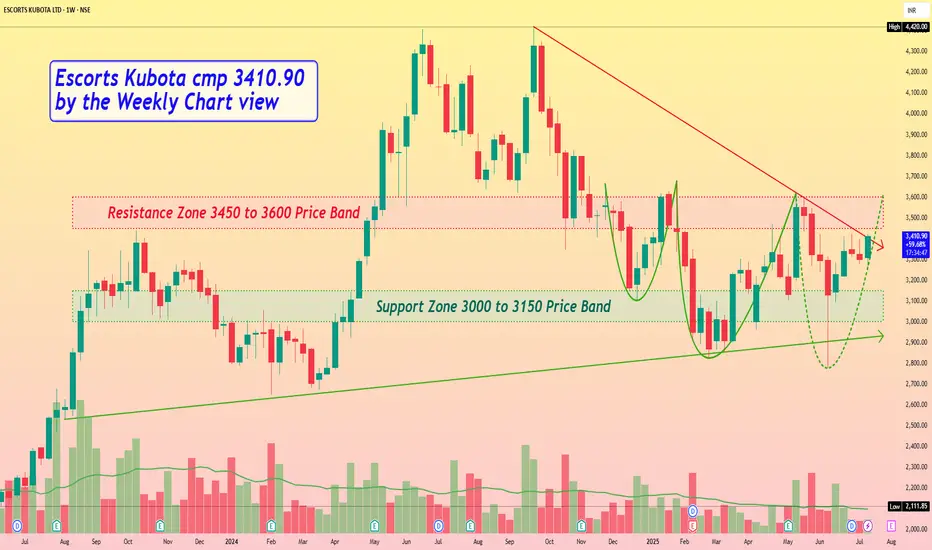
Escorts Kubota cmp 3410.90 by the Weekly Chart viewEscorts Kubota cmp 3410.90 by the Weekly Chart view
- Support Zone 3000 to 3150 Price Band
- Resistance Zone 3450 to 3600 Price Band
- 2 Bullish Rounding Bottoms done, 3rd in completion stage
- Volumes needed to push for fresh breakout across Resistance Zone
- Falling Resistance Trendline Breakout attempted by the current status
- Rising Support Trendline is well respected and sustained by price momentum
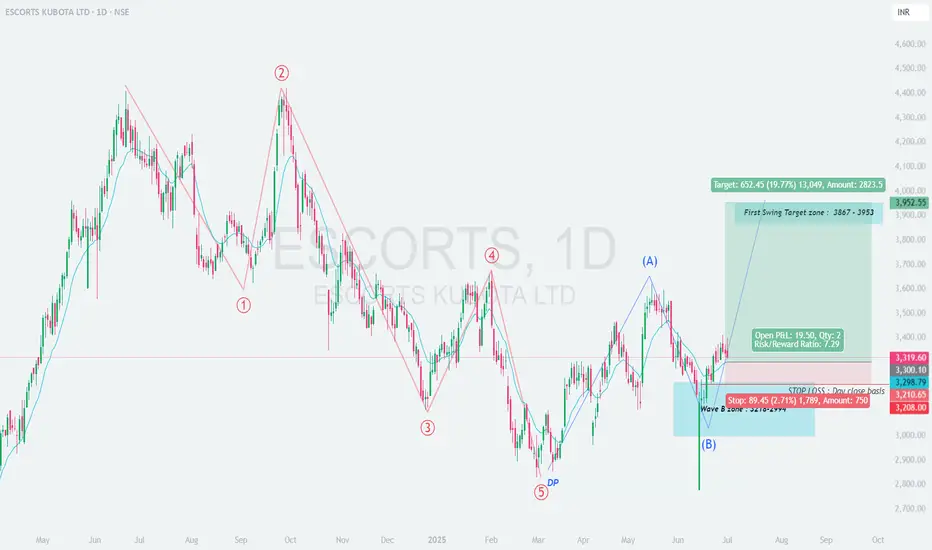
ESCORTS – Positional Swing Trade Setup (Daily Chart)
# 📊 \ ESCORTS – Positional Swing Trade Setup (Daily Chart)\
🧩 \ Elliott Wave Completion + ABC Corrective Breakout\
---
## 🌀 \ Wave Structure Insight:\
• Completed \ 5-wave impulsive decline\
• Followed by an \ ABC corrective pattern\
• Wave (B) appears to have bottomed in the \ ₹3120–3190\ Demand Zone
➡️ Reversal signs seen with strong price rejection and higher-low formation
---
## 🟦 \ Support Zone – ₹3120 to ₹3190\
🔹 Strong confluence support
🔹 Marked Demand Zone + ABC Wave (B) low
🔹 Bullish structure forming above this zone
---
## 🟩 \ Swing Target Zone: ₹3867 – ₹3953+\
🎯 Target 1: ₹3867
🎯 Target 2: ₹3953+ (full ABC projection)
⚡️ \~20% potential upside from breakout zone
---
## 📝 \ Trade Setup & Plan:\
📈 \ Entry:\ Around ₹3319–₹3330 (Post-breakout confirmation)
🎯 \ Targets:\
• T1: ₹3867
• T2: ₹3953+
❌ \ Stop Loss:\ Close below ₹3208 (below Wave B low)
📏 \ Risk-Reward Ratio:\ \~7.29 (ideal for positional traders)
---
## 🧠 \ Trade Logic:\
• Wave (B) has likely completed with a volume-backed reversal
• A sustained move above ₹3330 confirms bullish bias
• Pullback to ₹3240–₹3280 zone may offer a second entry
• Suitable for swing/positional setups with trend-following bias
---
📌 \ Conclusion:\
ESCORTS is setting up for a probable medium-term rally with a strong base in place. A move above ₹3330 with volume confirms the breakout. As long as ₹3208 holds, the trade offers high reward potential toward ₹3953.
Bullish Signal with EMA Crossover and TTM SqueezeESCORTS (2.64%)
Bullish Signal with EMA and TTM Squeeze Breakout
ESCORTS shows a promising bullish setup, with a Strong Bullish Candle and an EMA 200 Crossover signaling a potential long-term trend reversal. The RSI Breakout and Bollinger Band Breakout further confirm the bullish outlook. A TTM Squeeze breakout also indicates increasing volatility, which could propel the stock further upwards.
Resistance Levels: 3482-3517-3572
Support Levels: 3392-3338-3302
Entry: @/above 3463.20
Stop Loss: @/below 3244.80
Volume Analysis: Volume has been increasing steadily, with higher than the average volume of 115.43K on 23rd April. This shows increased investor activity and potential momentum building.
escorts kubota ltd, bullishMoved above short term moving averages.
Had support and resistance around 3900, which it broke with good volume.
Crossed upper BB.
Super trend changed to buy after 34 sessions.
High delivery, macd has bullish crossover
RSI at 67.
SL at 3600
tgt 1 : 4200
tgt 2 : 4400

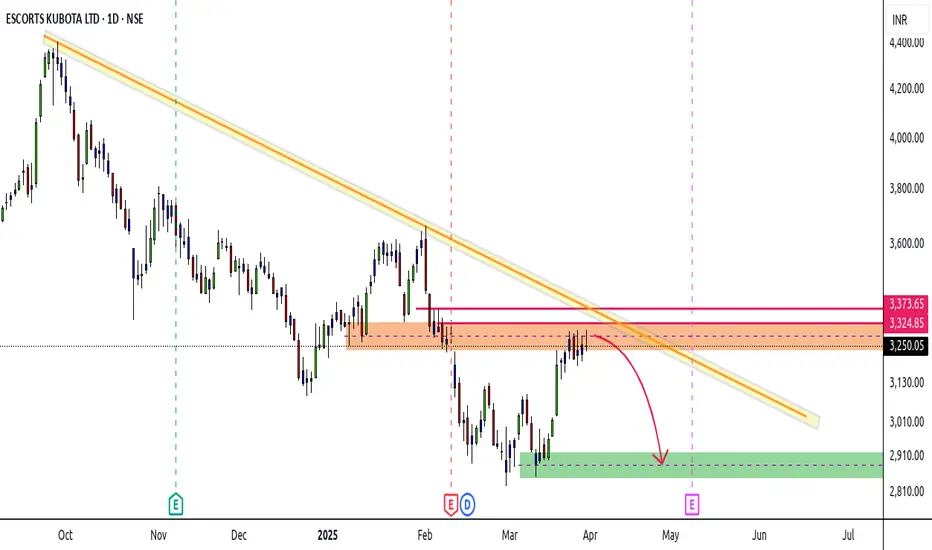
Escorts - Stuck !!!Stock currently stuck in DBD as well as Strong Flip Zone
Area of resistance from 3280 - 3320
Upside Sl 3370
Downside 2900 - 2930
Lower Time Frame (Stock in a zone)
Possible entry either near top or on the break of lower zone in LTF
Escorts - BearishPrevious support now turned resistance zone
Also DBD base zone
Zone area 3380 - 3405
Point of rejection
View negates above 3420
Downside targets 3300 - 3225

ESCORTS LTDStock Name : #ESCORTS LTD
LTP : 3750
Price is moving in a Higher highs and higher lows pattern
Showing a bullish uptrend 15 Minutes Time frame..
15 Minutes breakout done after that Bearish Marubozu candle indicating Retest
We Can add it above: 3800 Range
Targets Will be 4000
Stoploss 3755

ESCORTS - Symmetrical triangle -Breakout -DailyThis image shows a price chart for Escorts Kubota Ltd stock,
Here's an analysis of the key elements:
1. Price Action:
- The stock has been in an overall uptrend since April.
- It formed a symmetrical triangle pattern from June to September, which it has now broken out of to the upside.
- The current price is 4,079.25 INR, up 4.88% on the day.
2. Key Levels:
- There's a significant resistance level around 4,400 INR, which was the previous high in June.
- The breakout level from the triangle pattern (around 3,920 INR) may now act as support.
3. Volume:
- There's a notable spike in trading volume coinciding with the recent price breakout, suggesting strong buying interest.
4. RSI (Relative Strength Index):
- The RSI is currently at 67.60, indicating strong momentum but not yet in overbought territory.
- There was a bullish divergence between the RSI and price from July to September, with the RSI making higher lows while price made lower lows.
5. Potential Targets:
- The chart shows a potential price target of 4,870.90 INR, which represents a 21.02% move from the breakout point.
6. Overall Outlook:
- The breakout from the symmetrical triangle, accompanied by increased volume and strong RSI, suggests a bullish outlook for the stock.
- The next major resistance to watch would be the previous high around 4,400 INR.

ESCORT DOUBLE BOTTOM BREAKOUTEscort breaking double bottomneck line
with volume spike and rsi in bullish zone
#target 4400 soon
EDUCATIONAL IDEA

ESCORTSNote:
1. Views are personal and for educational purposes only. Recheck and take the trade as per your RR.
2. Always remember SL is your lifeline, not the big target...
3. Follow us for more patterns and like, share so that we feel it is helpful to many and share more patterns...
3. Views given here is not a tip rather it is for educational purpose... Aftermarket opens, the condition might change so learn to handle different conditions...
Keep an eye ladies and gentlemen. Cheers and Happy Trading

Big Breakout Alert! Negative Momentum in GODREJPROP & ESCORTSGODREJPROP
The stock's price has been following an upward trend within a parallel channel.
Recently, the stock broke through the lower boundary of the channel with a powerful bearish candle.
With pessimistic market sentiment, it is anticipated that the stock price will continue to correct, presenting a chance to take a short position.
ESCORTS
Following the emergence of the bullish Pole & Flag pattern, the stock experienced a significant upward surge backed by robust momentum.
After reaching an all-time high close to the 4,400 level, the stock retraced and eventually formed a Double Top pattern signaling a potential bearish trend.
A recent breach of the pattern's neckline to the downside suggests further downside potential for the stock.


Falling Wedge Pattern breakout in Escorts.Falling Wedge Pattern breakout in daily time frame, looks good to enter long positions, risky traders can enter above break out candle (3020 levels) there is some resistance above break out candle conservative traders may enter above 3080 levels with stoploss of swing low (at around 2640 levels) for the targets of 3300 and above levels.
-- Above analysis is for educational purpose only, do your own analysis before entering the trade and do not invest more than 10% of your capital in a single stock.

ESCORTS - Swing Trade Analysis - 20th April #stocksESCORTS (1W TF) - Swing Trade Analysis given on 20th April, 2024
Pattern: RECTANGLE BOX BREAKOUT
- Resistance Breakout - Done ✓
- Volume Buildup at Resistance - Done ✓
- Demand Zone Retest & Consolidation - In Progress
* Disclaimer
#ESCORTS

Potential Breakout Alert: Escorts Kubota (KUBOTA) - Bullish Flagechnical Analysis:
Escorts Kubota (KUBOTA) appears to be forming a promising bullish flag and pole pattern on the charts, suggesting a potential breakout opportunity. The stock has shown a strong upward move followed by a period of consolidation, forming a flag pattern. This consolidation phase typically represents a temporary pause before the continuation of the prior uptrend.
Bullish Flag and Pole Pattern:
Flagpole: The initial sharp upward move in KUBOTA's price action forms the pole of the pattern.
Flag: Subsequent to the pole, there's a period of consolidation where the price oscillates within a narrow range, forming the flag portion of the pattern.
Breakout Potential:
A breakout from the upper boundary of the flag pattern could signal a continuation of the previous upward momentum, potentially leading to a significant price movement to the upside. This breakout point typically represents a bullish signal, attracting traders and investors looking to capitalize on the anticipated upward momentum.
Key Levels to Watch:
Resistance: Keep an eye on the resistance level near 2935 (example figure), which marks the upper boundary of the flag pattern.
Support: The lower boundary of the flag pattern, along with any nearby support levels, should be monitored to gauge the stock's ability to maintain its bullish momentum.
Potential Targets:
Based on the bullish flag and pole pattern formation, a potential target for KUBOTA could be around 3500 (example figure). However, it's essential to exercise caution and closely monitor price action for confirmation of the breakout before considering entry positions.
Conclusion:
Escorts Kubota (KUBOTA) is currently exhibiting a bullish flag and pole pattern, indicating the potential for a breakout to the upside. Traders and investors may want to keep a close watch on key resistance and support levels for confirmation of the breakout before considering entry positions. As always, it's crucial to implement proper risk management strategies and conduct thorough research before making any trading decisions.
Disclaimer: This analysis is for informational purposes only and should not be considered financial advice. Trading and investing carry inherent risks, and individuals should conduct their own research or consult with a financial advisor before making any investment decisions.
Please ensure to customize the price levels and targets according to the current market situation and provide appropriate disclaimers before sharing or acting upon this information.

ESCORTS: Channel BreakoutPrices have given a breakout of the channel. This suggests that prices are likely to recover towards INR 3290-3300 in the coming weeks. Any weakness is likely to hold above the support of 2800.

Escorts - Positional Long OpportunityFor the last 3 months, the stock has been trading in a range that is forming a downward parallel channel. This moment, just close to the upper side of the formation. If breaks the upper level and sustains, this could be a breakout of a parallel channel.
Targets may be 3245/3440 or even more.
The setup is with a good risk-reward ratio.
The entry point should be chosen patiently ( if the price comes down intraday.)
The setup fails if sustains below 2810 for 2 days, or the exit point should be per one's risk management.
This illustration is only my view. It is not a trading recommendation in any form. It is for learning and sharing purposes only.
All the best.

#Escorts #BestBuyStock is at best Demand Zone. At this level it has got good Risk reward.
Good for Swing set up. Target and SL in Charts.
Safe traders Look for PriceAction.

Escort - 22.11.2023Trigger line above - 59.10, will reach 66.42, Cash price -34-56 Rs
Trigger Line below - 54.60 will reach 45.74, Cash Price - 35-78 Rs.

Escort -20.11.2023if trigger line (Brown) goes above 60.81. may reach 67.35, cash price - 30-80
if trigger line (Brown) goes below 54.69. may reach 48.00, cash price - 25-60

Escort -Intraday -15.11.2023If trigger line crosses over 54.12, may reach 65.50, cash Price may reach 55-90 with a gap up.
If trigger line crosses over 46.43, may reach 36.61, Option Price may reach 20-35.
