Eternal Ltd – Sell Into Strength, Buy Only After Structure Conf
• CMP: ₹299.25
• Recent bounce is corrective, not impulsive — price still trading inside a broader downtrend
• Rally is running into supply near the 200 EMA / breakdown zone (~₹300–310)
• Volume expansion looks like short covering, not fresh accumulation
• This move lacks follow-through characteristics of a true trend reversal
🎯 Trade Logic
• Sell / Avoid longs into ₹300–310 zone — supply likely to cap upside
• Buy planning only if:
– Price pushes toward ₹310
– Then retraces and stabilizes in ₹305–300 range
📍 Planned Long Setup (Only on Retest):
• Entry Zone: ₹305–300
• Stop-Loss: ₹295
• Structure-based entry, not momentum chasing
💡 What most see as “breakout energy” still reads like distribution to me. I’d rather pay higher for confirmation than get early into a weak structure.
#Eternal #TradePlanning #PriceAction #RiskFirst #NSEStocks #MarketStructure #TradingView
Eternal

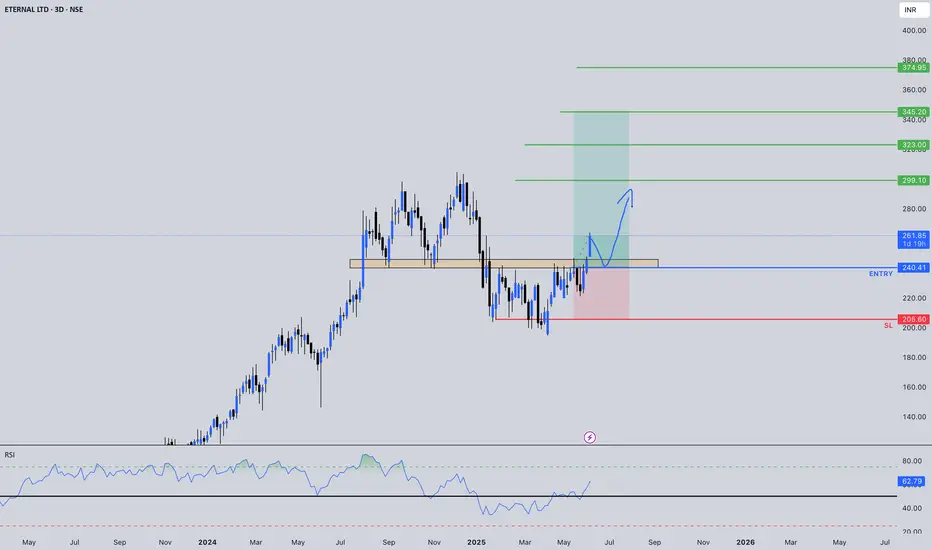
ETERNAL: Early Signs of "U" shaped turnaround‽Technicals: ETERNAL has completed a full markdown phase after distribution near the 345/355 supply zone. the sharp selloff was followed by prolonged sideways move near the lows which clearly signals selling exhaustion rather than continuation. price has been respecting the higher timeframe demand zone around 277/283, and every dip into this area is being absorbed quickly.
From SMC perspective, this zone shows accumulation by stronger hands, not retail panic the narrow range candles and repeated rejections from below confirm that liquidity below 277 has already been swept the market is now compressing, preparing for a directional move.
The 285/288 zone is the short-term decision level. acceptance above this area indicates a shift from accumulation to early expansion the curved forecast path you’ve drawn makes sense because this is not a momentum breakout scenario but a gradual re-pricing phase after a deep correction.
As long as price holds above 277 and continues to build above 288, the bias remains bullish. Any move below 275 would break the demand structure and invalidate the bullish setup.
Fundamentals: the stock has gone through expectation reset, not business breakdown. the correction reflects margin pressure and cautious earnings outlook which the market has already priced in during the decline.
The key missing driver earlier was earnings visibility and that still remains the deciding factor. the market is currently in wait and watch mode ahead of results this explains why price is basing instead of rallying aggressively.
If upcoming results show margin stability, controlled costs, or neutral-to-positive guidance, institutional participation can increase. That would align perfectly with the accumulation seen on charts and fuel the next expansion leg without confirmation, price may still move higher but in a controlled and selective manner.
In short, fundamentals support stability first and trend continuation only after confirmation.
Levels to Watch
Higher timeframe demand zone: 277–283
Bullish bias holds above: 288
First upside objective: 303
Major structure level: 323
Supply zone: 343
Extended liquidity target: 377
Invalidation level: Below 275
Technically, sellers are done.
Structurally, accumulation is in place.
Fundamentally, the business is stabilizing, not failing.
Above 288, the chart supports your bullish roadmap step by step toward higher liquidity zones. This is a structured recovery setup, not a hype-driven rally.
Like, comment your thoughts, share this post
Explore more stock ideas on the right hand side!
Disclaimer: This post is for educational purposes only and should not be considered a buy/sell recommendation.

Eternal Ltd at a Critical Make-or-Break Zone – Long OpportunityEternal Ltd is currently trading near a well-defined demand and trendline support zone after a sharp corrective phase from its recent highs. The price action suggests that selling pressure is gradually losing strength, and the stock is attempting to stabilize around the 285–290 range. This area is technically important, as it aligns with a rising long-term trendline and acts as a base where buyers have previously stepped in.
From a moving average perspective, price is still trading below the short-term EMA, indicating that the trend reversal is not yet fully confirmed. However, the stock is holding above the major support zone and showing signs of recovery from intraday lows. A sustained move above the near-term resistance around 300–305 would be the first indication of strength and could shift the short-term bias toward bullish.
The RSI structure adds an important clue to this setup. After remaining in the lower zone for some time, RSI is attempting a bullish reversal from oversold territory. This positive divergence-like behavior indicates improving momentum and increases the probability of a relief rally. If RSI continues to move upward and sustains above the 50 zone, it would further validate the bullish case.
In the bullish scenario, once price holds above 300 on a closing basis, the stock can gradually move toward the first upside objective near 313. A breakout and hold above this level could open the path toward the next resistance around 335, followed by the extended target zone near 360 in the medium term. These targets are expected to be achieved in phases, with intermittent consolidations.
On the downside, the risk remains clearly defined. A decisive breakdown below the 280 support zone would invalidate the bullish setup and may lead to further downside pressure. Hence, this is not a confirmed breakout trade yet, but rather an early-stage opportunity near strong support where risk-to-reward remains favorable if managed properly.
Overall, Eternal Ltd is presenting a potential long opportunity near its base, supported by structure and improving momentum. Traders should wait for confirmation above resistance levels for higher conviction, while positional participants may track this zone closely with strict risk management in place.

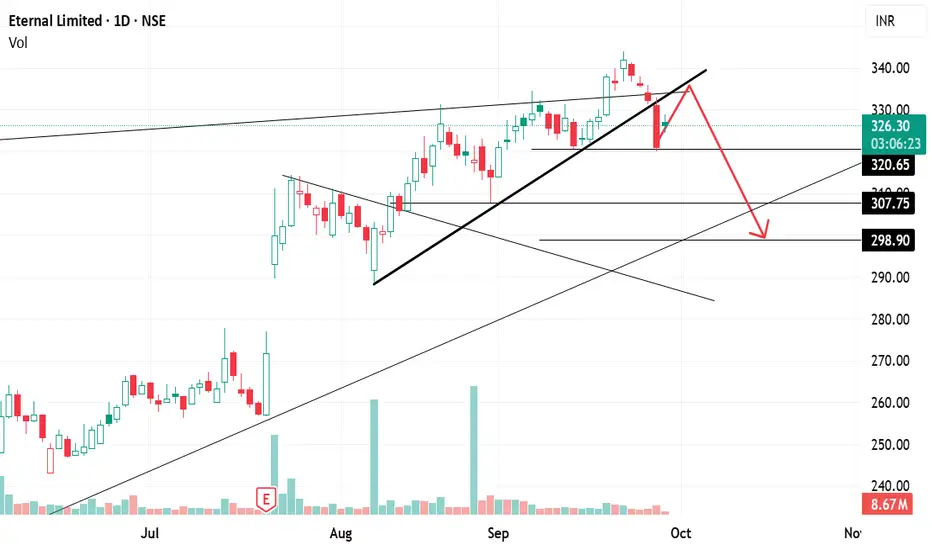
ETERNAL (Zomato): Breakdown Below Trendline ETERNAL (Zomato) had been on a strong bull run since April 2025, rallying from ₹195 to ₹344 🚀. Throughout this journey, the stock consistently respected an upward trendline, bouncing every time it touched the line.
But things changed on 26th September 2025:
❌ The stock broke down below the trendline support for the first time.
After the breakdown, it reached a low of ₹320, signaling that the structure had become weak
✨ 1. Trendline Signals (Daily Chart)
If we connect all the key highs of September 2024, December 2024, August 2025, and September 2025, we obtain a resistance trendline.
Recently, the stock gave a breakout above this trendline, but it failed to sustain and quickly slipped back below it.
This false breakout followed by weakness is often a bearish signal ⚠️.
📅 2. Short-Term View
Right now, the stock is hovering near ₹320, a critical support level.
If ₹320 breaks decisively, the weakness will get confirmed, and the stock may head toward:
🎯 ₹310
🎯 ₹300 (short-term target zone).
Until then, some retracement or sideways movement may happen, but the overall bias is weak.
🕰️ 3. Weekly Chart View (Bigger Picture)
Last week, the stock formed a bearish engulfing candle, where the body of the red candle completely covers the body of the previous green candle.
This pattern is a reversal signal, showing sellers overpowering buyers.
If this week’s close is below ₹320, it will confirm the bearish engulfing pattern ✅, adding further weight to the downside scenario.
📌 Summary:
🔻 Weakness Detected: Breakdown of trendline + false breakout on resistance.
⚠️ Confirmation Needed: Closing below ₹320 will confirm bearish engulfing and continuation of weakness.
🎯 Targets: If ₹320 breaks, next levels are ₹310 and ₹300.
🛡️ If ₹320 holds: Stock may bounce, but the overall structure remains fragile.
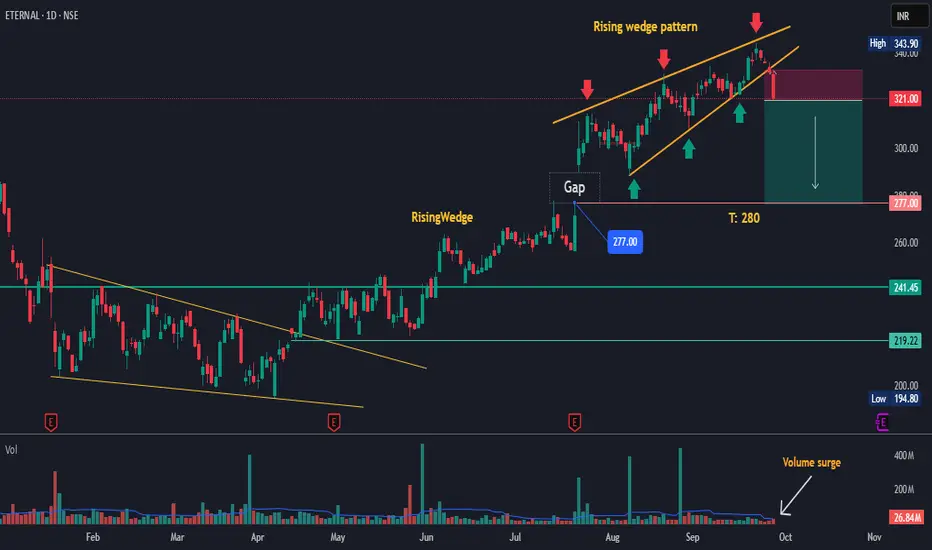
ETERNAL – Rising Wedge Breakdown Setup | Target: 280The stock has formed a Rising Wedge pattern after a strong rally, with multiple rejections from the upper trendline (marked by red arrows). previous price action shows weakness near the resistance zone, indicating a potential breakdown.
🔹 Key Highlights:
Rising Wedge Pattern visible on the daily chart – a bearish reversal setup.
Volume surge in recent sessions signals distribution at higher levels.
Gap Support at 277 – likely to be tested once breakdown confirms.
Immediate Target: 280, aligning with horizontal support.
Risk-to-Reward favored on the short side as price rejects resistance.
🔻 Breakdown Confirmation:
277 (Gap level)
241.45
219.22
This setup offers a clean technical short opportunity if downside momentum continues. Suitable for traders looking to capitalize on wedge breakdowns with volume confirmation.
Disclaimer : Risk management is crucial in this volatile market, so keep position sizing appropriate. This analysis is intended for educational purposes and not financial advice.
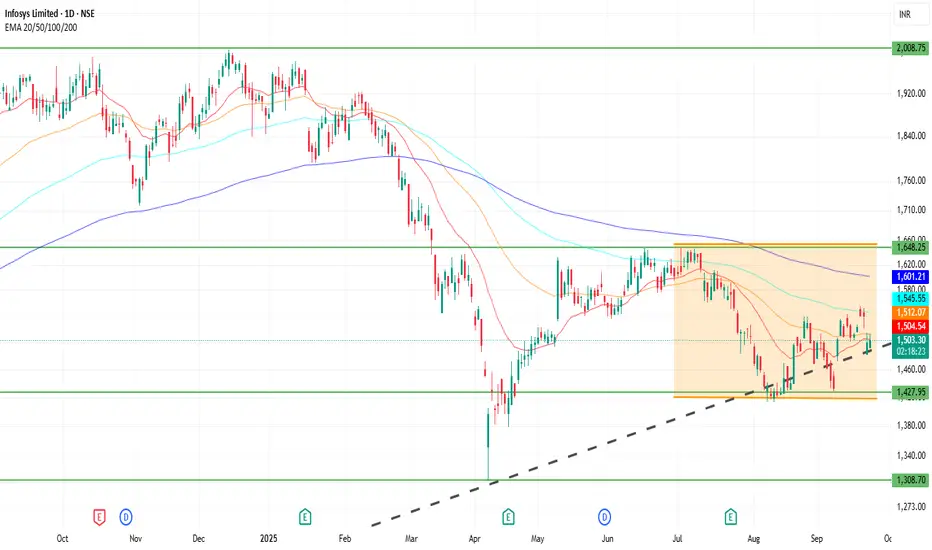
INFY 1D Time frame📍 Current Price & Range
Current Price: ₹1,503.00
Day’s High / Low: ₹1,540.20 / ₹1,499.50
52-week High / Low: ₹2,006.45 / ₹1,307.00
🔍 Key Levels
Immediate Resistance: ₹1,540–₹1,550
Next Resistance: ₹1,600
Immediate Support: ₹1,450–₹1,460
Strong Support: ₹1,400
📊 Indicators & Momentum
Short-term Trend: Neutral to slightly bearish; recent price action shows hesitation near resistance levels.
Volume: Higher-than-average trading volume observed, indicating increased investor interest.
Relative Strength Index (RSI): Approaching overbought territory; caution advised for potential pullbacks.
Moving Averages: Price trading below key moving averages; may act as resistance if price approaches them.
🔮 Possible Scenarios
Bullish Breakout: If INFY sustains above ₹1,550 with strong volume, it could target ₹1,600 and higher levels.
Sideways Consolidation: Price may trade between ₹1,450 and ₹1,550, awaiting a catalyst for direction.
Bearish Reversal: A drop below ₹1,450 could lead to a retest of the 52-week low around ₹1,307.
⚠️ Outlook
At the current level of ₹1,503.00, Infosys is at a critical juncture. A decisive move above ₹1,550 could open up upside potential, while a failure to hold above ₹1,450 may lead to further downside. Monitoring volume and RSI for confirmation is recommended.
ETERNAL (ZOMATO) By KRS Charts17th April 2025 / 1:24 PM
Why Eternal ??
1. All Over Bullish Stock. Yet Not Profitable but Business model has potential in near Future.
2. Wave Count is suggesting 4th wave is likely finish and 5th last leg is started which can last till 340 Rs.
3 RSI & MACD is showing bullish continues Divg. bears gave there all but failed to make new lower low.
4. Lower TF is showing W pattern Breakout as well with good volume.
Targets and SL 1W Closing Basis are mentioned in chart.

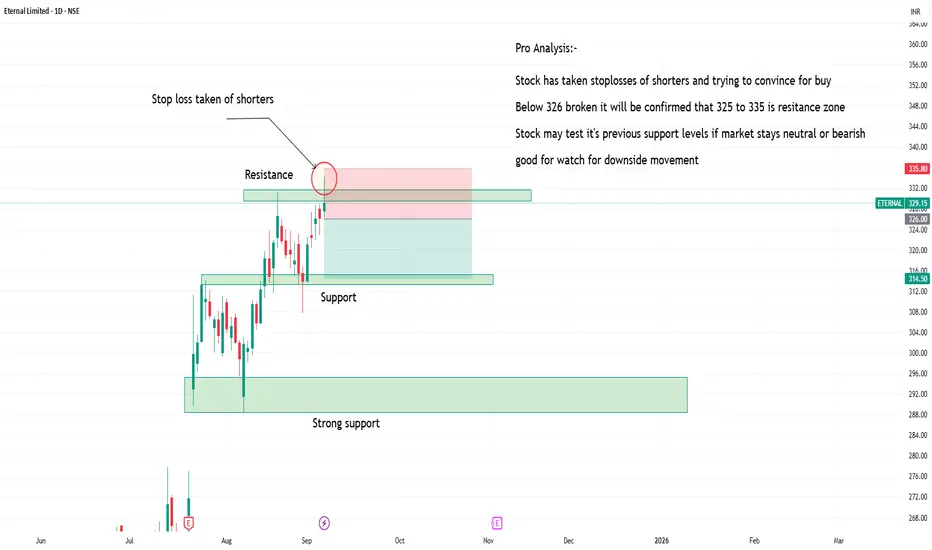
Zomato creating it's resistance zoneZomato is testing it's resistance zone.
one can watch for downside movement with stop losses above recent swing with targets of 215 levels.
it's pure price action.
stock may go in consolidate in zone for long time.
ETERNAL LTDETERNAL – The stock trading in a rising parallel channel, making higher high and higher lows
Small consolidation (mini bullish flag) near the channel's upper half, which often leads to another upward leg if supported by volume.
If the stock breaks and sustains above 315 can get target 330 then 350. Manage the risk with strict SL at 300

ZOMATO: All set for 40% upside potential⚡️Price Analysis:
1️⃣ Price broke the resistance.
2️⃣ Price structure is bullish.
3️⃣ Price trading above EMAs
4️⃣ Strong candle formation.
✨ Key Observations:
➡️ RRR favourable at CMP.
➡️ Price should continue the upside momentum
➡️ Retest can be a good zone for further accumulation.
⚠️ Disclaimer: This is NOT a buy/sell recommendation. This post is meant for learning purposes only. Views are personal. Please, do your due diligence before investing.⚠️
💬 Share your thoughts in the comments below! ✌️
🔥Trade Safe!✅🚀
Eternal: From Turnaround to Trend – Is ₹350+ the Next Stop?Eternal ( NSE:ETERNAL ) has been on a remarkable journey, transforming its financials and catching the eye of institutional investors. Despite a slight dip today, its impressive growth and unique shareholding structure raise a critical question: Is this just the beginning, or has the market overvalued its potential? Let's dive in.
Current Snapshot:
Price: ₹306.55 (-0.24% today)
Market Cap: ₹2,95,832 Cr (Significant player)
Key Question: Sustained growth phase or overbought?
Shareholding Insights (June 2025):
A truly unique aspect is Eternal's 0% promoter holding, suggesting a professionally managed entity driven by big money.
FIIs: Dominant 42.34% (Strong international confidence)
DIIs: Substantial 26.59%
Public: 7.04%
Others: 24.04%
Implication: Stock movements heavily influenced by large fund flows.
Financial Turnaround - A Glimpse:
Eternal's recent financial performance shows a significant shift:
Sales: Surged from ₹12,114 Cr (Mar 2024) to ₹20,243 Cr (Mar 2025)
Operating Profit: Exponential leap from ₹42 Cr to ₹637 Cr
OPM%: Jumped from 0% to 3%
Net Profit: Rose from ₹351 Cr to ₹527 Cr
Cash Flow (Mar 2025): Healthy ₹357 Cr (vs. ₹91 Cr in Mar 2024)
Investing Activities: ₹-7,993 Cr (Mar 2025) vs. ₹-348 Cr (Mar 2024) - Suggests significant capital deployment for future growth.
Balance Sheet Strengthening: Reserves & Surplus, and Total Assets showing strong growth.
Valuation & Returns:
P/E Ratio: Not listed (implies negative earnings or non-traditional valuation)
Dividend Yield: 0%
Market Focus: Valuation likely based on future growth prospects & asset play.
Investment Returns: +2.25% (last week), +35.11% (last year) - Strong positive sentiment.
Delivery Volume - Accumulation in Progress?
Monthly delivery data points to high investor interest and potential accumulation:
July 2025: +16.34% price gain, 45.10% delivery
June 2025: +10.84% price gain, 54.30% delivery
April 2025: +15.28% price gain, 46.48% delivery
March 2025: -9.19% price dip, but high 57.29% delivery.
Interpretation: Consistent high delivery suggests long-term holding, indicating strong underlying demand.
Technical Outlook - Bullish Momentum:
Eternal's recent price action, especially the gains in April, June, and July, combined with high delivery percentages, signals strong bullish momentum.
Current Price: ₹306.55
Uptrend: Consistent positive monthly returns (except March and January).
Technical Health: High delivery volume alongside price appreciation is a very healthy sign, indicating conviction behind the moves.
Potential Target: From a technical perspective, Eternal looks very strong and appears to have the potential to reach ₹350+ soon.
Real Talk: Navigating the Growth Story
For Traders:
This looks like a classic momentum play. Riding the trend with disciplined trailing stop losses will be key. Keep an eye on delivery percentages – a significant drop alongside price dips could signal a shift in institutional sentiment.
For Investors:
The turnaround story and strong institutional backing are compelling. However, the 0% promoter holding means external forces (FII/DII sentiment) will heavily dictate its trajectory. Long-term investors should dig deeper into the business model and future growth drivers. Given the strong technical indicators pointing towards ₹350+, this could be an attractive entry point for those who believe in the broader growth narrative.
Your thoughts? Would you jump into this high-momentum, institutionally-driven growth story, anticipating the suggested technical upside, or wait for more traditional valuation metrics to emerge?
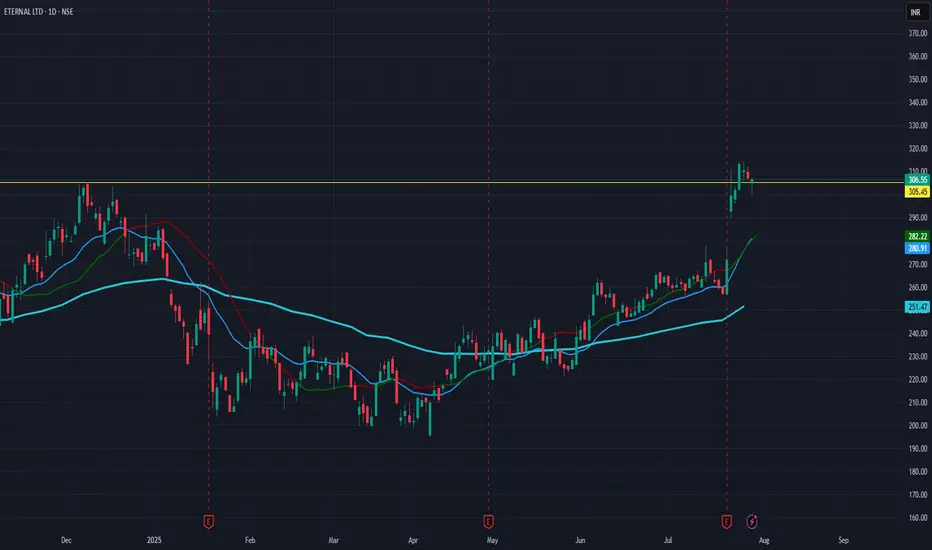
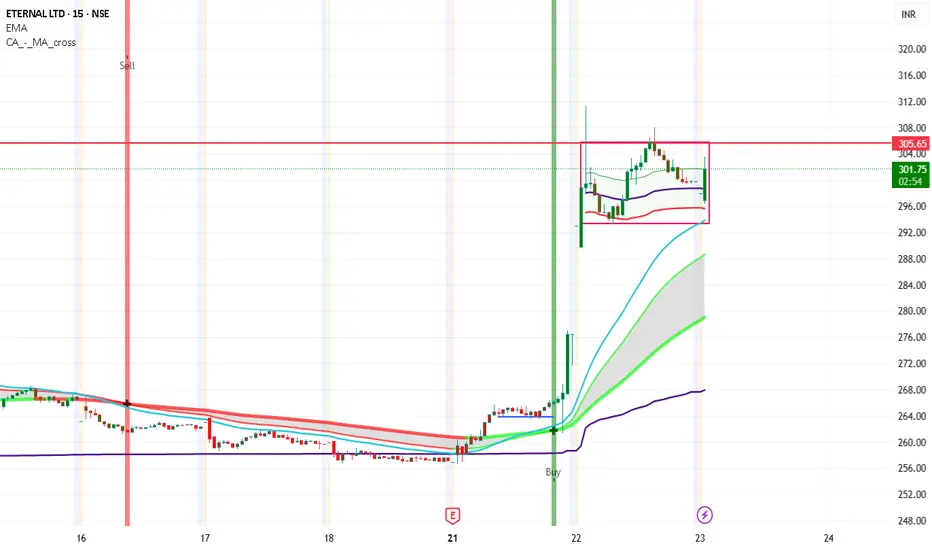
15 minutes candle looking good on Eternal Watch out for the 305 levels today, if the stock sustains around 305 levels .....it could blast further around 330 levels..this month
ETERNAL for LONGZOMATO/ETERNAL ....needs to breakout before it hits another level...It would be great if it sustains for few weeks around 300 levels

Eternal Ltd. Higher High pattern 252 -248 supportEternal Ltd. Higher High pattern 252 -248 support - As the market goes side ways, this may halt and take support around 250 to take a good bounce back towards 300 and more

ETERNAL | Watchlist | Cup and Handle |DailyGot it! Here’s the analysis for **ETERNAL LTD**:
---
### 🏆 **Pattern: Cup and Handle**
✅ **Cup:** The rounded bottom formation spanning from early April to late May 2025.
✅ **Handle:** Small consolidation / downward drift (flag-like handle) in late May.
✅ **Volume:** Strong spike at the breakout attempt in June – classic volume surge in breakout setups.
---
### ⚡ **Key Resistance:**
* **246.50 INR** is the neckline (horizontal resistance).
* **Price Action:** Currently testing this level.
---
### 📈 **Breakout Criteria:**
* Needs to **close above 246.5** on strong volume for breakout confirmation.
* If breakout is confirmed, measured move target = cup depth projected from breakout.
---
### 🥅 **Measured Move Target:**
* Cup depth = 246.5 - 199 = **\~47.5 INR**
* **Target after breakout:**
$$
246.5 + 47.5 = \boxed{294 - 295 INR}
$$
---
### 🔎 **Volume & Indicators:**
* Big volume spike during the breakout attempt (arrow mark).
* EMA stack alignment (EMA-8 > EMA-21 > EMA-55) = short-term bullish momentum.
* RSI & MACD could be used to confirm momentum if you want.
---
✅ **Next Steps:**
* Watch for a **daily close above 246.5** on above-average volume.
* If confirmed, potential upside target \~294 – 295 zone.

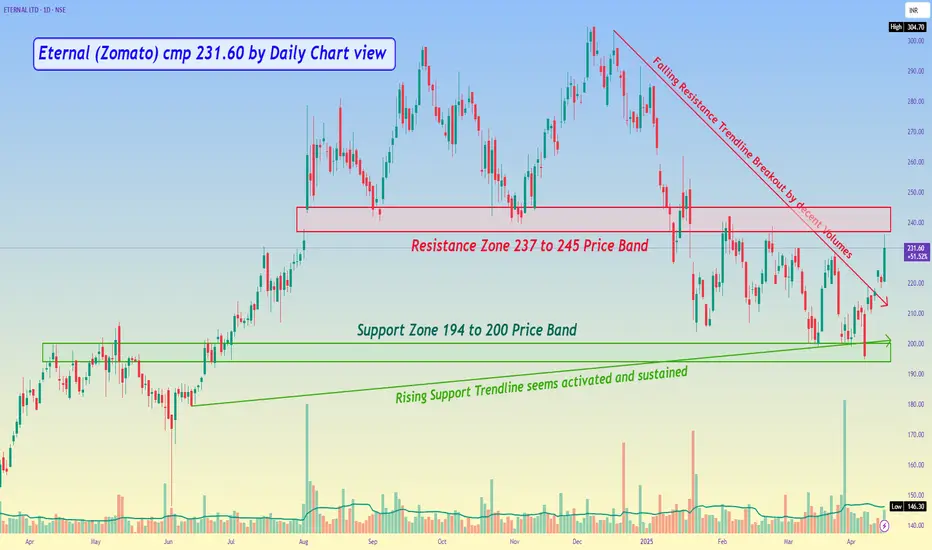
Eternal (Zomato) cmp 231.60 by Daily Chart viewEternal (Zomato) cmp 231.60 by Daily Chart view
- Support Zone 194 to 200 Price Band
- Resistance Zone 194 to 200 Price Band
- Falling Resistance Trendline Breakout by decent Volumes
- Rising Support Trendline seems to be activated and sustained
- Bullish Rounding Bottom completed at neckline of Resistance Zone level
- Fairly decent Bullish Double Bottom seems formed at Support Zone level
- Volumes spiking over past few days and in close sync to avg traded quantity