The Bearish take on EthereumETH’s price action isn’t resilience — it’s structural weakness.
• ETH failed to lead while BTC stabilized
• No rotation narrative — capital isn’t choosing ETH
• Underperformance is a signal, not noise
Ethereum doesn’t benefit from “digital scarcity.”
• Supply is policy-driven, not fixed
• Monetary credibility depends on human decisions
• In tightening cycles, that’s a liability
The “ETH = tech beta” story is now working against it.
• Risk-off hits growth assets first
• Fees down → activity down → narrative breaks
• Layer-2s dilute value capture, not enhance it
$2,000 isn’t just a round number — it’s structural.
• Prior demand zone
• Psychological anchor
• Forced positioning reset area
A move to $2K wouldn’t be capitulation — it would be repair.
If liquidity tightens, ETH likely overshoots downside first…
then finds real buyers near $2,000.
Weak hands exit above.
Strong hands step in below.
ETH

$100M Private Sale at $0.40... Now CMP Trading at $0.135$100M Private Sale at $0.40... Now Retail Can Buy at $0.135. First Time Retail Gets Better Entry Than VC
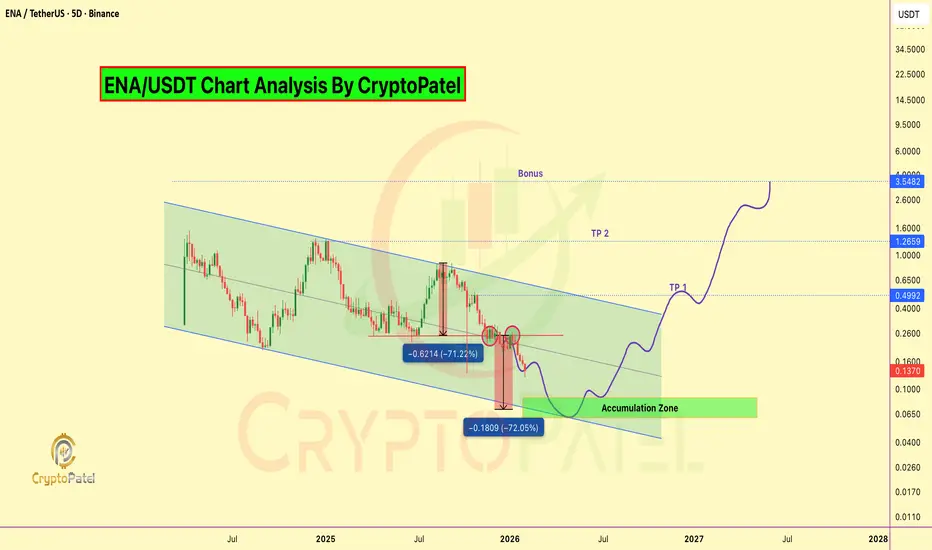
#ENA Is Trading Inside A Long-Term Descending Channel On The HTF Chart Since 2024.
Price Has Completed A Deep Multi-Leg Correction And Is Now Testing A Major Demand Zone At Channel Support.
Current Technical Structure:
✅ Descending Channel Intact
✅ ~92% Down From ATH
✅ Price Near Lower Channel Support
✅ Strong Accumulation Zone: $0.08–$0.06
✅ H&S Bearish Target For Long Term Accumulation is $0.07
✅ ~66% Below Private Investor Price (VC Discount Zone)
✅ Trump's World Liberty Financial Bought ~$5.15M ENA At ~$0.891 (Now ~$0.135 → ~85% Drawdown / ~$4.37M Unrealized Loss)
CryptoPatel Targets: $0.50 / $1.26 / Bonus $3+
As Long As ENA/USDT Holds Above The Accumulation Zone, A Relief Rally And Trend Reversal Remain Probable.
Why It Could Pump
✅ EURONEXT:USDE is now 3rd Largest Stablecoin ($5.8B)
✅ Fee Switch Coming Q1 2026 - stakers Get Protocol Revenue
✅ Building Own Blockchain
✅ Institutional Product (iUSDe) Launching Soon
✅ Major TradFi Backing
⚠️ Risks to Watch
❌ Heavy token unlocks until 2028
❌ Down 85% from ATH
❌ Similar model concerns to Terra/Luna
❌ Depends on positive funding rates
Invalidation & Risk Note: This is a high-risk, high-reward setup with elevated volatility. Strict risk management is essential.
TA Only. Not Financial Advice. ALWAYS DYOR.
UPDATE: $BTC Breakdown Playing OutUPDATE: CRYPTOCAP:BTC Breakdown Playing Out
Bitcoin dumped below $85k, now trading near $84.4k.
We called shorts at $95k–$98k, and price rejected from ~$98k, delivering nearly 12% downside already.
The bear flag breakdown remains active, downside continuation favored.
Targets: $75k → $70k
Invalidation: HTF close above $90,600
Until then: sell rallies, respect the trend.
Not financial advice. DYOR.

$PUMP MACRO SETUP | 1,000%+ UPSIDE IF HTF BASE HOLDSNYSE:PUMP MACRO SETUP | 1,000%+ UPSIDE IF HTF BASE HOLDS
#PUMP Is Trading Inside A HTF Accumulation Zone After Completing A Long-Term Descending Wedge, Signaling A Potential Macro Trend Reversal.
Technical Structure:
✅ Multi-Month Descending Wedge Breakout Confirmed
✅ Clean Breakout + Retest Of HTF Neckline
✅ Inverse H&S Pattern NeckLine Very Close to Breakout
✅ Strong Demand Holding Inside $0.0025 – $0.0022
✅ Structure Invalidate Below $0.00168 (HTF Close)
✅ Sustained Acceptance Above Accumulation Signals Continuation
CryptoPatel Expansion Targets: $0.00504 → $0.00867 → $0.01500 → $0.02297+
High R:R Setup If HTF Demand Holds And Expansion From The Base Continues.
❌ Invalidation: HTF Close Below $0.00168 Opens Downside Risk And Invalidates The Reversal Structure.
TA Only. Not Financial Advice. ALWAYS DYOR.

$RIVER Turned $1K Into $52K In 41 Days But Here’s Why I’m Not BuCRYPTOCAP:RIVER Turned $1K Into $52K In 41 Days But Here’s Why I’m Not Buying
CRYPTOCAP:RIVER Pumped 5,221% In 41 Days. From $1.616 (Dec 17) → $86 (Yesterday)
What Caused This Pump?
🔹 Arthur Hayes + Justin Sun ($8M) Backed It
🔹 $12M Funding Round With Big Investors
🔹 Sui Network Partnership
🔹 Listed On Binance, OKX, Bybit, Coinone
🔹 Only 20% Tokens In Circulation
🔹 One Whale Bought 50% Supply At $4
⚠️ My Warning:
👉 Don’t Try To Catch This Knife Now
👉 Strong Support Is At $8–$12 - High Chance Price Revisits $10–$15
👉 Fresh Longs At ATH = Very Risky
Key Risks:
🔴 Whale Controls 50% Supply: Dump Risk Anytime
🔴 Pump Driven By Leverage, Not Organic Demand
🔴 80% Tokens Still Locked
Conclusion:
Wait For A Proper Pullback
Don’t Become Exit Liquidity
DYOR
My Take:
Good Project, Very Risky Price Right Now
Wait For Cooldown Or Proper Structure
FOMO Is Not A Strategy

Chart Nobody Is Watching: BTC.D Could Trigger Biggest AltseasonThe Chart Nobody Is Watching: BTC.D Could Trigger The Biggest Altseason
Bitcoin Dominance (BTC.D) is currently trading at a major HTF distribution zone after printing a cycle high near 66%. Price faced a strong rejection from a Bearish Order Block + Fair Value Gap, confirming supply presence and bearish structural shift.
Technical Structure (HTF):
Cycle high formed at 66% (HTF supply zone)
Clear rejection from Bearish OB + FVG
Support trendline broken
Bearish retest completed near 60%
Structure remains bearish below 60–62%
BTC.D Downside Projection:
50–48% (first expansion zone)
44% (major HTF support)
40% (historical altseason peak zone)
A sustained move toward the 44–40% region has historically aligned with aggressive capital rotation from Bitcoin into altcoins, often marking the beginning of major altcoin expansion phases.
Invalidation: HTF close above 66%
This analysis is based purely on market structure and HTF supply/demand dynamics.
Just my personal view. Not financial or investment advice. Always do your own research.

POL/USDT MACRO SETUP | 1700%+ POTENTIAL IF HTF STRUCTURE HOLDSPOL is currently trading within a major higher-timeframe accumulation zone after a prolonged downtrend from the 2024 highs. Price is building a long-term base inside a falling wedge / descending channel, a structure that often precedes macro trend reversals.
Technical Structure
• HTF demand holding at $0.13 – $0.10
• Price compression near multi-year lows, indicating seller exhaustion
• Falling wedge approaching maturity (bullish reversal pattern)
• Macro structure remains valid above 0.097 (HTF close)
• A break and acceptance above ~0.17 is required for bullish confirmation
Expansion Targets (HTF): $0.286 / $0.435 / $0.704 / $1.20 / $2.00+
This presents a high risk-to-reward positional setup if HTF demand continues to hold and a confirmed breakout occurs with volume.
Invalidation: HTF close below $0.097
This analysis is for educational purposes only.
Not financial advice. Always do your own research.

$PUMP PRICE OUTLOOK | 500%–1000% POTENTIAL? #PUMP Is Trading In A Bullish Expansion Zone After Breaking Long-Term Descending Resistance On The Daily Chart.
Price Has Completed A Prolonged Distribution → Correction Phase And Is Now Showing Early Reversal Signals.
Current Technical Structure:
✅ Long-Term Descending Trendline Break Confirmed
✅ Descending Wedge Breakout Structure
✅ Strong HTF Demand Zone Holding (0.0023–0.0021)
✅ Multiple Support Reclaims Indicate Accumulation
✅ Strength Signal: Bullish Above $0.0021
CryptoPatel Targets: $0.00449 / $0.00644 / $0.00872 / $0.015 / $0.026
As Long As PUMP/USDT Holds Above $0.0021, The Bullish Bias Remains Intact.
This Is A High-Risk, High-Reward Accumulation Setup With Asymmetric Upside Potential.
Invalidation: Daily Close Below $0.0021
TA Only. Not Financial Advice. DYOR.

BTC | 8H Technical Structure UpdateBTC | 8H Technical Structure Update
Price Is Printing A Clear Ascending Triangle With Consistent Higher Lows Pressing Into A Well-Defined Horizontal Supply Zone At $94,500
Key Technical Levels:
🔹 Range High / Supply: $94,500 → $107,000
🔹 Ascending Trendline (Dynamic Demand): ~$88,000
🔹 HTF Demand / Structural Support: $78,000
Market Structure Read:
🔹 Compression Phase Ongoing
🔹 Volatility Expansion Imminent
🔹 Trendline Continues To Act As Acceptance Support
🔹 Liquidity Resting Above Range High
Scenarios:
✔️ 8H Close Above $94500 → Range Expansion Toward $106K+
❌ Loss Of Ascending Trendline → Structural Rotation To $78K
Market Is At Decision Point. Wait For Acceptance, Not Anticipation.

$SUI PRICE FORECAST | IS $20 POSSIBLE? CRYPTOCAP:SUI PRICE FORECAST | IS $20 POSSIBLE? | ANALYSIS BY CRYPTOPATEL
CRYPTOCAP:SUI Is Showing A Clear High-Timeframe Smart Money Re-Accumulation Structure On The Weekly Chart After A Deep Correction From 2024 Highs.
Market Structure Overview
After A ~76% Drawdown, Price Swept Liquidity At The Lows And Printed A Strong Reversal, Signaling Demand Absorption And Institutional Interest.
Technical Confluence
Weekly Bullish Order Block: $1.50 – $1.30
OB Aligned With Fair Value Gap (Strong Demand Zone)
~45% Impulse Move Already Delivered From This Area
Price Structure Respects A Rising Channel
HTF Bias Turning Bullish
👉 Best Entry Zone ($1.50 – $1.30) Was Shared Earlier, Cleanly Filled, And Has Already Given ~45% Profit On A Short-Term Swing.
Targets (HTF Expansion)
TP1: $4.8 (Previous Weekly Resistance)
TP2: $18 – $20 (HTF Expansion + Psychological Zone)
⚠️ Invalidation
Weekly Close Below $1.20 Breaks The Bullish Structure
Final Thoughts
This Is A Patience-Based Weekly Setup, Not A Short-Term Trade. As Long As Price Holds Above The Bullish OB, Upside Expansion Remains The Higher Probability Scenario.
Disclaimer: TA Only. Not Financial Advice. Markets Are Probabilistic. Always Do Your Own Research.

$LINK Price Outlook | Is $100+ On The Table? | CryptoPatelBIST:LINK Price Outlook | Is $100+ On The Table? | CryptoPatel
BIST:LINK Is Showing Strong Signs Of A Macro Bullish Reversal After Holding A Multi-Year Support Zone On The 2W Timeframe. The Current Structure Suggests A High-Timeframe Trend Shift That’s Been Building Since The 2021 Top.
Technical Breakdown (HTF):
✅ Breakout And Retest Confirmed
✅ Strong Accumulation Zone: $9 – $12
✅ Holding Above The 0.618 Fibonacci Level ($9.88)
✅ Higher Lows Forming → Macro Trend Turning Bullish
✅ Major Resistance Zone: $25 – $31 (Expansion Trigger)
Upside Targets (CryptoPatel): $31/$52/$90 – $100 (~780% Potential Cycle Move)
Bullish Thesis:
As Long As BIST:LINK Holds Above $7, The Macro Bullish Structure Remains Valid. This Is A Patience-Based, High-Timeframe Setup With A Strong Risk-To-Reward Profile For Spot Positions.
Invalidation:
❌ Weekly Close Below $7
Disclaimer:
Technical Analysis Only. Not Financial Advice. Markets Are Probabilistic—Always Do Your Own Research.

$ASTER PRICE FORECAST | CAN ASTER HIT $10–$15? | ANALYSIS BY CPBINANCE:ASTERUSDT | Breakout Structure From HTF Accumulation | TA By CryptoPatel
ASTER is trading at a high-timeframe accumulation base following a prolonged corrective phase. Price compression near demand indicates trend exhaustion with increasing probability of a bullish expansion.
Technical Structure
Accumulation range holding: 0.65 – 0.75
Descending trendline pressure building
Strong demand reaction inside accumulation zone
Volatility contraction → expansion setup
Key Levels
Bullish While Above: 0.65
Invalidation: Daily close below 0.60
Upside Targets: $1.50/$2.00/$5.00/$10.00/$15.00
If price accepts above the range high, structure supports a multi-leg continuation move.
😄 Fun Note: Market whispers say even CZ might be quietly watching ASTER, accumulation phases tend to attract smart eyes.
Disclaimer: This is technical analysis, not financial advice. Markets are probabilistic. Manage risk accordingly.

ETHEREUM 2026 ATH Price Forecast | Bitcoin Halving Cycle AnalysiThis study observes Ethereum’s historical behavior relative to Bitcoin halving events. The purpose is to highlight recurring market structure patterns, not to provide financial or investment advice.
Observed Historical Cycles
2016 Bitcoin Halving
~70% drawdown in ETH
~546 days of sideways accumulation
Followed by a multi-year expansion phase (~22,800% peak move)
2020 Bitcoin Halving
~75% drawdown in ETH
~546 days of consolidation
Subsequent expansion to ~$4,693 (+2,600% approx.)
2024 Bitcoin Halving (Current Cycle)
~66% drawdown observed
~609 days of consolidation (ongoing)
Market structure remains comparable to prior accumulation phases
Key Observation
ETH trading within the $2,600–$3,000 range aligns with previous long-term accumulation zones seen before historical expansion phases.
Forward-Looking Scenario (Cycle-Based Projection)
If historical rhythm continues, the next expansion window may extend into 2026, with hypothetical price zones often discussed by market participants between:
$10,000
$15,000
$18,500+
These levels represent cycle-based projections, not price guarantees.
Conclusion
Ethereum has historically followed a pattern of deep drawdowns, prolonged consolidation, and later expansion after Bitcoin halving events. Whether this cycle continues to rhyme remains to be confirmed by future market behavior.
This analysis is for educational and informational purposes only. Always conduct independent research and risk assessment.

Will Bitcoin Hit $50,000 or $500K In Next Cycle ?Most People Still Don’t Understand What This #Bitcoin Chart Is Saying.
This Is The 12-Month CRYPTOCAP:BTC Structure.
It Has Been Respected For 15 Years.
Every Cycle:
Excess → Reset → Higher Floor → Expansion.
All Called “The End.”
All Were Structural Resets.
Here’s The Part Retail Misses:
Bitcoin Is Now Holding Above Its Previous Cycle High, Historically The Most Bullish Phase Of The Cycle.
That’s Not Optimism.
That’s Market Memory.
No Price Targets.
No Narratives.
Just Structure Doing What It Always Does.
If You’re Waiting For Certainty, You’ll Buy Late.
If You Understand Cycles, You Already Know What Comes Next.
🟠 Bitcoin Doesn’t Need Belief. It Needs Time.
IMO:
2026 For Bitcoin Will Likely Be Bearish, And We Could See Bitcoin Under $50K Based On Previous Fractals And Cycle Analysis.
However, 2027–2028 Could Be Massive For Bitcoin, And We May See $500K Within The Next 4 Years, In My Opinion.
This Is Just My Personal View, Not Financial Advice.
Always DYOR Before Any Investment Decisions.

$ETH at a Critical HTF Support Inflection.CRYPTOCAP:ETH at a Critical HTF Support Inflection.
$2,890 is the Structural Demand level.
Acceptance above this level Preserves Bullish Market Structure.
If Support Holds → Upside Continuation Toward $3,650 and $4,250.
Failure to Hold → Bullish Thesis Invalidated.
Binary Zone. Directional Expansion Pending.
NFA & DYOR

Will SOLANA potentila to $1000?Many people are emotionally attached to Solana and the $1,000 target and that may be possible long term.
But markets never move straight up.
Corrections are part of every cycle, and CRYPTOCAP:SOL is currently in a correction phase.
If the $120 support breaks, I’m expecting SOL to drop below $100.
A move under $100 could offer a strong long-term accumulation opportunity.
My accumulation zone: $98 – $50
Long-term outlook: $500 – $1,000
Crypto is highly volatile and risky.
Always DYOR, manage risk properly, and this is not financial advice (NFA).

Bitcoin bearish scenario updateCRYPTOCAP:BTC Update
#Bitcoin is still trading below the key $93K–$94K resistance, so my bearish bias remains unchanged.
As long as price stays below this HTF bearish OB, I’m expecting continuation toward $75,000.
❌ This Bearish scenario only invalidates if we get a strong HTF close above $94,000.
Until then: rallies = selling pressure. Stay disciplined & manage risk.
NFA & DYOR

$BONK Technical Analysis Update by CryptopatelSIX:BONK Technical Analysis Update by Cryptopatel
Current Structure:
SIX:BONK has broken key support at $0.00001 and is currently retesting the level.
Red zone: $0.000010 – $0.00001125.
Price below this zone = bearish, high probability of testing Bullish Order Block between $0.00000450 – $0.00000350, which is the prime accumulation area.
Retracement Outlook:
If SIX:BONK fails to reclaim $0.00001, expect 50%–70% retracement in the next few weeks.
Bullish Flip:
Key breakout required: $0.00001250.
Closing above this Red box signals super bullish momentum, potential 200%–400% upside.
Trade Watch:
Red zone $0.000010–$0.00001125 = critical level to enter trades.
Monitor price reaction at Bullish Order Block for optimal accumulation.
Summary:
Below $0.00001 → Bearish / accumulation phase
Above $0.00001250 → Super bullish breakout
TA Edge: Discipline on zones + clear breakout confirmation = key to maximizing gains.
NFA & DYOR

$BNB: Key HTF Decision Zone AheadCRYPTOCAP:BNB : Key HTF Decision Zone Ahead
#BNB is still holding above the critical $700–$550 demand zone, the same area that defines the continuation or breakdown of the current macro trend. As long as price maintains this support, HTF structure stays bullish and the next expansion wave targets $1500 → $2000 → $2500 → $3000.
A weekly close below $550 would flip structure bearish and open a deeper correction toward $250–$170.
Key Levels
Accumulation Zone: $700–$550
Upside Targets: $1500 / $2000 / $2500 / $3000
Invalidation: Weekly close < $550
BNB is at a major decision point: Hold the zone and bullish momentum accelerates; lose it and trend resets.
NFA & DYOR

RENDER will hit $15?CRYPTOCAP:RENDER Technical Update
Price is in a bearish corrective phase and currently reacting at the 0.618 Fib zone ($1.55–$1.25), A key area for potential bullish reversal. Holding this zone increases the probability of a strong upside continuation toward $4.6 / $8 / $13 / $20.
If this support breaks, the next major demand lies at the 0.786 Fib level (~$0.84), considered the optimal accumulation zone before any trend shift.
Key Zones:
0.618 Support: $1.55–$1.25
0.786 Support: $0.84
Targets: $4.6 / $8 / $13 / $20
NFA Always DYOR

ETH/USDT Bullish Reversal SetupETH/USDT Bullish Reversal Setup
The chart shows a clear transition in ETH as price moves from a prolonged distribution-driven decline into a developing accumulation range. After weeks of consistent bearish structure, the market finally printed multiple upside shifts, signaling that sell-side pressure is weakening and liquidity behavior is changing.
The recent impulsive rally out of the discounted range confirms that buyers are actively defending lower levels. Price is now pulling back toward a short-term demand pocket formed during the breakout. This area represents the first meaningful accumulation zone after the market broke a series of internal swing points.
As long as price maintains stability within this demand block, the structure favors continuation toward the next major liquidity cluster above. The next upside draw is positioned around the 3,440–3,500 region, where previous inefficiencies and unmitigated zones converge. That region also holds resting buy-side liquidity, making it the logical target for a future expansion move.
The current market behavior suggests that ETH is in the early phase of a bullish repricing cycle. A controlled pullback into the highlighted zone—followed by a reaction—would confirm continuation and attract momentum buyers aiming for the higher liquidity magnet.
Overall, this chart reflects a shift in narrative: sellers are losing dominance, the market is building a fresh bullish structure, and the path of least resistance is gradually tilting upward as long as the demand zone remains protected.

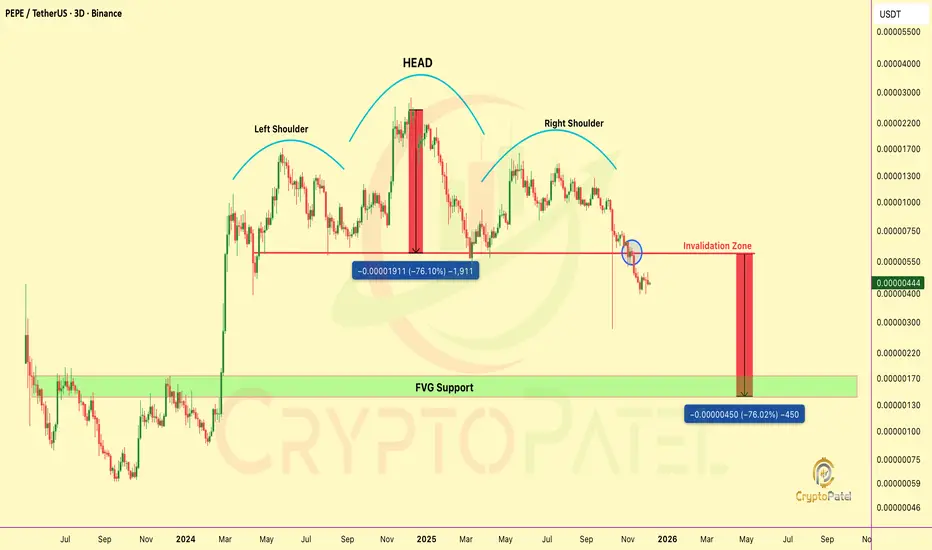
$PEPE TA Update: What PEPE Head & Shoulder Pattern Say?CRYPTOCAP:PEPE TA Update: What PEPE Head & Shoulder Pattern Say?
Head & Shoulders = Bearish
70% retracement possible ( Neck Line Support Broken )
Key Support $0.000006, Now Strong neckline support became strong resistance
Below NeckLine Support = 50-70% drop to $0.00000150
Hold & reclaim $0.000006 = bullish Reversal
NFA & DYOR
ETH Premium OB & FVG Zones – ChoCh Could Hit at $3,660ETH Premium OB & FVG Zones – ChoCh Could Hit at $3,660
Market remains in a Bearish Structure with steady LH → LL and clean BOS down. The current upward move is just a retracement into premium.
Key Zones:
FVG: $3,250–3,350 – First Reaction Zone for Short Entries
Bearish OB: $3,600–3,660 – Prime Supply Zone for Shorts
Shorting Strategy:
If you are Shorting ETH, these are the best levels to scale in.
Caution:
Any HTF candle closing above $3,660 Bearish OB signals a ChoCh. Exit shorts immediately, Trend flips bullish, opening the path toward new ATH.
Below $3,660 → bearish continuation likely
Above $3,660 → trend flip, bullish momentum expected
Until the OB break happens, bias stays bearish.
NFA & DYOR
