$TAO HTF SMC: Who’s Ready for the $1,000+ Expansion?GETTEX:TAO HTF SMC: Who’s Ready for the $1,000+ Expansion?
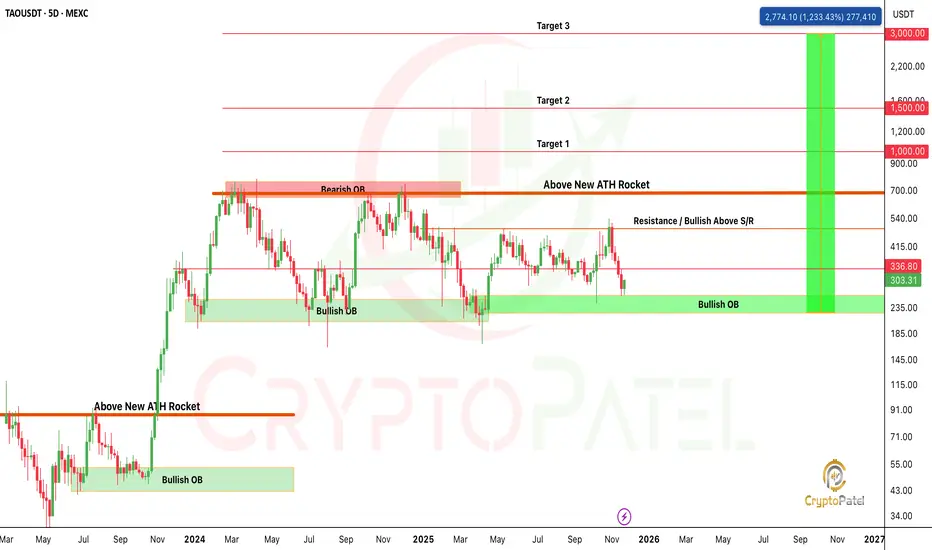
Price continues to respect the HTF Bullish Order Block (OB) at $235–$185, which remains the primary demand zone maintaining bullish order flow. Each mitigation of this OB has previously generated strong displacement to the upside, confirming active institutional interest.
The current range is defined by:
🔹 HTF Demand (Bullish OB): $235–$185
🔹 Mid-Range S/R: $540
🔹 HTF Supply (Bearish OB): $640–$700
A decisive close above $540 S/R will shift the internal structure bullish and validate a premium re-pricing phase targeting the HTF Supply at $640–$700.
A clean break of structure (BOS) above $700, combined with a displacement candle, will confirm HTF trend continuation and open up extended liquidity targets:
Target 1: $1,000
Target 2: $1,500
Target 3: $3,000
As long as price maintains the $235 Bullish OB, the HTF narrative remains bullish, with expectation of a sweep of upper-side liquidity and expansion toward unmitigated supply zones.
NFA & DYOR
ETH
BTC Dominance Crashes Below EMA50: Altseason Countdown StartedBTC Dominance Crashes Below EMA50: Altseason Countdown Officially Started.
Bitcoin Dominance is set to close another weekly candle below the EMA50, confirming the trend shift we’ve been tracking since April–May 2025. The rejection happened exactly at the same technical point highlighted months ago and once again, BTC.D has broken its support trendline and failed the bearish retest.
This structure is:
Weekly close below EMA50 → structural weakness
Bearish retest rejection → continuation signal
Trendline breakdown → momentum shift away from BTC
If Bitcoin simply stops dumping, the setup for alts becomes explosive. The liquidity rotation is already visible under the surface and historically, this is where altcoins begin their strongest multi-month expansions.
I’ll repeat what I’ve been saying:
A massive Altseason is around the corner.
Based on the technical roadmap, Bitcoin Dominance sliding into the 48%–40% zone would mark the final leg of a full-scale altcoin cycle and likely our ideal exit region for major alt positions.
Stay ready. The next 12 months could be the biggest window for altcoin outperformance in years.
NFA & DYOR

STOP SCROLLING: BITCOIN TECHNICAL ALERT (3-Year Support Break)🚨 STOP SCROLLING: BITCOIN TECHNICAL ALERT (3-Year Support Break) 🚨
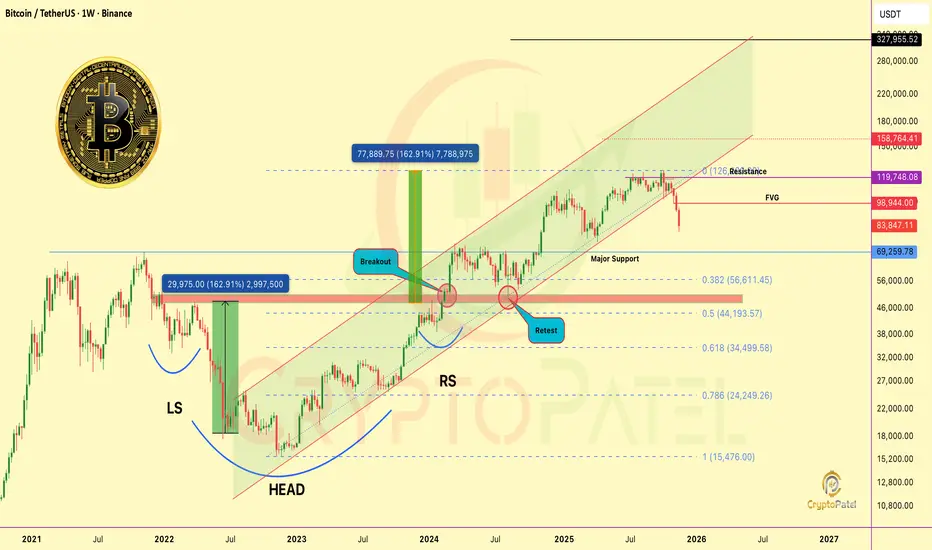
Bitcoin has broken a long-term support channel that’s been respected since 2022. That multi-year channel support was around $108,000 and I warned there to protect capital and trade safe.
Result: Breakdown.
✅ BTC dumped over -25%
✅ Now trading near $83,000
Structure Still Bearish
Trend remains bearish unless BTC reclaims the broken channel.
A Relief bounce is still possible toward: $93,000 / $98,000
But treat that as corrective unless structure flips.
Major Support: $69,000 is a critical level, Last bull-run ATH and strong demand zone. Watch it closely.
If This Channel Break Plays Out Fully…
As a Technical Analyst, I can’t sugar-coat the math.
When a multi-year channel breaks, the natural downside targets usually align with major Fibonacci retracement zones:
Deep Retracement Targets (Bear Case)
0.5 Fib: $44,193 (~60% probability)
0.618 Fib: $34,500 (~30% probability)
0.718 Fib: $24,250 (~10% probability)
These aren’t fantasies. They’re standard TA outcomes after this type of structural failure.
Important: This Is Not Panic
I’m not here to spread fear.
I’m here to state what the chart is objectively signaling.
Markets don’t move on hope, They move on structure, liquidity, and trend mechanics.
If price goes into that 0.5–0.718 Fib zone, it would be painful short-term…
but also a once-in-cycle accumulation window for long-term holders.
CryptoPatel Note:
Believe me, I want BTC at $1M+ in the future.
But wanting isn’t analysis.
My job is to map both paths: bullish and bearish, Before they happen.
Save this post. Mark the levels. Trade safe.
Because when a 3-year support breaks, the market doesn’t whisper, it screams.
NFA & DYOR
XVG Was pumped 13000000% in 2015-2017 so what Next?Crypto History Reminder:
SGX:XVG was one of the most explosive rallies of the 2015–2017 cycle, a 13,000,000% (13M%) move in under two years. Despite the noise, it still trades +296,000% above its 2015 baseline.
OGs know the John McAfee era was a major catalyst, but the market is no longer driven by personalities, it’s driven by structure.
Technically:
As long as XVG holds the $0.004 support, trend bias remains bullish on higher-timeframe structure.
Cycles repeat. Narratives change. Price action doesn’t lie.
NFA & DYOR

$BTC Just Printed Another LL: Next Draw Is Locked InCRYPTOCAP:BTC Just Printed Another LL: Next Draw Is Locked In
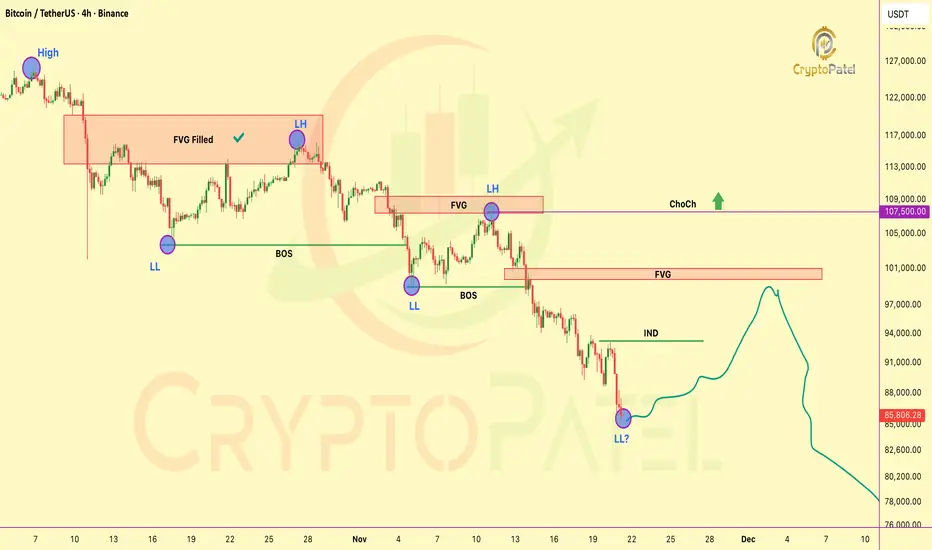
Market is maintaining a clear bearish orderflow with continuous LH → LL sequence.
Structural Notes
🔹 Previous major FVG (distribution zone) has been fully filled and delivered downside.
🔹 Multiple BOS events confirm continuation of the bearish leg.
🔹 Recent sweep followed by another LL shows sellers still in full control.
🔹 INDUCEMNET zone rests around $93160, high-probability inefficiency for short-term retracement.
🔹 Major unmitigated FVG remains at $100800, acting as a premium draw if price seeks liquidity.
Expectations
🔹 Retracement likely into nearby inefficiencies:
🔹 IND @ $93160 → high-probability mitigation
🔹 FVG @ $100800 → medium-probability mitigation (only if deeper pullback unfolds)
🔹 Trend remains bearish until market delivers a ChoCh above $107.5K.
Current Bias: Bearish
Short-Term Draw: IND (mid-range inefficiency)
Mid-Term Draw: Unmitigated FVG (premium zone)
Invalidation: ChoCh above $107.5K
NFA & DYOR
Bitcoin Most Critical 40 Days of the Entire Cycle🚨 Bitcoin Most Critical 40 Days of the Entire Cycle 🚨
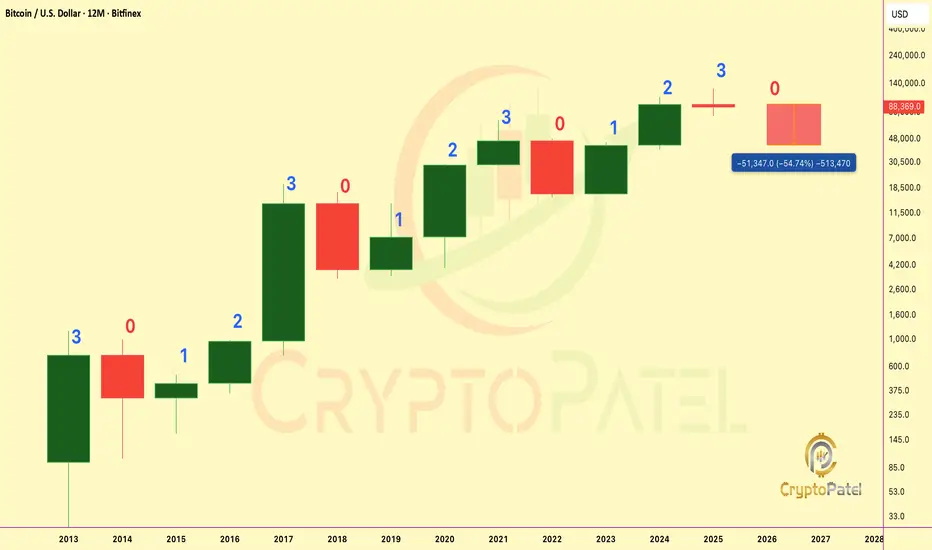
CRYPTOCAP:BTC Yearly Fractal is clear: RED → 3 GREEN → BIG RED.
2025 = Candle 3, historically the strongest and always breaks ATH.
Bitcoin can hit a new ATH ONLY this year.
If BTC does not break ATH in the next 40 days, history shows it never breaks the 3rd candle high the following year: Meaning 2025 becomes the cycle top, and 2026 turns into a 50–70% retracement year ($30k–$40k).
✔ Break ATH → $150k–$180k
❌ No ATH → Biggest Correction of the Cycle in 2026
NFA & DYOR
$ETH UPDATE – FVG FILLED & STRUCTURE CLEANEDCRYPTOCAP:ETH UPDATE – FVG FILLED & STRUCTURE CLEANED
CRYPTOCAP:ETH just bounced perfectly from the $2,880 FVG and the entire downside imbalance is now fully filled, meaning no remaining bearish FVGs below.
Structure is clean… Ethereum is now technically READY for upside continuation.
Only one concern:
👉 Bullish OB zones: $2,622 & $2,256
If we dip into these OB levels → that’s the BEST accumulation zone for a $10K–$15K ETH target in the next cycle.
Don’t miss any major dip on Ethereum imo.
Smart money accumulates when the chart is clean and now it is. 🚀
NFA & dYOR

#ETHEREUM Technical Update: $3000 Hit Exactly as Mapped#ETHEREUM Technical Update: $3000 Hit Exactly as Mapped
CRYPTOCAP:ETH has tapped the $3000 zone, exactly as projected when price was breaking down from the $4000 bearish breakdown + retest.
We’re now ~30% down from the short-entry region.
If you shorted, you booked heavy profits.
If you didn’t, at least you avoided longing the top above $4000+
This is where the prime accumulation zone begins.
Key levels to watch:
🔵 $3000: First accumulation zone + bullish OB (Possible bounce reaction from here.)
🔽 Next support: $2400
Major Accumulation Zones:
0.5 FIB: ~$2621
0.618 FIB: ~$2255
If ETH sweeps into these FIB/FVG pockets, that becomes the high-discount, prime long-term accumulation zone.
Macro view unchanged: Long-term Target: $10K–$15K
Stay patient. Stick to structure. Accumulate smart, not emotional.
NFA & DYOR

Warning: $ETH Is About to Hit Its Most Critical Zone of 2025!Warning: CRYPTOCAP:ETH Is About to Hit Its Most Critical Zone of 2025!
Macro Structure
ETH remains macro bullish, currently in a healthy correction after rejecting the premium zone near $4,960.
The strong displacement from $1,577 (0.618 Fib) confirmed bullish structure, but price is now retracing into discount levels.
Key Fibonacci Levels
Measured from $879 → $4,960, ETH is deeply entering ICT discount territory:
0.382 – $3,048 (Tested)
0.500 – $2,622
0.618 – $2,256 ← Top probability zone
0.786 – $1,821
FVG & OB Zones (Major Decision Area)
1️⃣ Unfilled FVG → $2,875
👉 This is the most important decision point right now.
👉 High probability that ETH will fill this FVG.
👉 If price holds above this FVG, bullish continuation becomes very strong.
👉 If ETH fails to hold $2,875, expect the correction to deepen.
2️⃣ Next Major Support
Bullish OB: $2,622 – $2,256
→ Perfect confluence of Order Block + 0.5/0.618 Fib.
👉 This is the strongest demand zone on the entire chart and a top accumulation area.
Expectations
Most likely:
ETH fills the $2,875 FVG, then either bounces → resumes uptrend
or
breaks down → moves into $2,250–$2,620 OB to accumulate before the next macro leg.
Targets After Correction: $4,058 / $4,960 / $5,800 / $7,200 (1.618 extension)
Conclusion
ETH remains strongly bullish on HTF.
Watch $2,875 FVG as the key decision level.
If lost → $2,250–$2,620 OB becomes the premium accumulation zone before ETH heads toward new ATH.
NFA. DYOR.

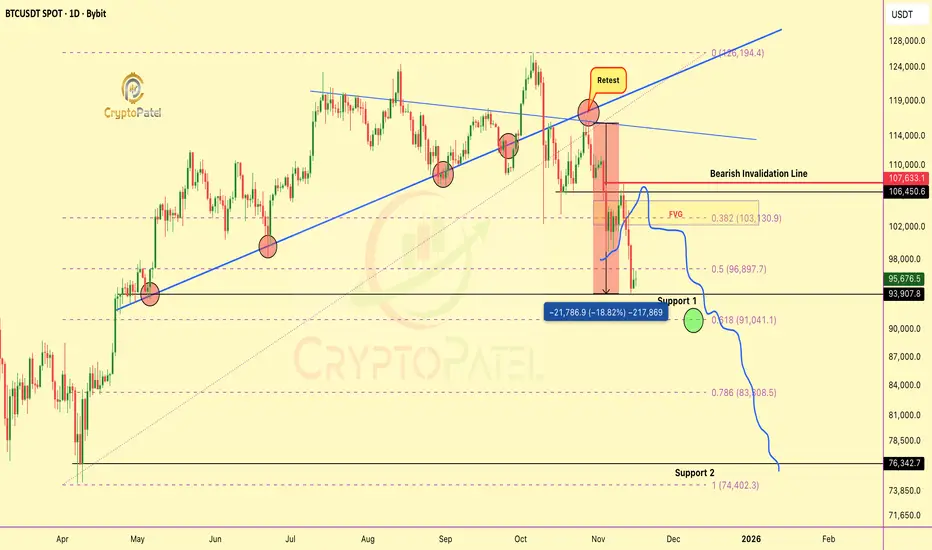
#BTC Technical Update: Structure Playing Out With Precision#BTC Technical Update: Structure Playing Out With Precision
CRYPTOCAP:BTC has tapped the $95K zone, completing the corrective leg projected when price was rejecting the $115K–$110K range.
Key downside levels already reached:
➡️ $105K ✔️
➡️ $93K ✔️
As long as price fails to break and close above $107,500, the bearish structure remains intact and the next liquidity target becomes: $73K
A confirmed close above $107.5K invalidates the bearish leg and reopens the path toward a new ATH.
Critical zones to watch:
➡️ 0.5 FIB — structural reaction level
➡️ 0.618 FIB — high-probability reversal pocket
🔻 Bearish below $107.5K
🔺 Bullish above $107.5K
Price is respecting structure with accuracy.
Charts > emotions. Levels > noise.
NFA & DYOR
Bitcoin Next move $70k or $120k?CRYPTOCAP:BTC Is About to Bounce From the Level Everyone Is Ignoring
CME Gap 👉 $91,170
FVG below 👉 $89,020
Both zones = liquidity magnets.
No upside CME gaps left… only 1 upside FVG at $120,370
My view:
Fill → Sweep → Strong bounce expected from $89K–$91K range.
Next major draw = $120K FVG.
NFa & DYOR
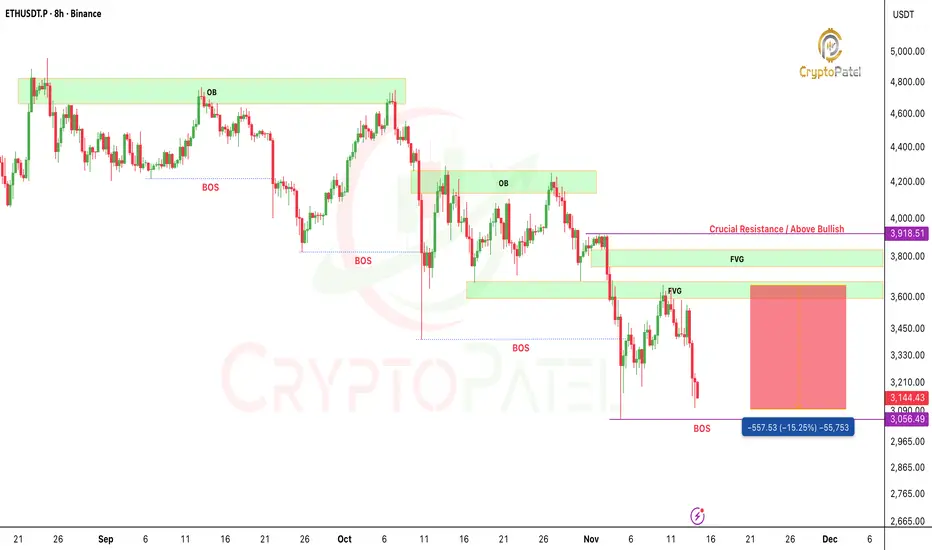
ETHEREUM Bearish Target achieved CRYPTOCAP:ETH has tapped the $3150–$3110 zone, a clean 15% move from our premium setup.
Perfect FVG fill + redistribution structure.
Huge profits for those who executed. Liquidity continues to lead.
NFA & DYOR
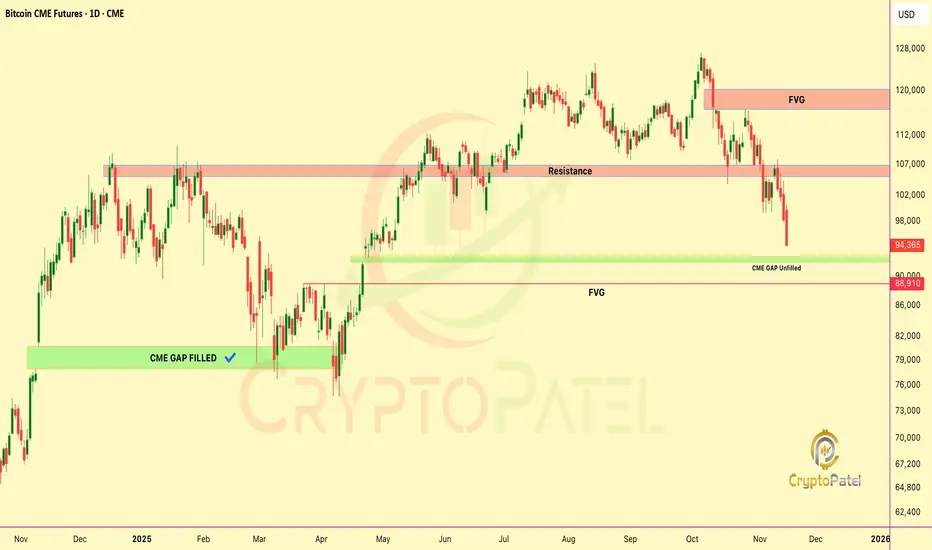
BITCOIN CME Gap Alert: CME GAP around $91000BITCOIN CME Gap Alert:
As per CME chart, Bitcoin still has an unfilled gap between $91,970 – $92,730.
In my opinion, BTC must revisit around $91,970 to fully close this gap.
Price usually returns to CME gaps because they act as liquidity zones and market inefficiencies, the market tends to fill them before continuing the main trend.
NFa & DYOR

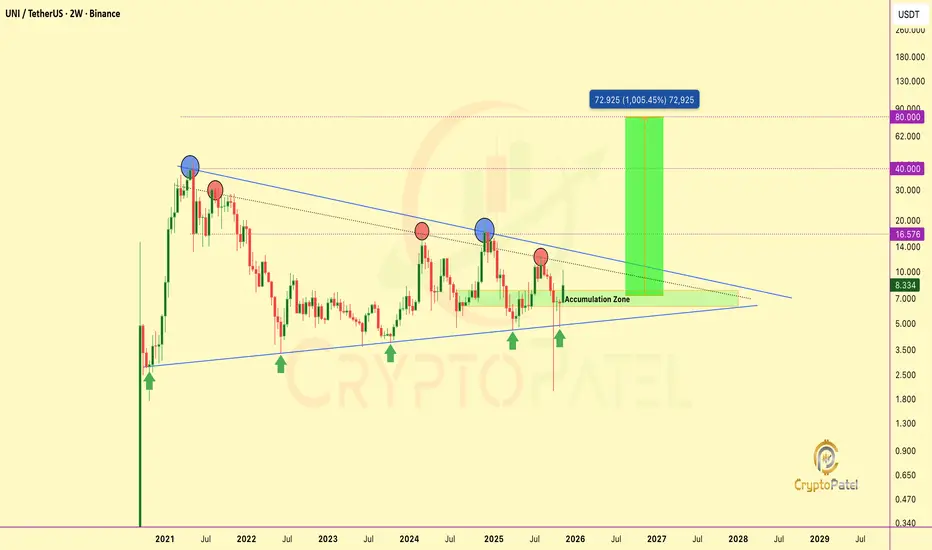
$UNI TA + FA align: Breakout loading toward $80CRYPTOCAP:UNI TA + FA align: Breakout loading toward $80
#UNI is coiling inside a multi-year descending triangle, with strong accumulation at $6–$7.
A breakout above $9–$10 could confirm a macro trend reversal toward $16.5 → $40 → $72+
Catalyst: Uniswap CEO Hayden Adams proposes turning on protocol fees, burning UNI & making it deflationary.
TA + FA = Bullish Expansion Loading...
NFA & DYOR
#BITCOIN TECH UPDATE: BEARISH IN CONTROL#BITCOIN TECH UPDATE: BEARISH IN CONTROL
CRYPTOCAP:BTC is down 14% from $115K retest, clean rejection.
Trend remains bearish, structure forming lower highs & lower lows.
Key Zones:
Relief zone: $105K–$108K (short setup area).
Major support: $94K → break below = $76K next.
Momentum:
Selling pressure dominates; no bullish divergence yet.
Invalidation:
Only a close above $111.5K flips bias bullish toward $150K. ( Super Bullish Above $116.5K)
Plan:
Sell rallies. Manage risk. Avoid FOMO longs.
NFA & DYOR

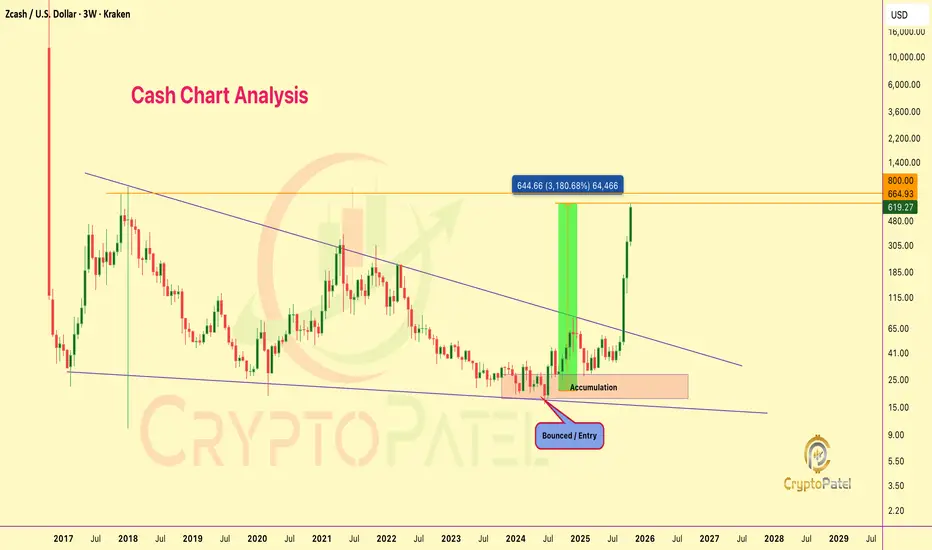
When I called $ZEC at $20, they laughed. Now it’s $662. When I called CRYPTOCAP:ZEC at $20, they laughed. Now it’s $662. Still think I’m crazy?
From our call at $20–$24, CRYPTOCAP:ZEC just went insane: Now at $662 🤯
That’s a massive 3100% GAIN from entry.
I told you legends about that $800 target, and we’re almost there!
Hope you’re counting profits and maybe ordering that new LAMBO already 🏎️
Who believed when I said #Zcash would rise again?
NFA & DYOR
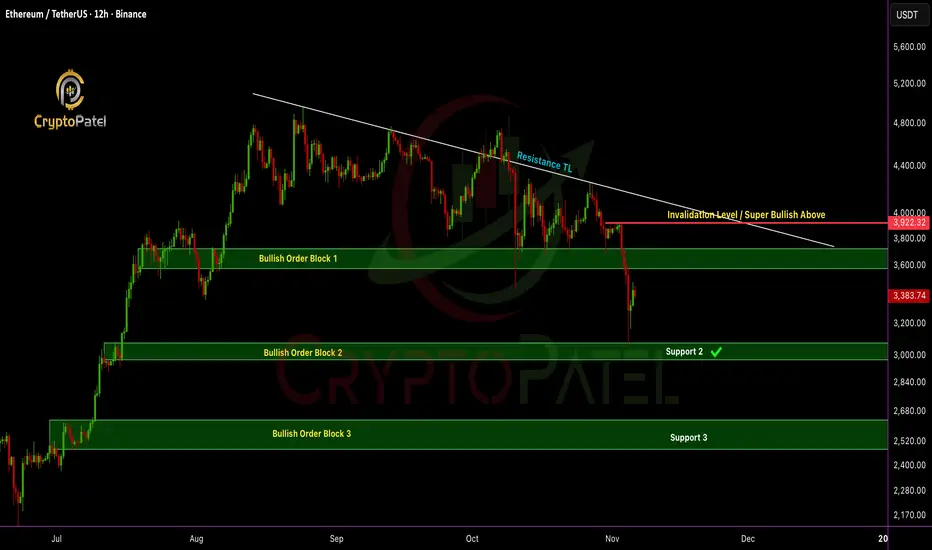
ETH/USDT dumped 20% after my analysisETHEREUM Update: Price just hit the bullish order block at $3,057 and bounced exactly as predicted ✅
Quick recap:
✅ Short-term: I’m bearish below $3,920, next potential leg down $2,500–$2,200 if $3,000 support breaks.
✅ Medium-term: Holding $3,000 support is key, could spark the next bullish wave.
✅ Long-term: Still super bullish & Target remains $10K–$15K ETH
Paper hands panic. Legends load the blood & hold.
Which one are you? 👇
NFA & DYOR
BTC First Weekly BB Break Since March: This Changes EverythingFirst Weekly BB Break Since March: This Changes Everything!
Bitcoin is currently testing a key support zone around $104K, forming what appears to be the 5th major support retest in this ongoing bullish cycle.
Historical Pattern Insight:
Each of the previous four support retests (1–4) led to substantial rallies ranging from +70% to +200%, as shown in the green zones.
If the pattern repeats, the next potential upside move (Wave 5) could project CRYPTOCAP:BTC toward the $200K region, marking a ~100% upside from current levels.
New Technical Development:
This week marks Bitcoin’s first breach of the lower Bollinger Band (BB) on the weekly timeframe since March, signaling heightened volatility and potential exhaustion of the current corrective phase.
Bearish Scenario:
A confirmed breakdown below this critical support could trigger a deeper correction toward the $50K area (–55%), similar to previous cycle corrections highlighted in red.
Key Levels to Watch:
🔹 Support: $103K–$100K
🔹 Resistance: $110K, then $135K
🔹 Upside Target: $200K
🔹 Downside Risk: $50K
Indicators:
Bollinger Bands remain squeezed, indicating volatility expansion is near. The weekly mid-band continues to act as dynamic support, but a sustained close below it could shift the bias short-term.
🟩 Bullish Bias remains valid above $100K, invalidated only on a weekly close below support.
🟩 Pattern repetition or deviation here will define Bitcoin’s next macro leg.
NFA & DYOR

ATTENTION: Bitcoin May Revisit $55K?⚠️ ATTENTION: Bitcoin May Revisit $55K: Here's The HTF Order Block You Need To Know
Don’t panic, this is not a bear market, just a retracement before the next leg up. My current plan:
▶️ Buy Zone: $65,000 – $55,000 (strong support)
▶️ Previous Exit: $122,000 (if you followed my earlier call)
*Chart Insight:*
▶️ 3W timeframe forming an Inverse Head & Shoulders, usually bullish.
▶️ But this pattern is forming near the top, not the bottom → high probability trap.
*Why I’m confident:*
▶️ Strong FVG & Order Block between $65k–$55k = prime re-accumulation zone.
▶️ Next target: $200k – $300k in the medium term.
Patience + strategy > chasing tops. Let the market come to your zones.
NFA & DYOR

While others panic, $VIRTUAL is Breaking out. Next leg incoming!While others panic, SPARKS:VIRTUAL is Breaking out. Next leg incoming!
While the whole market is bleeding, SPARKS:VIRTUAL is quietly showing strength and breaking its long-term bear trendline, this is not just noise, it’s a confirmed shift in market structure.
Technical Outlook:
🔹 Price has flipped into bullish mode on HTF structure.
🔹 Holding above $1.35 keeps momentum alive, this is the key level for continuation.
🔹 Next resistance targets: $5 → $7 → $10 zone.
🔹 A dip below $1.35 could retest the $1.00 demand area, a golden entry for strong hands.
🔹 Only a confirmed close below $0.70 would invalidate the long-term bullish setup.
Sentiment Check:
While others panic, smart money is accumulating. The trend reversal is already in play, early positioning matters most.
SPARKS:VIRTUAL has officially flipped the script.
If price holds structure, expect a massive momentum rally once the market stabilizes.
Remember: Fear creates opportunities. Charts don’t lie, price action speaks louder than noise.
Not financial advice. Do your own research.

$HYPE/USDT Breakdown Confirmed: 30–60% Downside Incoming!$HYPE/USDT Breakdown Confirmed: 30–60% Downside Incoming!
Price broke critical support + completed a bearish retest. I'm positioning for a 30-60% correction from current levels.
TARGET ZONE: $20-$25
Why I'm Bearish Short-Term:
✅ Support turned resistance after break
✅ Already pumped 500%+ in 6 months - early holders are rotating out
✅ Clear distribution pattern forming
✅ Risk/Reward heavily favors shorts here
THE NUCLEAR WARNING: Almost $500M worth of tokens unlocking in the next 28 days.
This isn't FUD - this is math. That kind of supply hitting the market? You do the calculation.
Long-Term Perspective:
$20 zone could be THE generational entry for patient money. But right now? Let the distribution play out.
GETTEX:HYPE Distribution Phase Confirmed? 👇
NFA & DYOR

MicroStrategy Broken 55-SMA so Will Bitcoin follow the Same ?NASDAQ:MSTR Crashes Below 55-Week SMA
History shows: MicroStrategy weakness = early CRYPTOCAP:BTC top warning.
▶️ NASDAQ:MSTR bottom?: ~$115
▶️ CRYPTOCAP:BTC possible floor: ~$75K
Bitcoin is still ready for a new crash if it follows NASDAQ:MSTR below its 55-SMA.
BTCUSDT is at a critical point. Watch, learn, and act & Follow for high-value market updates.
NFa & DYOR

THE ENTIRE MARKET IS ABOUT TO HARD DUMPTHE ENTIRE MARKET IS ABOUT TO HARD DUMP
If #Bitcoin holds the $107K–$104K support: next stop $150K 🚀
But if it fails… prepare for a hard dump toward the $80K zone 😳
This is the make-or-break level.
NFA & DYOR
