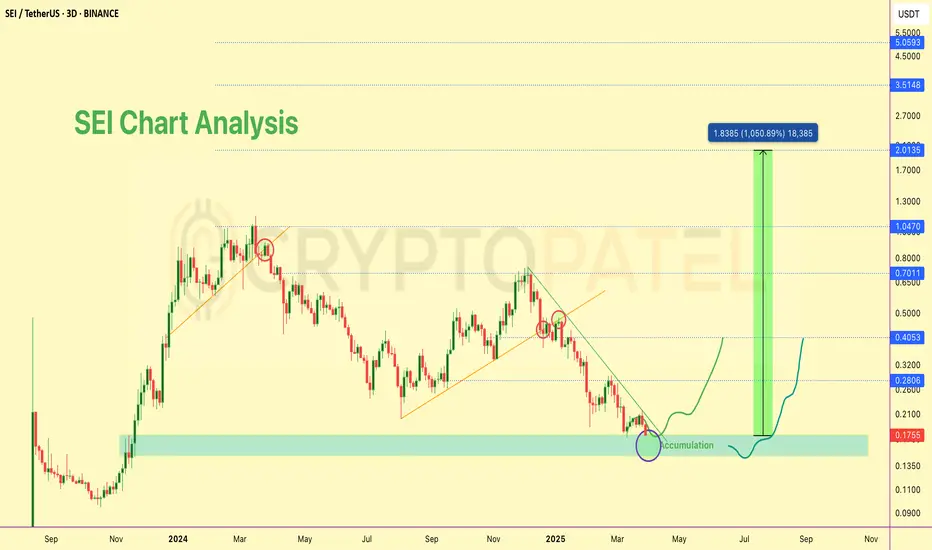
$SEI/USDT- Long-Term Technical Setup and $5 Potential in BullRun📊 $SEI/USDT – Long-Term Technical Setup
NYSE:SEI is holding strong at the $0.18 support zone, showing early signs of accumulation. This level has historically acted as a demand area, making it a key zone to watch.
🔹 Structure: Forming higher lows – bullish trend intact
🔹 Volume: Accumulation pressure building
🔹 Sentiment: Backed by large-scale buyers (e.g., Trump’s World Liberty)
📈 Long-Term Targets:
➡️ $0.45 → $1.00 → $2 / $3 / $5 (macro targets similar to CRYPTOCAP:SUI )
🛑 Invalidation: Close below $0.15
⚠️ Not financial advice. DYOR.
#SEI #CryptoTA #Altcoins #DYOR #TechnicalAnalysis
ETH
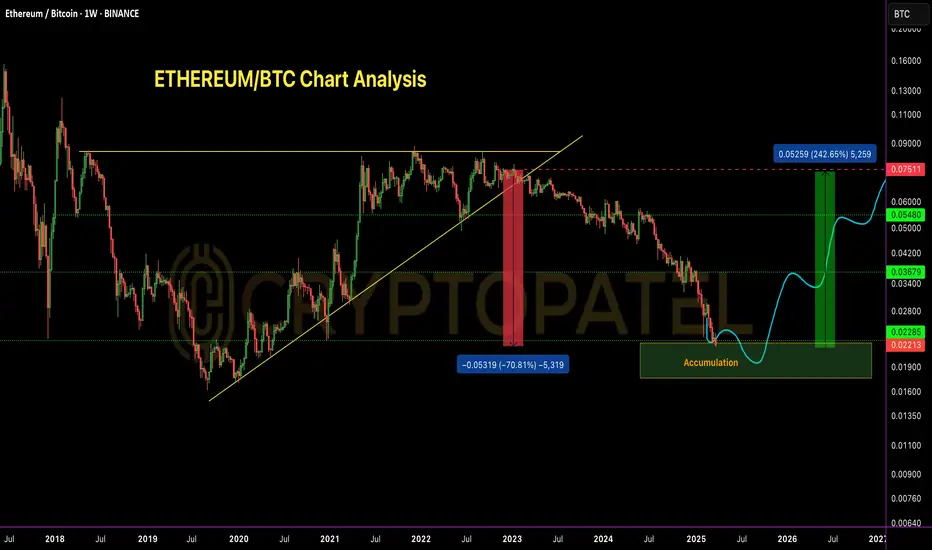
ETH/BTC – 70% Drop Achieved | Perfect Short ExecutionETH/BTC – 70% Drop Achieved | Perfect Short Execution
As projected in my analysis dated 10th Nov 2022, ETH/BTC has completed the anticipated 70% correction from the top.
Short Entry: 0.075 BTC ✅
TP1: 0.055 BTC – ✅
TP2: 0.037 BTC – ✅
TP3: 0.023 BTC – ✅
All targets achieved with precision.
Bearish structure played out as expected.
Current Outlook:
CRYPTOCAP:ETH Price has now entered a historical demand zone, coinciding with major multi-year support levels.
Accumulation Phase Activated –
Starting to scale into long positions from current levels, targeting mid-to-long term reversal setup.
Patience required – this could be the base of the next macro leg up.
Note: NFA & DYOR
#Ethereum
#Ethereum Is Down Now, But History Says a $10K Rally Is Coming…#Ethereum Is Down Now, But History Says a $10K Rally Is Coming…
1⃣ CRYPTOCAP:ETH rallied 228x post-2016 BTC halving
2⃣ ETH did 27x post-2020 halving
3⃣ Currently -57% from ATH post-2024 halving
📅 Projection: Q4 2025 ATH
🔼 Target Range: $7,000 - $10,000
Based on cyclical trend extension, Fibonacci macro structure, and historical BTC-ETH correlation.
What’s your ETH EOY 2025 target? RT & Comments if you Agree👇
#Altseason
Note: This is Not financial Advice so DYOR before Investing.

$ETH has dropped -40% since Eric Trump recommended buying it.JUST IN : CRYPTOCAP:ETH has dropped -40% since Eric Trump recommended buying it.
Just a gentle reminder to always DYOR (Do Your Own Research) before making investment decisions.
#Ethereum

Will Ethereum Drop below $1000 or Hit $10,000 in This Bull Run?One Golden Rule in Trading: Always buy the dip on fundamentally strong projects with 5x–10x potential in the near future.
Patience + conviction = profits.
#Ethereum CRYPTOCAP:ETH

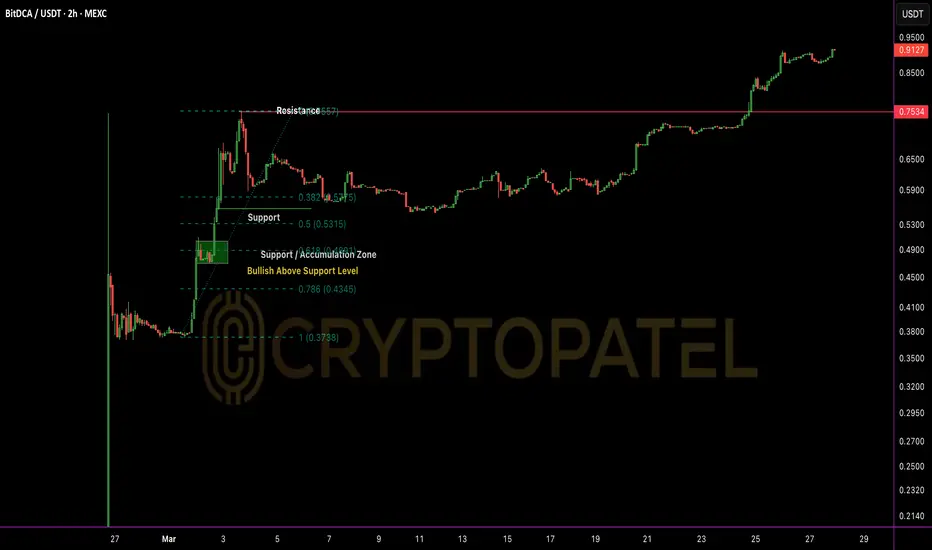
BDCA/USDT 9x up from Listing and 2x form Dip EntryECONOMICS:BDCA Update 🔥
Price just printed a fresh ATH at $0.92, marking a 9x move from pre-listing entry ($0.10) and a 2x rally since our chart-based call at $0.45.
Strong momentum, bullish structure intact.
Expecting further continuation in the short-to-mid term 🚀
#BDCA #CryptoGems #TechnicalAnalysis #Altcoins
NFA & DYOR
Will ETH/USDT hit $10,000 in this bull run?CRYPTOCAP:ETH is consolidating within a clear accumulation range.
A macro breakout is likely post-April, supported by cyclical structure & on-chain metrics.
HTF target: $10,000 remains valid.
Accumulation precedes expansion. 📈

ETH - Target 2200 - BullishETH has fallen a lot and taking support and move is bullish in line with BTC move. At these great levels buying, accumulating and investing in ETH is safe and for traders once the fourth wave is complete price is easy to see 2200 for fifth wave. ETH is good buy now. I expect small correction in BTC to complete and rise again or above 88K . Even if BTC correction is bigger ETH may not fall much since it has fallen a lot so its better to long in ETH more than in BTC now.

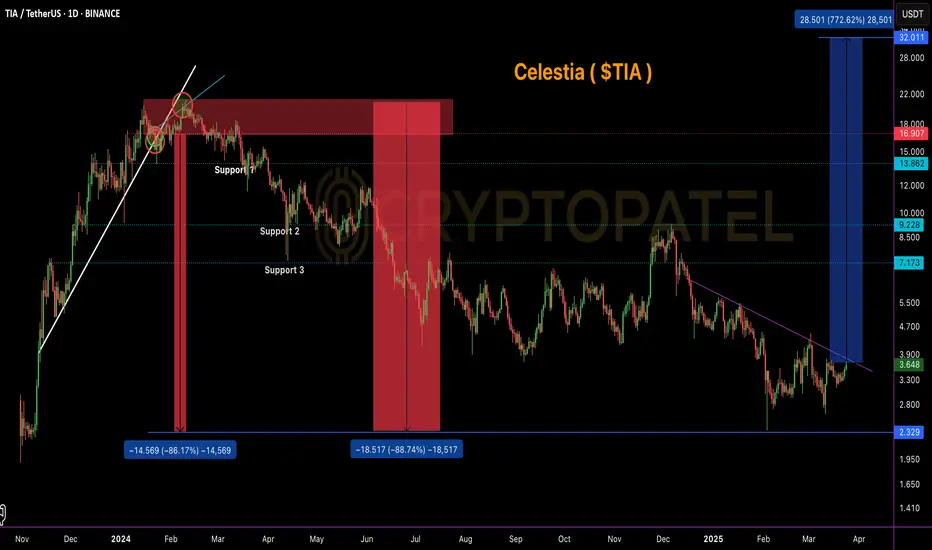
$TIA dropped ~86% from our short entry zone!LSE:TIA Massive Profit Update – Short Call Hit Perfectly 🔥
LSE:TIA dropped ~86% from our short entry zone!
We shared a short setup for LSE:TIA at the $17–$20 range. After a textbook retest rejection, price began its downward move and has now dumped all the way to $2.36, hitting a massive -86% from the top of our short zone. ✅
Current Technical Outlook (Accumulation Zone):
Based on chart structure and historical support levels, we are now entering a potential accumulation range between $3.60 – $2.50.
Long-Term Outlook:
If this zone holds, we could see a strong recovery in the coming months with possible upside targets in the $20–$40 range in the long run.
🚨 Note: This is not financial advice. Always DYOR (Do Your Own Research) before investing or trading.
Will PolkaDot Hit $50 in near Future?Where is the #POLKADOT Army?
CRYPTOCAP:DOT is in a key accumulation zone between $4.50–$3.50, a historic demand area before major moves.
➡️ Many lost patience, but smart money builds positions here.
➡️ If market cycles repeat, a return to $50 isn’t out of reach.

Ethereum Accumulation Alert! 🚀 Ethereum Accumulation Alert! 🔥
Ethereum is entering a potential spring accumulation zone, presenting a solid long-term opportunity.
📉 Buy Zone: $1,900 – $1,550
🎯 Targets: $5,000 / $7,500 / $10,000
🔹 Key Support: $1,550 – Holding above this level keeps the bullish structure intact.
🔹 Breakdown Risk: If ETH loses $1,550, expect further downside toward sub-$1,000, where the next strong entry lies.
📊 Smart money is accumulating—don’t miss the dip!
#Ethereum #CryptoTrading #Accumulation #ETH #NFA #DYOR

Why Buy Bitcoin? ( Detail Post about $1M Target )Why Buy Bitcoin?
It’s hard to ignore Larry Fink and BlackRock.
At Davos, Fink said: "Bitcoin could hit $500K to $700K."
Meanwhile, top experts are making bold predictions:
🔹 Tim Draper: $250K by end of 2025
🔹 Michael Saylor: BTC = World's largest asset in 48 months
🔹 Peter Brandt: $120K – $200K by Sept 2025
🔹 Chamath: $500K by Oct 2025, $1M by 2040
🔹 Max Keiser: $200K by end of 2024
🔹 Bernstein: $200K by 2025
🔹 Fidelity: SEED_TVCODER77_ETHBTCDATA:1B per BTC by 2038-2040
🔹 Hal Finney: $10M per BTC long-term
Waiting for the headline: "Bitcoin ‘PLUNGES’ from $1,001,000 to $985,000." – CZ Binance
Are you paying attention yet? 🚀
NFA & DYOR

SEI/USDT 20x Potential from Accumulation ZoneNYSE:SEI Accumulation Zone – High Potential Trade
🔹 -76% from recent high, making it a prime accumulation zone.
🔹 My Accumulation Zone: $0.20 – $0.15
🔹 Upside Potential: Chart indicates an easy move to $0.50—if it breaks, expect a major rally!
🔹 Long-Term Targets: $1/$3/$5/$10
🔹 Catalyst Alert: Even #TRUMP is accumulating #SEI adding strong bullish momentum!
Strategy: Accumulate on dips, take profits strategically, and hold a portion for long-term gains.
#Altcoins #NFA

#Ethereum Wyckoff Re-Accumulation#Ethereum Wyckoff Re-Accumulation
If this level holds, it could be the ideal accumulation zone for long-term investments.
CRYPTOCAP:ETH

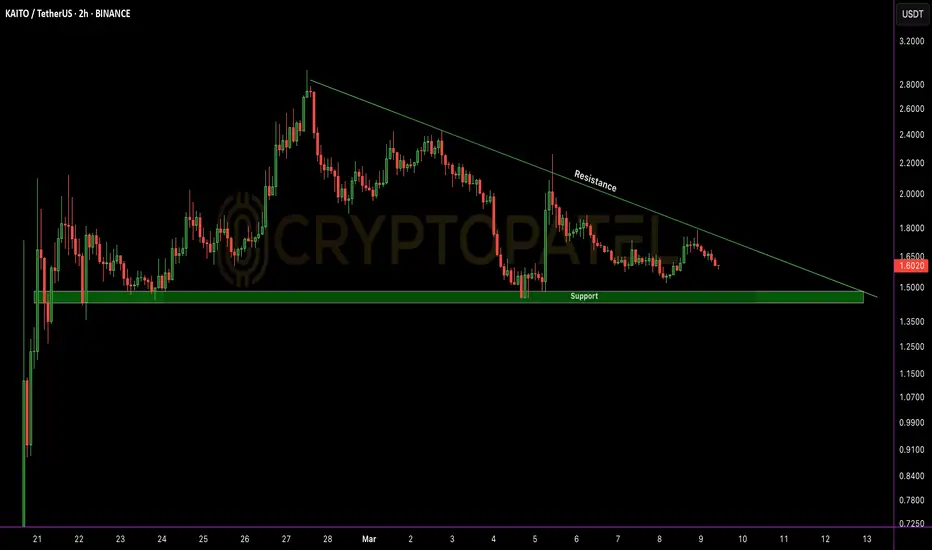
Will $KAITO go down -50% downside move?$KAITO Price Action Update
$KAITO is currently trading at $1.58, holding strong above the key $1.45 support level.
🔹 Key Levels to Watch:
✅ Support: $1.45 – Holding above this level could trigger a strong upside rally, targeting the $1.75 resistance and beyond.
❌ Break Below Support: If $1.45 fails, a 30-50% downside move is possible.
🚀 A decisive move above $1.75 could open doors for further gains. Keep a close watch on these levels for potential opportunities.
🔍 Stay informed, manage risk, and trade wisely.
📢 DYOR – This is not financial advice!
#KAITO #CryptoTrading #MarketUpdate #TechnicalAnalysis
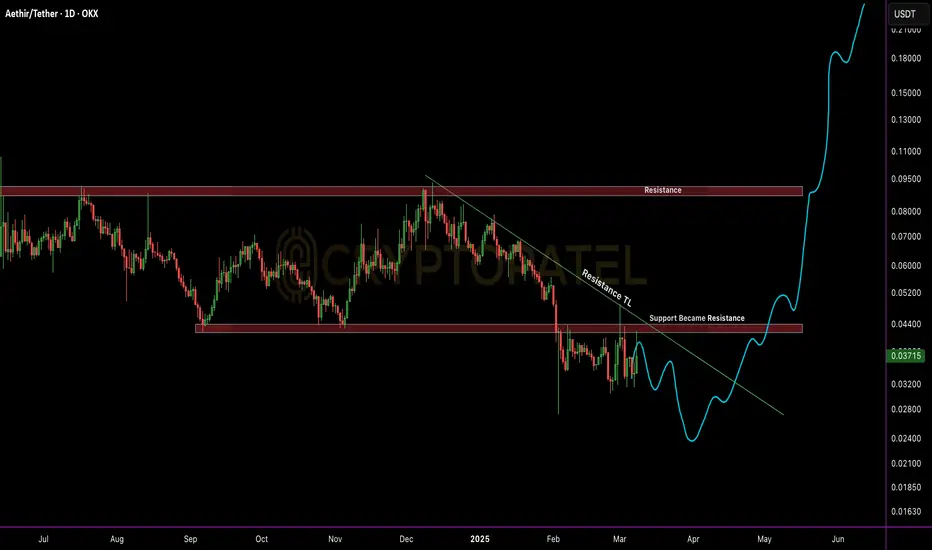
$ATH Technical Outlook: Accumulation Opportunity? TSX:ATH Technical Outlook: Accumulation Opportunity? 🚀
#ATH is trading at $0.037, below key resistance at $0.045 – bearish unless it breaks above. A breakout could push it to $0.09 and beyond.
🔹 Accumulation Zone: $0.037 – $0.020
🔹 Targets: $0.1 / $0.3 / $0.5 / $1
Solid project, good dip-buying opportunity. Watch key levels & manage risk!
Not Financial Advice – DYOR! 🚀
#aethir #Alts
Will Ethereum Fall below $1500 or Ready to $8000 ?#Ethereum Fresh Weekly Analysis
🔹 Current Trend: CRYPTOCAP:ETH has dropped -51% in the last 3 months, signaling a major retracement.
🔹 Key Support Zone: Trading above $2000-$1900, a crucial accumulation zone for this bull market.
🔹 Upside Targets: If #ETH holds this support, we could see $6000 / $8000 / $10,000 in the coming months.
🔹 Risk Factor: If ETH fails to hold $2000, expect a potential dip towards $1500—a key level for long-term accumulation.
Smart Strategy:
✅ Accumulate ETH on dips instead of chasing tops.
✅ Wealth is built by buying in bear markets and selling in bull cycles.
✅ Long-term holders should focus on accumulation, not panic selling.
IMO ETH/USDT has strong potential in this bull cycle—buy smart, hold strong!
Note: Not Financial Advice so DYOR

Bitcoin Fresh Technical Analysis and Price Prediction AnalysisBTC/USDT – Technical Analysis Update
📊 Current Price: ~$93,000
📈 Recent Move: Strong bounce from $79,000, surging $17,000 in just a few hours.
Key Technical Levels & Market Structure
🔸 Resistance Zone: $95,000 – This level acts as a critical supply zone. A strong rejection here may trigger short-term corrections.
🔸 Breakout Confirmation (BOS - Break of Structure): A decisive close above $99,600 with volume could confirm bullish continuation towards new highs.
🔸 Support & Downside Risk:
If BTC fails to hold above $95,000, a pullback towards $75,000-$70,000 remains a possibility.
EMAs & Trendline Support: Watch for dynamic support from 50 EMA & ascending trendline in case of retracement.
Market Outlook:
- BTC remains in a bullish structure, but volatility is high.
- RSI & Volume Analysis: Overbought conditions on lower timeframes suggest possible consolidation before the next leg up.
⚠️ Risk Management: Always trade with stop-loss and avoid overleveraging in this volatile market.
📡 Stay tuned for real-time insights!
Note: NFA & DYOR

DOGE/USDT – Prime Accumulation Zone & Bullish OutlookDOGE/USDT – Prime Accumulation Zone & Bullish Outlook 🚀
Current Status : Trading at $0.15-$0.20 support zone, a strong accumulation area. DOGE is currently 64% down from its ATH, presenting an attractive risk-reward setup.
Key Levels:
Support: $0.15 - $0.20 (Accumulation Zone)
Targets: $0.60 / $1.50 / $2 / $2.50
Why Bullish?
Technical Perspective: DOGE is holding key support and could see a breakout on volume expansion.
Catalyst: Elon Musk’s continued backing makes it a strong contender for long-term gains.
Strategy: Any major dip is a buying opportunity for long-term holders. Keep an eye on volume surges and market sentiment!
Note: NFA & DYOR

Bitcoin Ready for $69000 ?#Bitcoin followed my chart PERFECTLY! 🚀🎯
I warned you, but some laughed. Who’s laughing now? 😏
From $108K to $79K—NEXT STOP: $75K-$70K (prime accumulation zone!) 🔥
Who’s buying this dip? 🤔👇

ETH/BTC Crashed 70%! Target Achieved! Now Real Bull Market ?ETH/BTC Crashed 70%! Target Achieved! Now It's Time for the REAL Bull Market
◾️ Our Short Entry: 0.075 BTC ✅
◾️ Current Price: 0.02337 BTC ✅
◾️ Total Drop: -70%
◾️ Target Achieved! Now, we are ready for the actual Bull Market!
💰 Accumulation Phase Begins! Time to start positioning for the next big move.
#Crypto #Ethereum #Bitcoin

$ENA Chart Analysis: Key Insights for Traders🚀 XETR:ENA Chart Analysis: Key Insights for Traders
Recent Performance:
🔸 #Ethena has delivered 5x returns in the last 100 days, rewarding early investors significantly.
🔸 Notably, Trump has recently accumulated #ENA , adding momentum.
Current Levels:
🔸 If $1.46 breaks, expect a potential rally toward $2-$3.
🔸 The red resistance box has flipped into strong support. Holding above $1 signals a continued bullish trend.
⚠️ Caution:
🔸 Entry at current levels is high risk due to the sharp uptrend.
🔸 Wait for a dip: Ideal re-entry around $0.80-$0.70 if the red trendline breaks down.
Strategy:
🔸 Book partial profits if you entered at the dip.
🔸 Stay alert for price action at key levels to capitalize on opportunities.
Pro Tip: Watch $1 support and $1.46 resistance closely for next moves.

XYO/USDT Bullish Chart AnalysisXYO/USDT Bullish Chart Analysis
$XYO is looking strong, with a 108% gain last week, supported by good volume.
Reminder: Don’t buy in FOMO! Always wait for a better entry.
▪️ Suggested Entry Zone: Between $0.0075 and $0.006
▪️ Target Levels: $0.022/$0.039/$0.063/ATH
▪️ Stop Loss: $0.005 (This setup comes with high risk and high reward.)
What to Watch:
A triangle breakout on the higher timeframes could lead to a big move upward. 🚀
Be patient and trade smart.
