ETH/USDT Dumped hard as I predicted and next Target?ETH SHORT HIT — As Predicted!
Hey fam
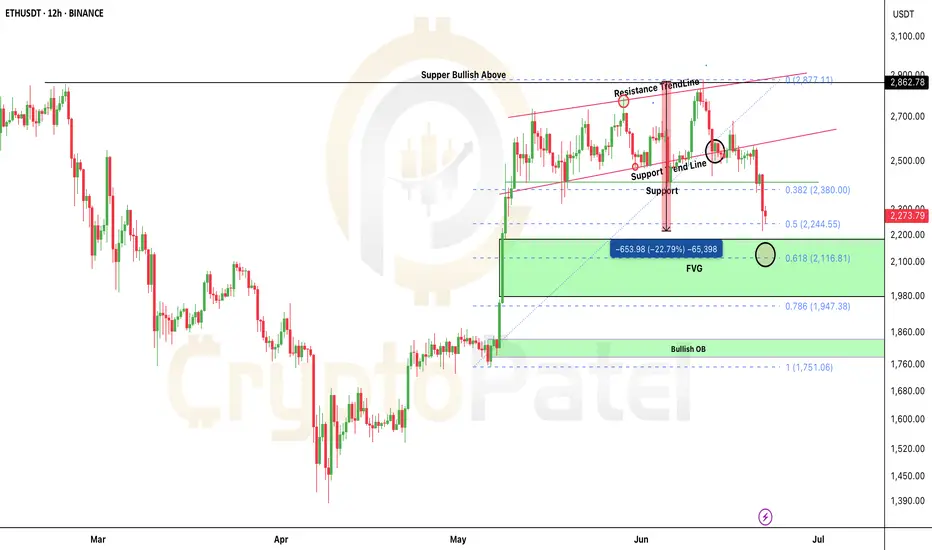
Hope you enjoyed the ETH short setup I shared earlier when price was around $2700–$2800
ETH is now down 22% from that level.
Broke support just like we discussed…
And remember I said — if $2500 breaks, we could see $2200.
Well… we’re already there now ✅
What Now?
This is where we start accumulating on spot.
Why?
Because ETH is currently at the 0.5 Fib level — could hold.
If not, we target 0.618 Fib for next entry.
Best Accumulation Zone: $2200–$1800
Strong bullish OB around $1782–$1840
If price drops there, expect a solid bounce!
I’m personally watching this zone for spot entries targeting $8000–$10,000 next run 🚀
Let me know below if you're buying this dip!
And as always… stay tuned for the next sniper setup.
NFA & DYOR
Ethereum-bitcoin
Ethereum: The Sleeping Giant!It is pretty evident that Ethereum is forming a falling wedge pattern, which mostly breaks to the upside. We are in for a treat!
The breakout could be anytime soon, with TRUMP already taking office and signing crypto orders from DAY 1 !
The Time Is Now. if you are not holding ETH. it's about time!

Ethereum taken intraday support chances are high for reversalHello everyone let's do some analysis on crypto,,
Ethereum is trading in a very tight range of 3760-3550, and it has taken perfect support in lower support zone in neutral rising bullish channel. Chances are higher for reversal from here,, This is gonna to give good intraday move. Please follow strict stop loss in it,,
Disclaimer:- Please always do your own analysis or consult with your financial advisor before taking any kind of trades.
Dear traders, If you like my work then do not forget to hit like and follow me, and guy's let me know what do you think about this idea in comment box, i would be love to reply all of you guy's.

Ethereum Ready to $6000 ?CRYPTOCAP:ETH Chart Update
Next Target: $5500-$6000
Best Accumulation Zone: $2500-$2100
Long Term Target: $8000-$10,000
#Ethereum bounced strongly from the $2100 level (channel support), and with the next resistance at $5500-$6000, I’m expecting the next stop for #ETH to be $6000

Profitable over 200% ahead | Long BiasOn week chart
AVAX has broken and closed above #DescendingTrendLine and now it's in correction phase. I think this is a first leg of the correction and wait for the second leg around $29
Wait for next move

Supply Zone acts Take Profit Zone | Long BiasOn Week Chart
ETH is keeping go up to $3,550 this price is Supply Zone and ETH can be reversed
Long Position on lower timeframes
Time will tell

SHIB/USDT 800% Potential in Bull Run ( Bullish Analysis )SHIB/USDT Long-Term Chart Analysis
Current Price: $0.00000940
After a -94% correction from the All-time High, SHIB is up 70% from the recent bear market bottom. Chart analysis suggests a potential breakout in the High Time Frame (HTF).
Breakout Level: $0.00001050
Long Term Targets: $0.000017 / $0.000027 / $0.000038 / $0.000067
Secondary Entry ( if Market Crash): $0.00000750
Potential Breakout Ahead:
SHIB is on the verge of a breakout in the HTF.
Waiting for confirmation for a good entry.
Long-Term Strategy:
Accumulate during dips for significant returns.
Targets are considered as resistances in the long term.
Future Expectations:
Anticipate substantial returns, especially during the MEMES trend.
Long-term targets set for potential future growth.
Follow me Friends.

Head and shoulders ETH/USDTProvided Eth is bearish .This is technical analysis of eth in 1 minute chart showing we can short eth upto it reached the down neck.

Ethereum 1d Update.Ethereum still looks great to short with less leverage. IMO it's easy for Ethereum to crack down more if we see a daily candle closing under 1005$ we can test lower levels easily.
Accumulation Zones:
(500-600$) 1st Accumulation Zone.
(800-920$) 2nd Accumulation Zone.

Ethereum Update and next important Levels to watch out.Ethereum successfully broke out and printed some nice gains, now the zones from which it might get rejected are mentioned let's wait for that and ride the move.


ETH CHART ETH/USDT
We have to see the market on long time frame.
Buying zone of #ETH $ 850 ~ $ 950 .
If we can catch there, next few months will be comfortable .
Follow @space-z .

Bitcoin trading in a triangle.Bitcoin trading in a descending triangle formation after fall.
It has been consolidating in a range after failing to hold its 20 ema on weekly chart.
Bitcoin has recently tested its weekly 200 ema has is consolidating just above it.
There is a resistance and a support which has been tested many times and once broken can give nice targets.
Support :- 27100, 28650, 28500
Resistance :- 30500, 31800
The coin is silent for half a month.
Watch for the price action near the triangle breakout.
#bitcoin #btcusd

Play ETHEREUM with moving averages.Ethereum is trading at a crucial support zone and there can be a reversal.
Though, on a 60 minute time frame, the moving averages crossover is showing some bearish trend.
On a 15 minute time frame, the coin taking support for the zone and strong bullish candle are being formed.
Support :- 2945,2850
Resistance :- 3020, 3100
Watch for the candle to close above is 20 ema on 60 minute time frame, as it has been taking resistance from the static level.
It can travel upto 200 ema once it gives a strong close above 20 ema.
Price action and volume analysis must be used.


ETH May reach 4600$ again As you can see a falling wedge pattern which confirms that the ETH is gonna rise
I have given the possible target and The support and resistance range, SO that we can buy the ETH in DIP. After a little more fall.
Views are purely educational in nature. You are solely responsible for any decisions you take on basis of my research.


Ethereum Analysis |9 Oct 2021 |Target Hit | AyushAryaTommorow i've shared analysis and trade for ETH (Ethereum) and it worked awesome clearly mentioned the rejection of 3625 and target on point i hope you've benefited from this

Ethereum Analysis |9 Oct 2021 | AyushAryaETH got good trendline breakdown and at retest level now chances to go down ETH can see some rejection from 3625 it will be good entry for short position stops above 3700 and the targets we can make of around 3500 , GOOD 1:8 Risk Reward Ratio

ETHEREUM TAKING SUPPORT ON THESE LEVELS BOUNCE BACK IS POSSIBLE Ethereum is taking a good support and forming a spinning top kind of candle on daily charts reversal is quite possible

SHORT ETH !!! In the current downtrend market, shorting is a good decision to take. with the confirmation of bearish flag pattern and fib levels, this is my short trade setup .
- always use do money management .
- For long term investors this is a great opportunity for buying as the prices are low.
