ETHUSD SHOWING A GOOD UP MOVE WITH 1:8 RISK REWARD ETHUSD SHOWING A GOOD
UP MOVE WITH 1:8 RISK REWARD
DUE TO THESE REASON
A. its following a rectangle pattern that stocked the market
which preventing the market to move any one direction now it trying to break the strong resistant lable
B. after the break of this rectangle it will boost the market potential for break
C. also its resisting from a strong neckline the neckline also got weeker ald the price is ready to break in the outer region
all of these reason are indicating the same thing its ready for breakout BREAKOUT trading are follws good risk reward
please dont use more than one percentage of your capitalfollow risk reward and tradeing rules
that will help you to to become a bettertrader
thank you
Ethereum (Cryptocurrency)

ETHEREUM | VISUAL ART with PipGuardETHEREUM | VISUAL ART with PipGuard
Article published by PipGuard™ on the TradingView® platform – to continue this free publication, LEAVE A BOOST and a COMMENT, hit the notification bell, and never miss ANOTHER ANALYSIS.
ANALYSIS
Hello colleague, how are you?
Today I bring you a different kind of analysis, designed to be understood on a purely visual level. Because when we're in front of the chart, in the arena, in the cage... there's no room for bullshit or distractions. Here, we fight, and whoever comes in with a confused mind always ends up crushed.
Trading is a ruthless game, like a game of chess. And the winner isn't the one who knows a thousand abstract theories, but the one who has clear ideas, simple concepts, and concrete results.
Think about it: there are few pieces on the chessboard, but the possible moves reach 10^120. That means there are more combinations in a game of chess than stars in our galaxy. An insane number. Yet, the winner isn't the one who gets lost in complexities, but the one who knows how to move those few pieces well with cunning, craftiness, and awareness.
Trading is nothing but this: a continuous battle between you and the market. It moves its pawns, it provokes you, it deceives you, it tries to screw you over. And you? You must observe, wait for its move, analyze it, imagine its counter-move, and only then react.
The tools are few and clear: liquidity, support, resistance, trend.
You don't need an infinite arsenal: you need the basics, the ability to interpret, and the coolness to respond.
I dedicate most of my time to the charts, studying the market, building indicators that actually work instead of complicating life. Over the years, I've understood that behind every strategy, every concept, every approach, there's always a common denominator: simplicity .
So remember this well, colleague: you hold the power in your hands, the power to decide. The market has made its move... what about you? How will you respond?
NEWS
✅ Ethereum is shining again as “digital oil” with a +200% rise in five months, driven by massive institutional investments via ETFs, making Bitcoin pale in comparison!
✅ ETFs and whales are pumping Ethereum: bullish flows and strategic accumulations are putting directional pressure on the price; it looks like it's set for the next push.
SECRETS
🔓 Ethereum is transforming into ultra-sound money: thanks to EIP-1559 and the Merge, it now burns more ETH than it issues daily, with emissions crushed to 1,600 ETH/day, compared to the 13,000 under PoW.
🔓 A core dev's wallet was cleaned out by a malicious AI extension: a sophisticated attack that rips ETH directly from the platform's tech heart.
GREETINGS
Remember to leave a GREETING 🚀 or a COMMENT not because I need the likes, but because every boost does more for morale than a double espresso with cream.
Talk to you soon,
PipGuard
Article published by PipGuard™ on the TradingView® platform

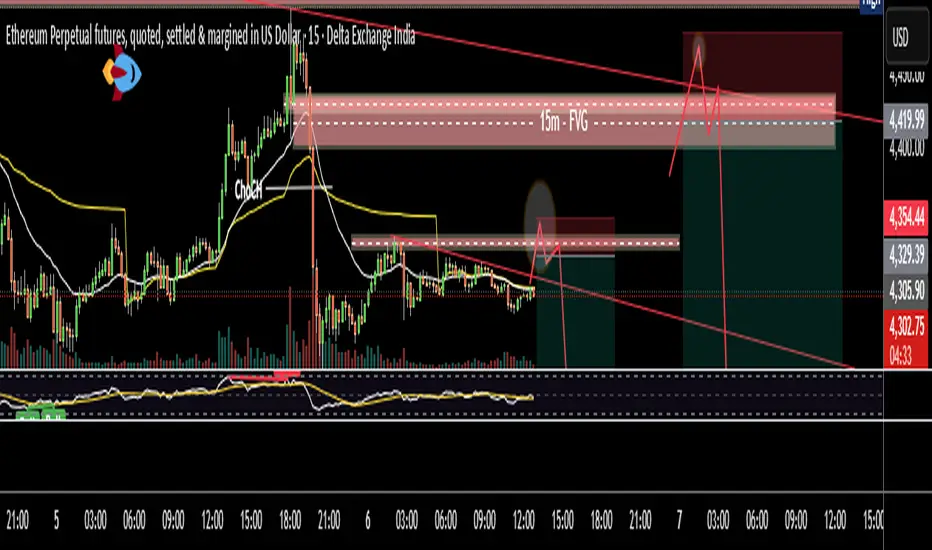
ETH multiple Sell OpportunitiesETH is moving in range for almost a week time. Now it has shown a displacement after ChoCH and formed a bearish 15m FVG. There may be a good trade at sell side if price approach it. Well there are two trade scenarios are forming.
Trade # 1
1. Price is moving around a short term trend line and resistance.
2. If price breaks trend line and take the liquidity of resistance than it may be sell trade.
Trade # 2
3. Price moves to 15m FVG and OTE overlap zone.
4. Most probably price will take liquidity of FVG zone and break trend line.
5. After breaking trend line it should pullback till FVG/trend line or any newly created OB/FVG.
All these combinations are signaling a high probability and high Risk and Reward (1:8) trade scenario.
Note – if you liked this analysis, please boost the idea so that other can also get benefit of it. Also follow me for notification for incoming ideas.
Also Feel free to comment if you have any input to share.
Disclaimer – This analysis is just for education purpose not any trading suggestion. Please take the trade at your own risk and with the discussion with your financial advisor.
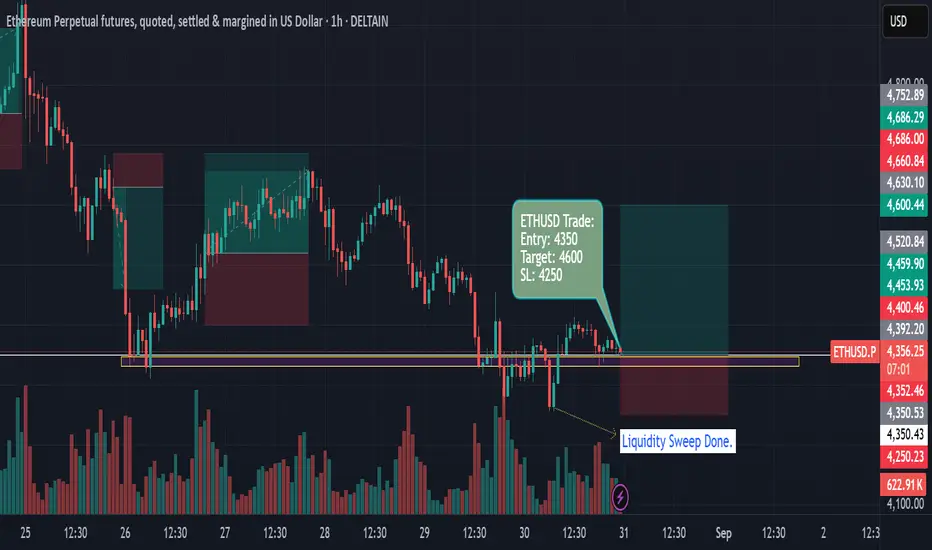
ETHUSD 1H — Liquidity Sweep Reversal with Precision EntryTrade Summary
• Entry: $4,350
• Target: $4,600
• Stop Loss: $4,250
• Risk/Reward Ratio: 2.5:1
After a significant liquidity sweep just below $4,350, Ethereum Perpetual Futures have reclaimed support and established a potential reversal base. The trade enters at $4,350, with a tight stop loss at $4,250, banking on the exhaustion of sellers and fresh momentum above reclaimed support. The target is $4,600, right before a major resistance cluster and previous swing high, offering clarity on profit-taking and risk parameters.
Recent price action signals a shift from bearish momentum to consolidation, as aggressive buyers absorbed supply during the liquidity sweep — a signature move that often precedes sustained rallies. The setup features:
• Clear horizontal support with visible volume confirmation
• Precise entry post-sweep for maximum risk efficiency
• Stop loss positioned below the sweep zone for strict invalidation
• Well-defined target near a high liquidity supply area
Why I like it: Excellent risk management, technical clusters, and early signs of trend reversal. Would love feedback from the community on additional confluence factors or alternate views!
ETH/USD Bullish Breakout & FVG Buying Zone StrategyETH/USD Chart Analysis (30m TF)
🔹 Trend & Structure
Price was moving inside a descending channel (support & rejection lines).
Recently broke above the channel, showing bullish momentum.
🔹 Key Levels & Zones
FVG Buying Zone: $4,283 – $4,353 (potential entry zone).
EMA70 ($4,393) acting as immediate support/resistance.
EMA200 ($4,468) is the next strong resistance.
Target Point: $4,667 (upside target after breakout).
🔹 Strategy
📈 Look for buy entries inside the FVG zone ($4,283 – $4,353).
🎯 Target: $4,667
🛑 Stop-loss: Below $4,283 to protect capital.
⚡ Setup suggests a bullish continuation if the buying zone holds.

ETH short trade plan on 15 minEth is down, Fell good during NY session, a small bounce inviting Cheap buyers to get in and get a higher fill for shorts.
when 50 ema is trending all bounces towards the 50 ema + failure should be considered shorts
For long: let it cross + dip + continuation then buy

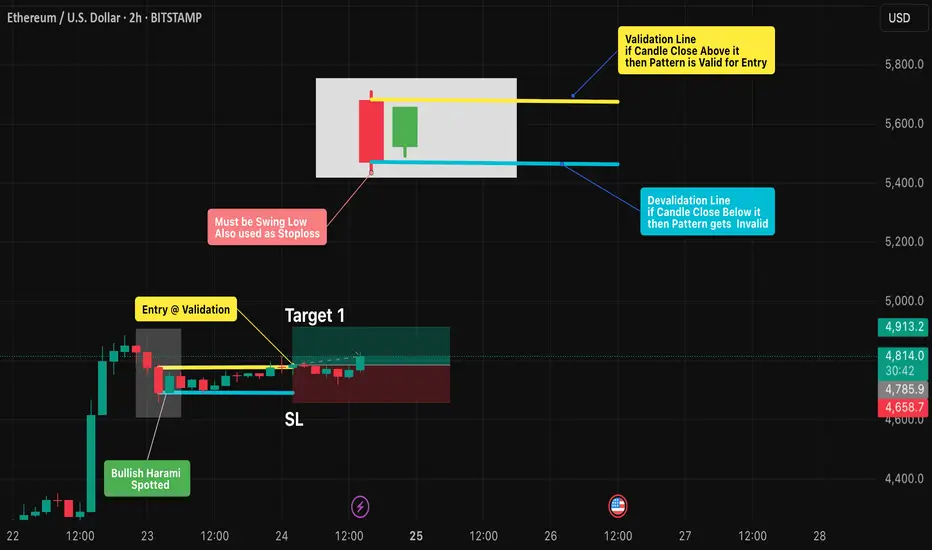
Bullish Harami Pattern: Spotting Reversals with DisciplineIntro / Overview
The Bullish Harami is a candlestick reversal pattern that often forms at the end of a downtrend.
It signals a possible shift where sellers weaken and buyers begin to step in.
The first candle’s low must be a swing low , and this level can also be used as a stop-loss reference.
To trade it effectively, spotting the formation is not enough — strict validation and invalidation rules are key to avoid false signals.
✨ Concept
A Bullish Harami is a two-candle pattern:
- First candle (Red🔴): A strong bearish candle showing seller dominance (swing low).
- Second candle (Green🟢): A smaller bullish candle whose body is fully inside the prior red candle’s body (wicks ideally inside).
This forms the “harami” structure, where the green candle looks like it is “inside the red candle,” suggesting a pause in bearish pressure and potential reversal.
📖 How to Use
1️⃣ Identify the pattern: Look for a large red candle followed by a smaller green candle contained within it.
2️⃣ Validation Point: The setup is validated if price closes above the open of the red candle within the next few candles.
3️⃣ Invalidation Point: The setup is invalidated if price closes below the close of the red candle before validation occurs.
4️⃣ Stop-Loss & Targets:
- Stop-loss (SL): Place at or just below the swing low (first red candle low).
- Target (TP): 1x, 2x, or more times the distance between entry and stop-loss.
5️⃣ Enhance Reliability: Combine with support levels, trendlines, moving averages, or other candlestick signals to filter out weak setups.
📊 Chart Explanation – Step by Step
✔ The Bullish Harami pattern was spotted after a clear downtrend.
✔ The following candle closed above the red candle’s open → Validation confirmed ✅ .
✔ A long entry was taken on the same candle.
✔ The Bullish Harami pattern has also been drawn and highlighted on the chart.
🔍 Observation
- If Target 1 is achieved → book 2 lots , and trail the remaining position with a stop-loss.
- Harami is only a potential reversal → confirmation is necessary.
- Breakout above the red candle’s open = buyers in control 🟢.
- Breakdown below the red candle’s close = setup failure ❌.
- Patience is key — wait for confirmation before entering.
📌 Why It Matters?
The Bullish Harami helps traders by:
- Reducing false reversal trades with strict rules.
- Providing clear entry/exit levels with discipline.
- Enforcing risk management via pre-defined SL & TP.
✅ Conclusion
The Bullish Harami becomes powerful when traded with discipline.
By marking the open and close of the red candle, traders can clearly separate a valid long trade from a failed setup.
With a stop-loss at the swing low and take-profits at 1x, 2x, or more, while trailing further lots, the Harami offers a structured, rule-based strategy.
⚠️ Always remember: the pattern shows possibility → price confirmation makes it probability .
⚠️ Disclaimer
For educational purposes only · Not SEBI registered · Not a buy/sell recommendation · No investment advice — purely a learning resource
Eth s targets for sureEthereum 's targets for sure
Logarithmic history has certain basic growth factors , as per the logarithmic growth eth is just starting
Atleast 600% - 630% from the recent deep dip will be there

ETH on the road to $10,000? Let’s break it down🔥 ETH on the road to $10,000? Let’s break it down 👇
Here’s why ETH looks stronger than ever:
1️⃣ Big Money Flowing In
🔹 ETFs & public companies bought 4.4M ETH ($20B) this quarter.
🔹 Whales & Web3 firms added another 2M ETH.
🔹 That’s more than 5% of total supply absorbed in just months.
2️⃣ Record Network Growth
🔹 DEX trading volume at new highs.
🔹 Daily transactions & active wallets breaking records.
🔹 Stablecoin supply at ATH.
👉 Demand for Ethereum’s network is exploding.
3️⃣ Massive Supply Crunch
🔹 30% staked, 8% with institutions, 25% with long-term holders.
🔹 5% permanently lost.
🔹 Only 12% left on exchanges, shrinking fast.
🔹 Inflation rate just 0.5%, even lower than Bitcoin.
With retirement funds opening ETH access, rate cuts coming, and pro-crypto regulations, the demand will only increase while supply dries up.
Short-term dips may shake out weak hands… but the bigger picture is clear: ETH is heading above $10K this cycle.
Note: NFA & DYOR

$BTC at make-or-break zoneCRYPTOCAP:BTC at make-or-break zone
Holding above $116K = bullish reaction likely → next leg higher Toward New ATH
Losing this support = bearish breakdown → eyes shift to $100K liquidity pool.
Market structure is clear: support defends or capitulation begins.

ETHUSD Lowers High Formation After Recent Peak Eyes 4010📊 Key Observations:
Trend Shift: After peaking near 4,700, ETH rejected strongly with a caution signal at the top, marking a possible exhaustion zone.
Sell Signals: Multiple sell triggers emerged after the top, showing sellers defending resistance levels.
Liquidity Zone: Price is consolidating under the 4,434 – 4,480 area, which is acting as fresh resistance.
Moving Averages: Short-term averages have crossed downward, aligning with bearish momentum.
📉 Current Setup:
Entry region: Around 4,408 – 4,434 (resistance rejection area).
Target zone: 4,009 – 4,040 (highlighted objective area).
Stop level: Above 4,480 (recent supply zone).
🔎 Reasoning:
Lower highs are forming after the recent peak.
Strong sell presence above 4,400s.
Breakdown structure suggests continuation toward the 4,200 handle, with an extended target closer to 4,009.
Market caution markers confirm a potential trend reversal zone already formed earlier.
✅ETHUSD is in a bearish continuation phase unless bulls reclaim 4,480+. Watching the 4,200 and 4,009 levels as key downside objectives.
⚠️ Disclaimer:
This analysis is for educational purposes only and does not constitute financial advice. Always do your own research and manage risk before making trading decisions.

ETHUSD-Potential Reversal Eyes LongETHUSD declined into a previously tested support zone, triggering a new Buy signal from SignalPro.
Price is currently attempting to reclaim short-term structure but remains under EMA resistance.
The recent Sell signal failed to create a lower low, potentially signaling bearish exhaustion.
🔍 Educational Setup Observation:
Reclaim Zone: Near 3,790.00
Stop Reference: Below 3,744.71 (beneath structural low)
Target Zone: 4,223.47 — aligned with prior imbalance and resistance from previous high-volume node
If price can decisively reclaim above EMAs, momentum shift may accelerate.
⚠️ This analysis is for educational purposes only. It does not constitute financial advice. Always do your own analysis and apply proper risk management.

Breakout in ETHEREUMA Big Breakout has happened in Ethereum in weekly time frame.
The Coin shoul be holded for months to achieve its final target.
As price has reached all time high which is its first target.
Rest two targets are 7400 and 7700.
No SL should be placed as the coin should be acquired on holding basis.
Note: This analysis is for Educational Purpose Only. Please invest after consulting a professional financial advisor.

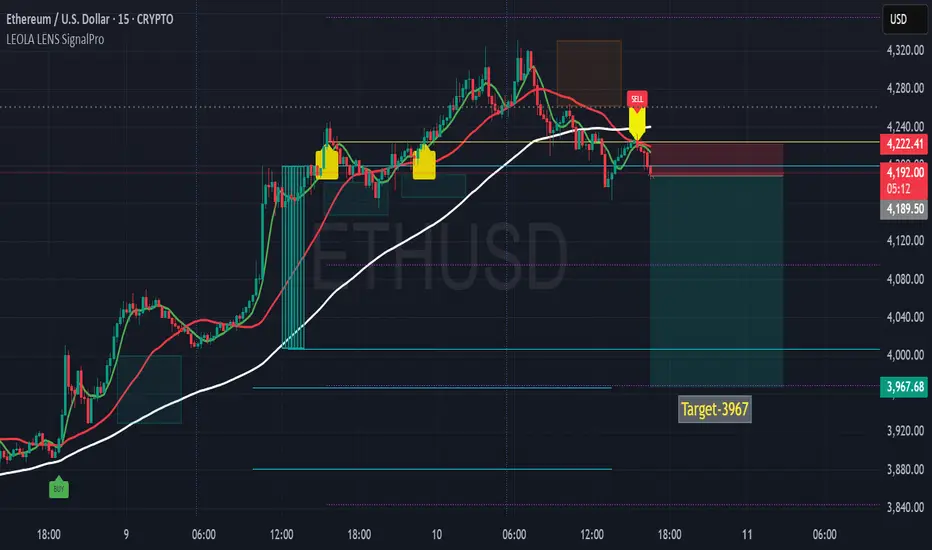
ETHUSD-15MIN SHORT Setup After Supply RejectionThis chart highlights a potential short trade opportunity on ETHUSD following rejection at the overhead supply zone.
Technical Notes:
Yellow caution markers signaled earlier high-probability trend shift points.
Price tested the zone near 4,240, where prior selling pressure emerged.
The recent SELL marker aligned with a break below the moving average, confirming bearish bias.
Liquidity levels below remain untested, offering a possible draw toward the 3,967 target.
Stop-loss placed above recent highs to maintain favorable risk-to-reward.
Bias: Bearish toward target area unless price reclaims and sustains above supply zone.
Disclaimer: This analysis is for educational purposes only and does not constitute financial advice. Trading and investing involve risk, and past performance is not indicative of future results. Always conduct your own research before making trading decisions.
#ETHEREUM – Macro Breakout Setup#ETHEREUM – Macro Breakout Setup 🚀
▶️ 6th time in history testing $4K macro resistance.
▶️ A clean weekly close above could ignite HTF expansion to $8K → $10K → $15K.
6 rejections in 4 years… one breakout can change it all.
NFA & DYOR

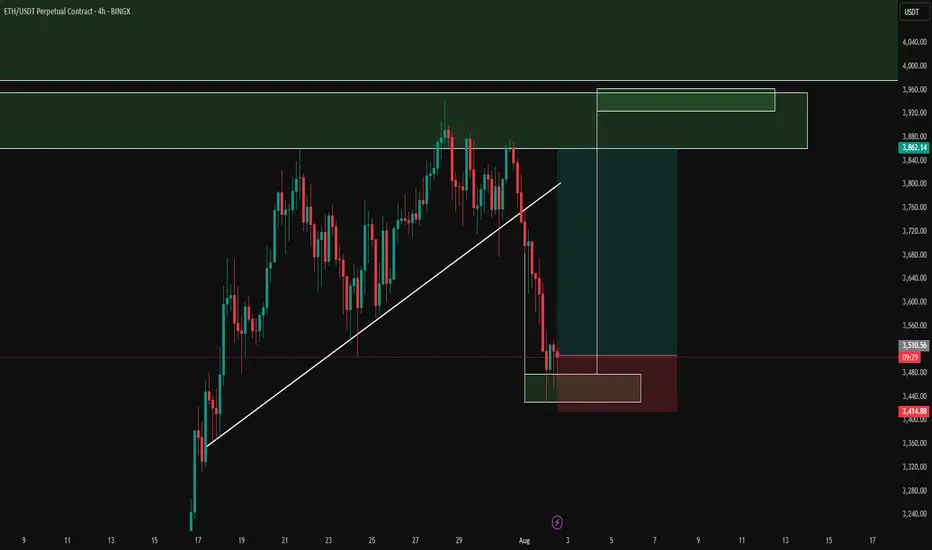
ETHUSD EYES FOR LONG - Intraday ViewThis 15-minute chart on ETHUSD highlights a potential structure-aware reversal zone, guided by Leola Lens SignalPro overlays and trend context.
🔍 Technical Structure Highlights:
🟡 Caution Labels Active — Market is transitioning with signs of indecision. High-probability trend change zones are being tested.
🔻 Price remains below both the adaptive red and white base trendlines, signaling bearish pressure is still dominant.
🟥 Recent SELL signal held well, driving price lower into the Liquidity Control Box, which has now acted as a local support area.
🟢 Multiple attempts to reclaim structure are visible — but the price is still trading under key compression zone near $3,513.
🔁 What to Watch:
A clean break and hold above $3,513 could indicate a potential squeeze toward the $3,600–$3,720 zone.
Rejection from current levels could retest the base support near $3,455 or lower if trend resumes.
🧠 This chart is a visual study of structure, momentum, and reaction using Leola Lens SignalPro tools. All views are for educational purposes only. Trade safe.
#ETHUSD #Crypto #Ethereum #LeolaLens #PriceAction #SmartContext

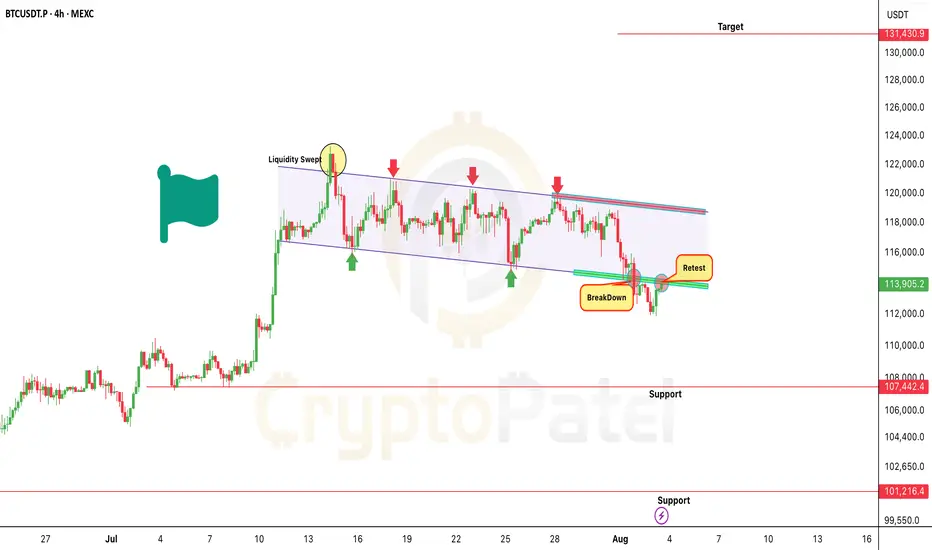
Bitcoin Breakdown or Bull Trap? $100K or $131KAs previously shared CRYPTOCAP:BTC had a potential to tap $114K when it was around $120K.
But now, $114K support has broken, and price is currently trading in the bearish retest zone post-breakdown.
Bearish Targets: $107,000/$101,000
Important Note:
Watch $115,700 zone closely- This could be a liquidity sweep trap.
If any HTF candle (4H/D) closes strongly above $115,700, it invalidates the bearish structure and may flip into a bull flag breakout.
Key Levels:
Bullish Flip Zone: $115,700 (Close Above HTF = Exit Shorts)
Trend Reversal Trigger: HTF close above $119,000 → Can open door to $131,000
Remember:
Trade with confirmation, not assumption.
Always respect key levels and adapt if market structure shifts.
NFA & DYOR
#ETH Bullish Idea And Possible MoveAll signs point to Ethereum’s crash risk being behind us for now. Get ready—once the volume picks up, ETH is set to pump hard!
I’m using a unique approach beyond just the usual TA and PA, so don’t overthink it. Just follow the trend and watch those candlesticks light up!
Disclaimer: This isn’t financial advice or a trade call—just sharing my excitement!
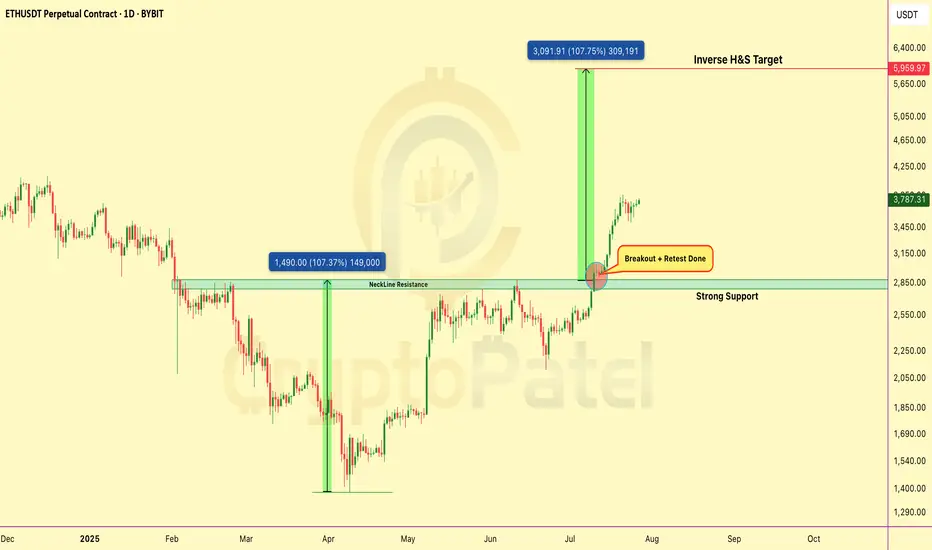
Ethereum Breakout Confirmed – Retest CompletedCRYPTOCAP:ETH has broken out Inverse Head & Shoulders on daily chart.
✅ Neckline breakout above $2,850
✅ Retest successful – strong support confirmed
✅ Targeting full move toward $6,000
Structure is bullish, momentum building. As long as #Ethereum holds above the neckline, continuation is likely.
Note: NFA & DYOR
DOGE MARKET CAP PENGING RALLY , NOW WANT TO BE CONTINUE Current Market Cap: $35–40 billion
Global Rank: #8 among all cryptocurrencies
Price per DOGE: $0.23–$0.27
Circulating Supply: ~150 billion DOGE
All-Time High Market Cap: ~$85 billion (May 2021, at ~$0.73 per DOGE)
Supply Type: Inflationary – ~5 billion DOGE added annually
Volatility Drivers: Strongly influenced by social media, especially Elon Musk’s activity
Investor Sentiment: Divided – strong community vs. concerns over hype and centralization

ETHUSD Rejection Near Supply-Breakdown path to 3481ETH/USD shows signs of weakness after rallying into a short-term supply zone. The structure suggests a possible trend reversal as price begins to reject near key resistance.
🔍 Setup Highlights:
🟥 Red zone represents a clear supply area, where buyers were absorbed.
🟧 Yellow bar cluster from SignalPro shows early consolidation before the pump.
🔵 Breakdown trigger initiated as price lost the momentum and structure failed near 3,700.
🎯 Target zone at 3481, aligning with a previous demand imbalance zone.
📘 Educational Takeaway:
This chart helps illustrate how:
Supply rejection zones act as trend reversal points.
Visual tools like Leola Lens SignalPro guide traders on structure + sentiment.
Mapping invalidation clearly improves discipline and planning.

BTCUSD-Eyes 120000 after Liquidity Sweep & Support RetestPrice action on the 15-min chart shows Bitcoin forming a potential bullish continuation after a liquidity sweep below short-term support. Here’s what stands out:
🔹 Triple Tap Support: Price respected a key zone multiple times, hinting at strong buyer interest.
🔹 Post-Sweep Reaction: Sharp recovery followed by consolidation suggests demand re-entered the market.
🔹 SignalPro Context: Leola Lens™ SignalPro highlighted key zones (yellow + orange), offering caution and trend context.
🔹 Projected Path: With price stabilizing above the reclaimed zone, potential upside target aligns with the 120000 region.
📌 Educational Note:
This setup highlights how liquidity collection below support and subsequent recovery can offer clues to short-term directional intent. Always manage risk based on volatility and session context.

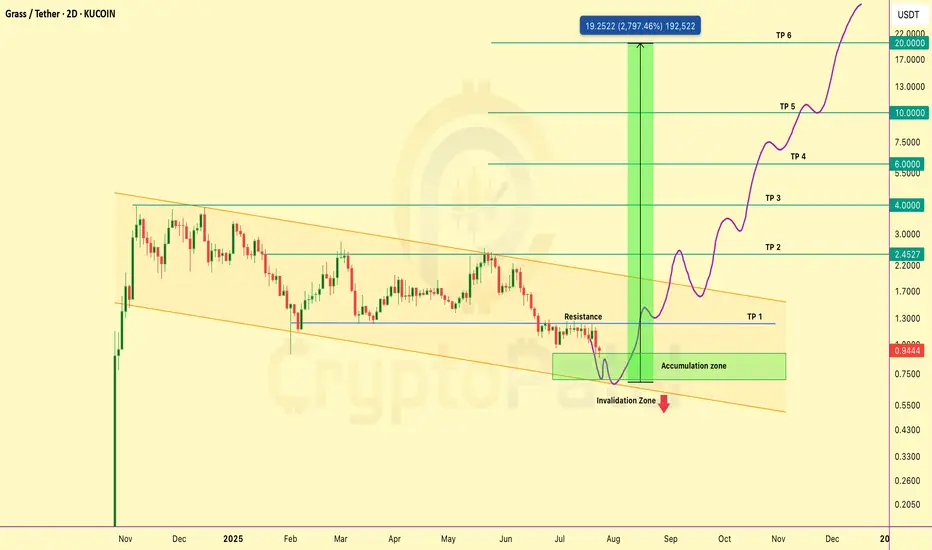
GRASS could grow 10x in this bull run: Don’t ignore this AIGRASS could grow 10x in this bull run: Don’t ignore this AI project
Price is consolidating inside a falling wedge and holding the key accumulation zone around $0.60–$0.85.
A breakout above trendline resistance could trigger a strong bullish move.
🔸 Structure: Falling wedge
🔸 Invalidation: Close below $0.55
Targets on breakout: $1.30 / $2.45 / $4 / $6 / $10 /$20
Fundamental Highlights
🔹 DePIN x AI powered by Solana
🔹 Share your unused internet and earn $GRASS
🔹 Backed by Polychain & Tribe Capital
🔹 Over 2M users across 190 countries
🔹 ZK-proof privacy, passive income, and scalable L2 infra
🔹 Only 29% supply unlocked, next major unlock in Oct 2025
This isn’t just another altcoin. GRASS is building the decentralized data layer for AI.
NFA & DYOR