Ethereum (ETH/USD) Technical Analysis — Bearish Rejection Below 🔍 Ethereum (ETH/USD) Technical Analysis — Bearish Rejection Below Resistance ⚠️
📅 Date: June 4, 2025
📊 Chart Type: 2-Hour Timeframe
💱 Exchange: Binance
---
🧠 Overview:
The chart displays a clear range-bound market between well-defined resistance and support zones. The most recent price action suggests a rejection from the resistance region, hinting at a possible downward move toward support.
---
🟧 Key Levels:
Resistance Zone: $2,720 – $2,760
Price has tested this zone multiple times and failed to break above decisively.
Marked as a strong supply area where sellers dominate.
Support Zone: $2,460 – $2,490
This area has historically attracted buying interest, causing price reversals.
---
📉 Market Structure & Price Action:
The recent swing high formed a lower high relative to the peak on May 29, suggesting bearish momentum.
A projected bearish move is marked on the chart with a blue arrow 📉, forecasting a drop from around $2,640 down to the support zone near $2,480.
Multiple failed attempts to break resistance signal a potential trend continuation to the downside within this trading range.
---
⚠️ Trading Implications:
Short-term bias: Bearish 🔻
Confirmation needed: A breakdown below $2,600 with volume would strengthen bearish conviction.
Target for bears: $2,480 support area
Invalidation zone for this outlook: A breakout and close above $2,760 would shift the bias to bullish.
---
📌 Conclusion:
Ethereum is currently trading within a well-defined horizontal channel. With the latest rejection near resistance, the probability favors a move down to the support area. Traders should monitor key levels closely for confirmation before entering positions.
📈 Tip: Use proper risk management and watch for candlestick confirmation at critical levels.
Ethereumusd

Ethereum (ETH/USD) Price Action Analysis (1-Hour Timeframe)📊 Ethereum (ETH/USD) Price Action Analysis (1-Hour Timeframe) 📈
🔍 Chart Context:
Timeframe: 1-hour (intraday outlook)
Asset: ETH/USD (Binance)
🟠 Key Levels & Observations:
✅ Support Zone:
Around $2,470 - $2,500 (highlighted with orange boxes).
Price consistently tests and respects this area multiple times, indicating strong demand.
✅ Resistance Levels:
First significant resistance: $2,710 - $2,720 (highlighted with blue lines).
Extended target: around $2,760.
✅ Recent Price Action:
Clear higher low formation at the support zone, suggesting potential reversal.
Previous swing highs are well marked (orange circles), hinting at potential resistance retests.
✅ Chart Patterns:
Double bottom / accumulation pattern forming at the highlighted support zone.
Strong bullish reaction expected on successful retest.
🎯 Trade Setup Idea:
Entry: Near $2,500 support zone.
Target: Initial take-profit zone around $2,720.
Extended Target: If momentum continues, $2,760 level.
Stop-Loss: Below $2,470, ideally near $2,450 for risk management.
📈 Technical Bias:
Bullish bias in the short term, driven by repeated support tests and signs of reversal.
Chart hints at breakout potential if price overcomes $2,720.
⚠️ Risk Management & Cautions:
Key risk: False breakouts below $2,470 could trigger bearish continuation.
Maintain a favorable risk-reward ratio (e.g., 1:2 or better).
Market volatility can increase rapidly; keep trade sizes appropriate.
🚀 Summary & Conclusion:
🔵 Bias: Bullish
🔵 Entry Zone: $2,470 - $2,500
🔵 Target Zones:
TP1: $2,720
TP2: $2,760
🔵 Stop-Loss: Below $2,450
🔵 Key Indicators: Structure break, price respecting support, bullish engulfing candle potential.

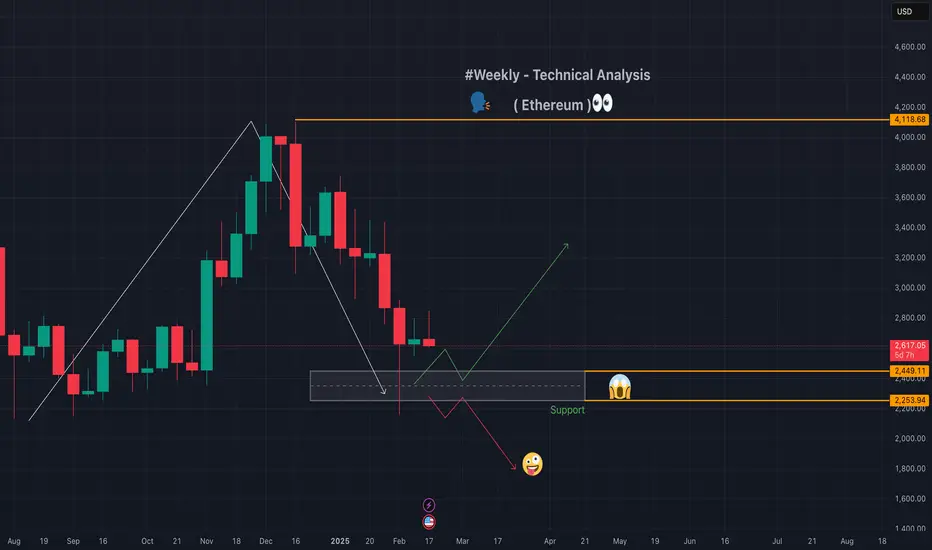
Ethereum - Technical - Weekly❣️#Ethereum has been experiencing a downward trend with lower highs and lower lows, suggesting a bearish outlook in the short term. However, there are signs of a potential sideways movement in the very short term.
sharing a 📉chart for your reference so any body can learn and make decision.💟
Eterium SHOWING A GOOD SELLING MOMENTUMEterium showing a good falling
Here in ETHUSD you can see a clear-cut neckline formed and the line now ready to break
After the breakout it's give a good move
Also in bitcoin showing a good falling
As you Guys know the move cooperatively
So you can trade with
Adding your analysis

ETHEREUM USDT PERPETUALWait for structure to develop in ethereum and you can go long/short depending on BO/BD

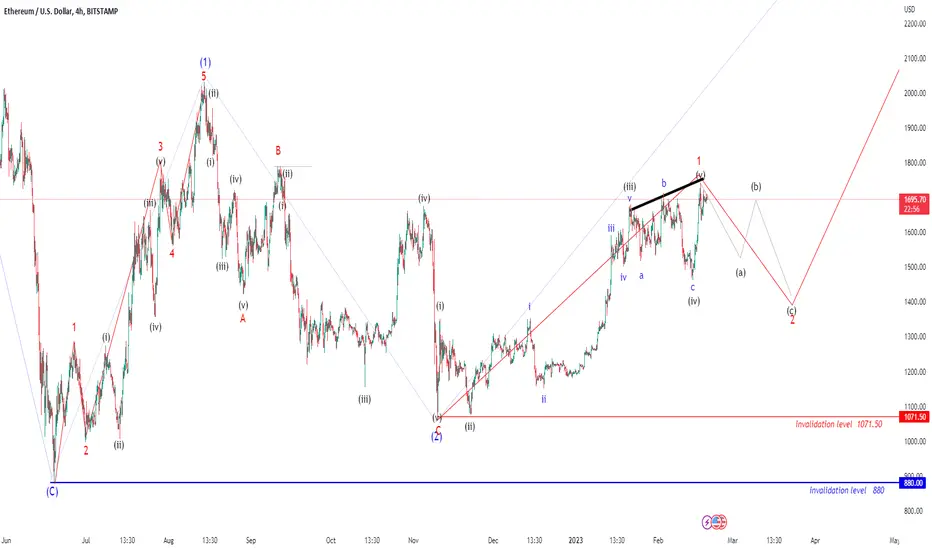
Ethereum possible Elliot wave counts Here we have shared possible Elliot wave counts of ETHUSD (for educational purpose only) which are suggesting correction for very short term and this correction can be used as good opportunity to go long for further trend which is expected post this correction, the invalidation level of further up move can be low of previous wave 1 which is pegged at 1071.50, if it breaks below this level then we can assume that our counting is missing something and we may invalidate this structure, Overall we are unfolding some impulse in which we had completed wave (1) and now possibly we are heading to unfold wave (2) and then, post correction we can start wave (3). wave (2) can unfold in three subdivisions like ABC and ABC can unfold in 5-3-5 structure or 3-3-5 structure. Lets see what happens next.
My studies are for educational purpose only.
Please Consult your financial advisor before trading or investing.
I am not responsible for any kinds of your profits and your losses.
Overall wave structure is shared below
Most investors treat trading as a hobby because they have a full-time job doing something else.
However, If you treat trading like a business, it will pay you like a business. If you treat like a hobby, hobbies don't pay, they cost you...!
Disclaimer.
I am not sebi registered analyst.
My studies are for educational purpose only.
Please Consult your financial advisor before trading or investing.
I am not responsible for any kinds of your profits and your losses.
ETHUSDT triangle pattern and upside is limitedETHUSDT is running under triangle pattern and upside is limited. You can check yourself and take your own decisions.

Ethereum forming Head & shoulder pattern.Ethereum is forming a head and shoulder pattern on a daily time frame after retracing the fibonnaci level of 38.2% and 20 DMA.
The coin has given a nice movement and is retracing before another up move.
The coin is trading below the moving averages.
Two confirmation patterns are being formed in the coin on the daily time frame
1. Head and shoulder pattern
2. Bearish III continous pattern
A down side moment can give nice targets as there a 3 confirmation.
1. Trading below 20 ema(daily time frame).
2. Break of Head and shoulder neck line.
3. Volumes are high.
Support :- 1390, 1245.
Resistance :- 1715, 2000
US markets fell about 1000 points (3%).
The crypto markets can also fell the pain.
Wait for the coin to break the support and form some price action near it.

Ethereum gives a nice breakout of "W" Pattern.Ethereum looks bullish on a higher time frame and has crossed the resistance of 3100 levels.
It has closed above the level on daily time frame and is taking resistance form is 20 ema.
A nice morning star pattern is there on a daily time frame and trading between the moving averages.
On a 4 hour time frame the coin has given a "W" pattern break out with good volumes and has crossed it 20 and 200 ema .
Support :- 3100, 3040, 2960
Resistance :- 3198,3320
There is a crucial resistance near 3130-50 i.e. 20 ema on daily and weekly time frame.
Wait for the price action and candlestick pattern near the levels.

Ethereum trading view for next week 11/04/22Ethereum has streched for contunues week
and changing the trend near the support
level.
Its taking support from the 20 ema on a
weekly time frame.
The price has tested the
support and has given a upmove.
On daily time frame too there is a bullish
momentum in the price as its taking support
from 20 ema and has given a cross over in
the moving averages.
Ethereum can run either side as its trading
between 20 and 200 ema on 4 hour time
frame.
Support :- 3100, 3020, 2950
Resistance :- 3434. 3675
It has support near its trading price and can
reverse form the support.
On a short time frame there can be a
resistance at 3320.
So wait for the price action near the levels
before trading the coin.

Ethereum gives a nice breakout of "W" Pattern.Ethereum has streched for contunues week and changing the trend near the support level.
Its taking support from the 20 ema on a weekly time frame.The price has tested the support and has given a upmove.
On daily time frame too there is a bullish momentum in the price as its taking support from 20 ema and has given a cross over in the moving averages.
Ethereum can run either side as its trading between 20 and 200 ema on 4 hour time frame.
Support :- 3100, 3020, 2950
Resistance :- 3434, 3675
It has support near its trading price and can reverse form the support.
On a short time frame there can be a resistance at 3320.
So wait for the price action near the levels before trading the coin.


Eth/usdtEthereum hitt approx all targets but now looking slightly bearish with head& shoulders pattern, if we loose supports then maybe hit lower targets..!!

ethereum Channel BreakoutEthereum has given a channel Breakout and looks strong as long as its going to take support on the channel.

💡Don't miss the great buy opportunity in ETHUSDTrading suggestion:
". There is a possibility of temporary retracement to suggested support line (2000).
. if so, traders can set orders based on Price Action and expect to reach short-term targets."
Technical analysis:
. ETHUSD is in a uptrend and the continuation of uptrend is expected.
. The price is above the 21-Day WEMA which acts as a dynamic support.
. The RSI is at 52.
Take Profits:
TP1= @ 2080
TP2= @ 2145
TP3= @ 2199
TP4= @ 2270
TP5= @ 2340
SL= Break below S2
❤️ If you find this helpful and want more FREE forecasts in TradingView
. . . . . Please show your support back,
. . . . . . . . Hit the 👍 LIKE button,
. . . . . . . . . . Drop some feedback below in the comment!
❤️ Your Support is very much 🙏 appreciated! ❤️
💎 Want us to help you become a better Forex trader ?
Now, It's your turn !
Be sure to leave a comment let us know how you see this opportunity and forecast.
Trade well, ❤️
ForecastCity English Support Team ❤️

💡Don't miss the great buy opportunity in ETHUSDTrading suggestion:
". There is a possibility of temporary retracement to suggested support line (1731.90).
. if so, traders can set orders based on Price Action and expect to reach short-term targets."
Technical analysis:
. ETHUSD is in a range bound and the beginning of uptrend is expected.
. The price is above the 21-Day WEMA which acts as a dynamic support.
. The RSI is at 73.
Take Profits:
TP1= @ 1863.30
TP2= @ 1946.45
TP3= @ 2040. 40
TP4= @ 2217.00
TP5= @ 2375.50
SL= Break below S2
❤️ If you find this helpful and want more FREE forecasts in TradingView
. . . . . Please show your support back,
. . . . . . . . Hit the 👍 LIKE button,
. . . . . . . . . . Drop some feedback below in the comment!
❤️ Your Support is very much 🙏 appreciated!❤️
💎 Want us to help you become a better Forex trader?
Now, It's your turn!
Be sure to leave a comment let us know how you see this opportunity and forecast.
Trade well, ❤️
ForecastCity English Support Team ❤️

ETHUSD Update: Profit=22850 SL=7050 Reward/Risk > 3.2:1 Trade Setup summary:
Profit targets=22850 pip (3270 + 6970 + 12610)
Stop Loss =7050 pip
Reward/Risk > 3.2: 1
Current Status:
Total Profit: 42250 pip
Closed trade(s): 13150 pip Profit
Open trade(s): 29100 pip Profit
Trade Setup:
We opened 5 BUY trade(s) @ 339.00 based on 'previous Forecast' at 2020.08.02 :
Closed Profit:
TP1 @ 393.00 touched at 2020.08.03 with 5400 pip Profit.
TP2 @ 416.50 touched at 2020.08.13 with 7750 pip Profit.
5400 + 7750 = 13150
Open Profit:
Profit for one trade is 436.00(current price) - 339.00(open price) = 9700 pip
3 trade(s) still open, therefore total profit for open trade(s) is 9700 x 3 = 29100 pip
Technical analysis:
. ETHUSD is in a range bound and the beginning of uptrend is expected.
. The price is above the 21-Day WEMA which acts as a dynamic support.
. The RSI is at 70.
New Trading suggestion:
. There is still a possibility of temporary retracement to suggested support line (416.50) again. if so, traders can set orders based on Price Action and expect to reach short-term targets.
New Take Profits:
TP3= @ 449.20
TP4= @ 486.20
TP5= @ 542.60
SL= Break below 393.00
❤️ If you find this helpful and want more FREE forecasts in TradingView
. . . . . Please show your support back,
. . . . . . . . Hit the 👍 LIKE button,
. . . . . . . . . . . Drop some feedback below in the comment!
❤️ Your Support is very much 🙏 appreciated!❤️
💎 Want us to help you become a better Forex trader?
Now, It's your turn!
Be sure to leave a comment let us know how do you see this opportunity and forecast.
Trade well, ❤️
ForecastCity English Support Team ❤️

ETHUSD Update: Profit=32250 SL=11600 Reward/Risk > 2.8:1 Trade Setup summary:
Profit targets=32250 pip (2350 + 5620 + 9320 + 14960)
Stop Loss =11600 pip
Reward/Risk > 2.8 : 1
Current Status:
Total Profit: 29400 pip
Closed trade(s): 5400 pip Profit
Open trade(s): 24000 pip Profit
Trade Setup:
We opened 5 BUY trade(s) @ 339.00 based on 'previous Forecast' at 2020.08.02 :
Closed Profit:
TP1 @ 393.00 touched at 2020.08.03 with 5400 pip Profit.
Open Profit:
Profit for one trade is 399.00(current price) - 339.00(open price) = 6000 pip
4 trade(s) still open, therefore total profit for open trade(s) is 6000 x 4 = 24000 pip
Technical analysis:
. ETHUSD is in a range bound and the beginning of uptrend is expected.
. The price is above the 21-Day WEMA which acts as a dynamic support.
. The RSI is at 61.
New Trading suggestion:
. There is still a possibility of temporary retracement to suggested Uptrend and price reject from uptrend. if so, traders can set orders based on Price Action and expect to reach short-term targets.
New Take Profits:
TP2= @ 416.50
TP3= @ 449.20
TP4= @ 486.20
TP5= @ 542.60
SL: Break Below Uptrend
❤️ If you find this helpful and want more FREE forecasts in TradingView
. . . . . Please show your support back,
. . . . . . . . Hit the 👍 LIKE button,
. . . . . . . . . . . Drop some feedback below in the comment!
❤️ Your Support is very much 🙏 appreciated!❤️
💎 Want us to help you become a better Forex trader?
Now, It's your turn!
Be sure to leave a comment let us know how do you see this opportunity and forecast.
Trade well, ❤️
ForecastCity English Support Team ❤️

ETHUSD Update: Profit=46750 SL=15500 Reward/Risk > 3:1 Trade Setup summary:
Profit targets=46750 pip (2900 + 5250 + 8520 + 12220 + 17860)
Stop Loss =15500 pip
Reward/Risk > 3 : 1
Current Status:
Total Profit: 13929 pip
Closed trade(s): 13929 pip Profit
Open trade(s): 0 pip Profit
Trade Setup:
We opened 5 BUY trade(s) @ 229.34 based on 'previous Forecast' at 2020.07.06 :
Closed Profit:
TP1 @ 237.34 touched at 2020.07.20 with 800 pip Profit.
TP2 @ 244.77 touched at 2020.07.21 with 1543 pip Profit.
TP3 @ 244.77 touched at 2020.07.22 with 2405 pip Profit.
TP4 @ 263.70 touched at 2020.07.22 with 3436 pip Profit.
TP5 @ 286.79 touched at 2020.07.24 with 5745 pip Profit.
800 + 1543 + 2405 + 3436 + 5745 = 13929
Technical analysis:
. ETHUSD is in a range bound and the beginning of uptrend is expected.
. The price is above the 21-Day WEMA which acts as a dynamic support.
. The RSI is at 83.
New Trading suggestion:
. There is still a possibility of temporary retracement to suggested uptrend. if so, traders can set orders based on Price Action and expect to reach short-term targets.
New Take Profits:
TP1= @ 393.00
TP2= @ 416.50
TP3= @ 449.20
TP4= @ 486.20
TP5= @ 542.60
SL= Break below 333.00
❤️ If you find this helpful and want more FREE forecasts in TradingView
. . . . . Please show your support back,
. . . . . . . . Hit the 👍 LIKE button,
. . . . . . . . . . . Drop some feedback below in the comment!
❤️ Your Support is very much 🙏 appreciated!❤️
💎 Want us to help you become a better Forex trader?
Now, It's your turn!
Be sure to leave a comment let us know how do you see this opportunity and forecast.
Trade well, ❤️
ForecastCity English Support Team ❤️

There is a possibility for the beginning of an uptrend in ETHUSDTrading suggestion:
. There is a possibility of temporary retracement to suggested support line (217.11). if so, traders can set orders based on Price Action and expect to reach short-term targets.
Technical analysis:
. ETHUSD is in a range bound and the beginning of uptrend is expected.
.The price is above the 21-Day WEMA which acts as a dynamic support.
. The RSI is at 68.
Take Profits:
TP1= @ 247.07
TP2= @ 286.99
TP3= @ 362.78
SL= Break below S2

Don't miss the great buy opportunity in ETHUSDTrading suggestion:
. There is a possibility of temporary retracement to suggested support line (202.17). if so, traders can set orders based on Price Action and expect to reach short-term targets.
Technical analysis:
. ETHUSD is in a range bound and the beginning of uptrend is expected.
.The price is above the 21-Day WEMA which acts as a dynamic support.
. The RSI is at 50.
Take Profits:
TP1= @ 224.50
TP2= @ 245.00
TP3= @ 286.80
SL= Break below S2

Don't miss the great buy opportunity in EthereumTrading suggestion:
. There is a possibility of temporary retracement to suggested support line (147.65). if so, traders can set orders based on Price Action and expect to reach short-term targets.
Technical analysis:
. ETHUSD is in a range bound and the beginning of uptrend is expected.
.The price is above the 21-Day WEMA which acts as a dynamic support.
. The RSI is at 61.
Take Profits:
TP1= @ 178.75
TP2= @ 200.40
TP3= @ 235.45
SL= Break below S2

Don't miss the great buy opportunity in ETHUSDTrading suggestion:
. There is a possibility of temporary retracement to suggested support line (146.85). if so, traders can set orders based on Price Action and expect to reach short-term targets.
Technical analysis:
. Ethereum/US Dollar is in a range bound and the beginning of uptrend is expected.
.The price is above the 21-Day WEMA which acts as a dynamic support.
. The RSI is at 65.
. The RSI downtrend #1 is broken, so the probability of beginning of uptrend is increased.
Take Profits:
TP1= @ 163.30
TP2= @ 191.75
TP3= @ 223.20
SL= Break below S2
