ETHFIUSDT - BULLS ARE NOT DONE YET?Symbol - ETHFIUSDT
ETHFIUSDT is undergoing a corrective phase after updating its local high at 1.938 The breakout above the 1.677 zone appears to be an attempt to initiate a distribution phase following an extended period of consolidation. The key question now is whether the bulls can sustain control above this area.
Bitcoin is also in correction mode following a false breakout of its resistance level. In this context, the broader cryptocurrency market is experiencing a temporary decline. Nevertheless, the prevailing trend remains bullish, supported by a favorable fundamental outlook. Once the current correction concludes, market growth may resume.
On the daily timeframe, ETHFIUSDT is attempting to transition into a distribution phase after approximately five to six months of consolidation. The overall trend remains upward, and following the breakout of resistance, a corrective movement toward the liquidity zone at 1.677 is developing. A false breakdown, accompanied by a shift in market imbalance and subsequent consolidation above 1.678, could stimulate renewed buyer interest - potentially leading to further price appreciation.
Resistance levels: 1.898, 1.938
Support levels: 1.677, 1.534
The chart highlights two critical support zones - 1.677 and 1.534, Sustained bullish activity above the 1.677 level may result in a rebound and continued upward movement, confirming the ongoing distribution phase. Conversely, failure to maintain this level could prompt a retest of the zone at 1.534, where a liquidity sweep may subsequently trigger a new wave of buying pressure.
ETHFIUSDT

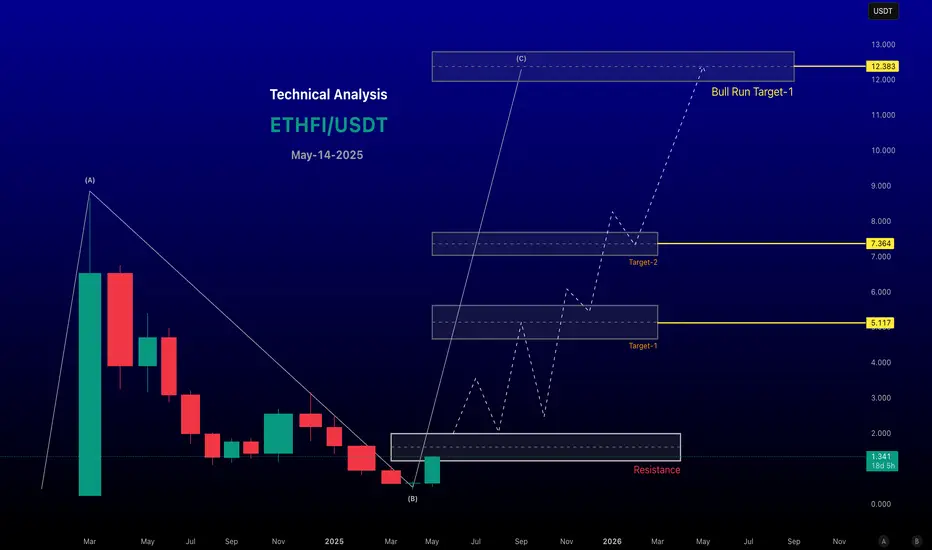
ETHFI/USDT CAN TOUCH $12#ETHFI/USDT Technical Analysis (as of May 14, 2025)
#Current Market Sentiment and Price Action
Price Trend: ETHFI has shown bullish momentum recently indicate a breakout from a descending broadening wedge on the daily timeframe, suggesting potential for a strong bullish 'C' wave if the breakout is sustained.
Recent Performance: A surge of 40.9% in 24 hours was noted, accompanied by a 351.5% increase in trading volume, signalling strong market conviction.
Current Price Levels: Specific price points mentioned include a consolidation around $1.335– at the time of posting with a potential pullback to $0.96 or lower to fill imbalances.
Chart for your reference
$ETHFI #ETHFI has Accumulated over 112 days
Expecting +50% to 200% Bullish Rally in the Swing Trade.
Buy And Hold…

ETHFI's Bullish Move Or Trap? Critical Levels To Watch Now!Yello Paradisers! Are we on the brink of a massive bullish breakout for #ETHFIUSDT, or is it a trap? Let's dive in and find out.
💎#ETHFI has formed a triangle pattern and is currently showing a W pattern at the demand zone, signaling a potential bullish move. Here's what to watch for:
💎We need an I-CHoCH from here. Alternatively, a breakout of the W pattern can indicate a bullish move, but it comes with risks. If you're planning to trade this, consider setting small profit targets for safety.
💎If the price breaks out and closes above the resistance zone, we can expect a bullish move. This confirmation is crucial for a confident entry.
💎If the candle closes below the demand zone, it will invalidate our bullish idea. In this case, it's better to wait for clearer price action before making any decisions.
Strive for consistency, not quick profits. Treat the market as a businessman, not as a gambler.
MyCryptoParadise
iFeel the success🌴
