NZDUSD Forming a Great Sell side scenario....NZDJPY is approaching 4H resistance zone, which has already show rejection previously. There is also a steep bullish trend line creating a confluence. There is a valid 4H FVG at upside. All these things signalling a coming very good sell side opportunity. Below are points detailing the same.
1. Price is approaching 4H resistance zone. Which may act as a strong supply zone.
2. Very steep Bullish Trend line developing a confluence at resistance. Steep trend line is always prone for breakout/breakdown.
3. Most probably price will take liquidity of resistance zone and break trend line.
4. After breaking trend line it should pullback till resistance/trend line or any newly created OB/FVG.
5. There are two possible reversal point 1. At nearest resistance. 2. At 4H FVG and higher trendline.
All these combinations are signalling a high probability and high Risk and Reward (1:8) trade scenario.
Note – if you liked this analysis, please boost the idea so that other can also get benefit of it. Also follow me for notification for incoming ideas.
Also Feel free to comment if you have any input to share.
Disclaimer – This analysis is just for education purpose not any trading suggestion. Please take the trade at your own risk and with the discussion with your financial advisor.
Ethlong

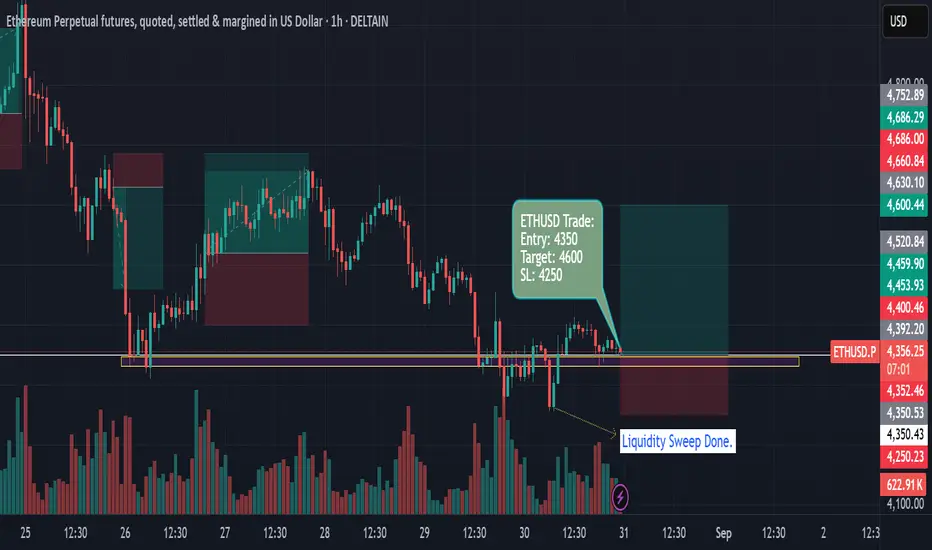
ETHUSD 1H — Liquidity Sweep Reversal with Precision EntryTrade Summary
• Entry: $4,350
• Target: $4,600
• Stop Loss: $4,250
• Risk/Reward Ratio: 2.5:1
After a significant liquidity sweep just below $4,350, Ethereum Perpetual Futures have reclaimed support and established a potential reversal base. The trade enters at $4,350, with a tight stop loss at $4,250, banking on the exhaustion of sellers and fresh momentum above reclaimed support. The target is $4,600, right before a major resistance cluster and previous swing high, offering clarity on profit-taking and risk parameters.
Recent price action signals a shift from bearish momentum to consolidation, as aggressive buyers absorbed supply during the liquidity sweep — a signature move that often precedes sustained rallies. The setup features:
• Clear horizontal support with visible volume confirmation
• Precise entry post-sweep for maximum risk efficiency
• Stop loss positioned below the sweep zone for strict invalidation
• Well-defined target near a high liquidity supply area
Why I like it: Excellent risk management, technical clusters, and early signs of trend reversal. Would love feedback from the community on additional confluence factors or alternate views!
ETH Long🔎 Chart Breakdown:
1. Trendline Support (Orange Line)
• You’ve drawn an ascending trendline starting from Aug 26.
• Price just touched and bounced from this trendline around $4,490, showing it’s acting as a dynamic support.
2. EMA Indicators (15 & 35)
• Blue = EMA 15
• Yellow = EMA 35
• Currently, EMA 15 is below EMA 35 → short-term bearish bias, but if price holds the trendline, EMAs may start crossing bullish.
3. Support & Resistance Zones (Red & White Levels)
• Immediate support: $4,467 → just below current price.
• Major support: $4,370 → strong horizontal demand zone.
• Resistance levels:
• $4,570 (short-term resistance)
• $4,656 (next target/resistance)
• $4,854 (higher resistance).
4. Trade Setup on Chart (Green & Red Box)
• Looks like a long trade setup (buy position).
• Entry: Near $4,490 (trendline bounce).
• Take Profit (TP): Around $4,656.
• Stop Loss (SL): Below $4,370 zone.
• This gives a good risk-to-reward ratio if price respects the ascending trendline.
5. Volume
• No huge volume spike at the bounce, meaning confirmation is still weak.
• Need a strong bullish candle close above $4,570 for more conviction.
⸻
📌 Summary:
• ETH is bouncing from the ascending trendline at $4,490.
• If it holds, next upside targets are $4,570 → $4,656 → $4,854.
• If the trendline breaks, ETH could retest $4,370 support (and even $4,310 low).
This setup is a long position based on trendline support, but caution: if price closes below $4,467–$4,370, the bullish setup fails.

ETH Buy at perfect zone.ETH Buy scenario at perfect zone. ETH is creating a perfect scenario for buy on 4H TF.
1. Price is at support, FVG and OB confluence in premium zone at OTE.
2. Also showing rejection in price action.
3. Trend line is faked out.
P.S. - it is just analysis not any trade recommendation.

LONG ETH for 5000$ETH showing signs of Inside bar on daily timeframe. LONG here for a 5000$+ target.

ETHUSD | Technical Analysis 25/08/2025Hi,
ETH can form inverted head and should and go upside upto 5100+. Time period can be 4 to 5 days.
Disclaimer: This is only for educational purpose.
Thanks

ETH BigBOEntry- 4555-4545
Targets- All time High
SL- 4465 (FIb Levels)
Reason- After a big volume candle near all time high ETH made a retracement and from here it can continue its upside journey towards all time high and 5050 Levels. Entry is being made in Fib Golden zone level which has been made in bigger tf that is daily tf and entry in taken in the shorter tf that is 1 hr tf.
Disclaimer- This is just for educational purpose.
Jai Shree Ram

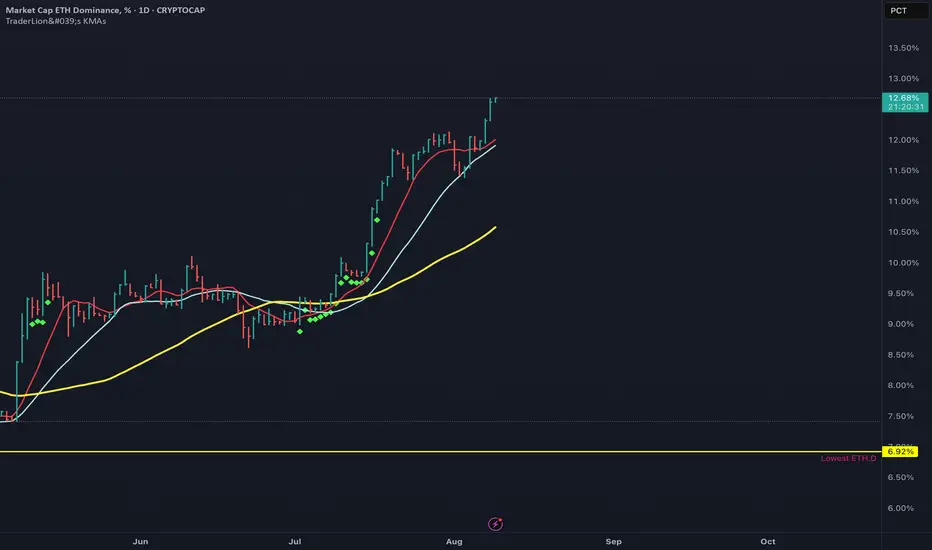
ETH DominanceETH market cap dominance has been stuck around the 9.3% level for a while, but now it’s breaking out and sitting around 12.6%. That’s a strong move, showing ETH is gaining ground compared to BTC.
What the chart is telling us:
Just broke through the 9.9% resistance and is holding above it
Moving averages are pointing up and momentum looks solid
If this keeps going, we could see 13–14% soon, maybe even 15% later on
If it drops back under 9.9%, that would weaken the setup
Why ETH might keep climbing
Institutions are loading up
Big companies are starting to put more of their treasury money into ETH. One example is Fundamental Global, which has a $5 billion Ethereum plan. They like ETH because it gives staking rewards, powers DeFi, and is at the center of tokenization.
401(k) crypto plans are now allowed
The US recently made it possible for retirement plans like 401(k)s to have crypto, including ETH. This could eventually bring in trillions of dollars into the market.
ETH turns 10
Ethereum just hit its 10-year mark. Long-term predictions are huge, with some saying it could hit $10k by 2030 and others going way higher. Over the years, ETH has gone from proof-of-work to proof-of-stake, rolled out upgrades like Dencun, and is planning more improvements like Pectra to make it faster and cheaper to use.
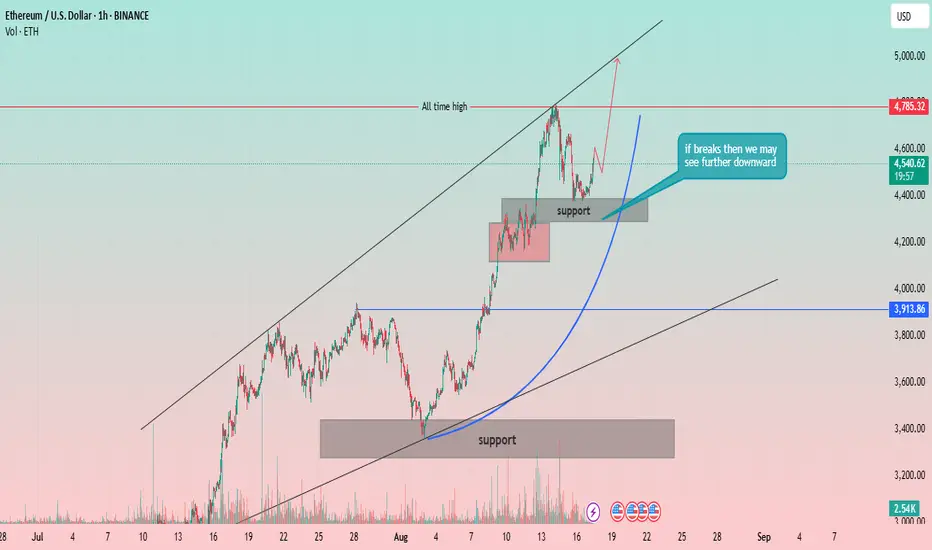
Ethereum (ETH) 1H Chart: Re-testing the All-Time High?Strong Uptrend Channel: The price of Ethereum has been moving within a well-defined ascending channel, indicated by two parallel black trendlines. This strong channel suggests a sustained bullish momentum.
All-Time High: A significant resistance level is marked as the "all-time high" at approximately 4,785.32 USD. The price has recently tested this level.
Support Levels:
Major Support Zone: A broad support zone is identified between approximately 3,300 USD and 3,450 USD. This zone has previously acted as a strong base for a price rally.
Recent Support Zone: A smaller, more recent support zone is marked around 4,200 USD. The price has consolidated within this area after its recent push towards the all-time high.
Price Action and Projections:
The price recently reached a peak near the all-time high and has since pulled back, consolidating within the recent support zone.
A key annotation states, "if breaks then we may see further downward." This highlights the importance of the 4,200 USD support zone. A break below this level could indicate a potential deeper retracement, possibly towards the lower trendline of the channel or the major support zone.
A parabolic arc is drawn (blue line), suggesting a potential trajectory for the price to continue its move higher from the current level, with a goal of re-testing or breaking the all-time high.
Volume: The chart includes a volume indicator, showing significant volume spikes during the major rallies and drops, confirming strong market interest and participation.
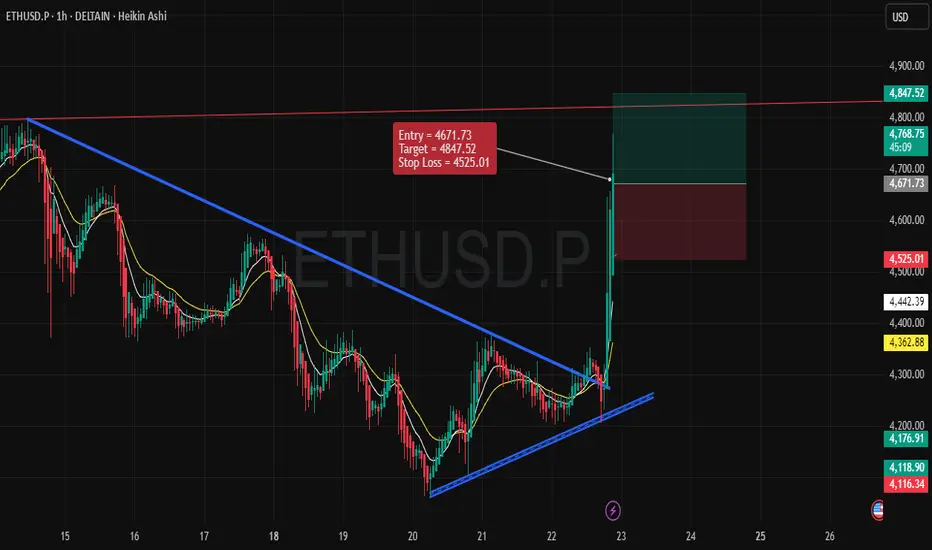
Bullish Scenario for ETH/USD (1-Hour Time Frame)Entry Point: 4671.73
Stop Loss: 4525.01
Target (Take Profit): 4847.52
1. Price Structure and Trend:
The price has been moving within a well-defined downtrend, but there has been a noticeable shift. The recent breakout above the blue trendline signals a potential reversal from a bearish to a bullish trend.
This breakout indicates increased buying interest, suggesting that ETH/USD might continue its upward momentum in the short term.
2. Key Levels:
Support Level: The price has recently bounced off a support zone near 4525, which acts as the stop loss level. A strong bounce from this point further validates the bullish outlook.
Resistance Level: The target price of 4847.52 is placed near a resistance zone, which represents the next major hurdle for ETH/USD.
3. Entry Strategy:
The entry point is placed at 4671.73, just after the breakout above the blue trendline, where the price is gaining upward momentum.
The market seems to have found new buying strength after consolidating, which strengthens the case for a potential move to the target level.
4. Risk-to-Reward Ratio (RRR):
The risk-to-reward ratio for this trade is favorable, with a potential gain of around 175 points (4847.52 - 4671.73) against a risk of approximately 146.72 points (4671.73 - 4525.01). This results in a solid 1:1.2 RRR, which is a reasonable expectation for this bullish trade.
5. Indicators and Confirmation:
The chart features moving averages (yellow and white lines) indicating a shift from a bearish trend to a bullish phase.
The price action shows strong buying pressure, especially with the recent candlestick pattern, confirming the breakout and trend continuation.
6. Conclusion:
With a confirmed breakout, an entry at 4671.73 offers a great opportunity for a bullish move towards the target of 4847.52. The stop loss is safely placed at 4525.01, considering recent support.
This trade setup appears well-aligned with the current market conditions and technical indicators, making it a logical and worthwhile trade idea.
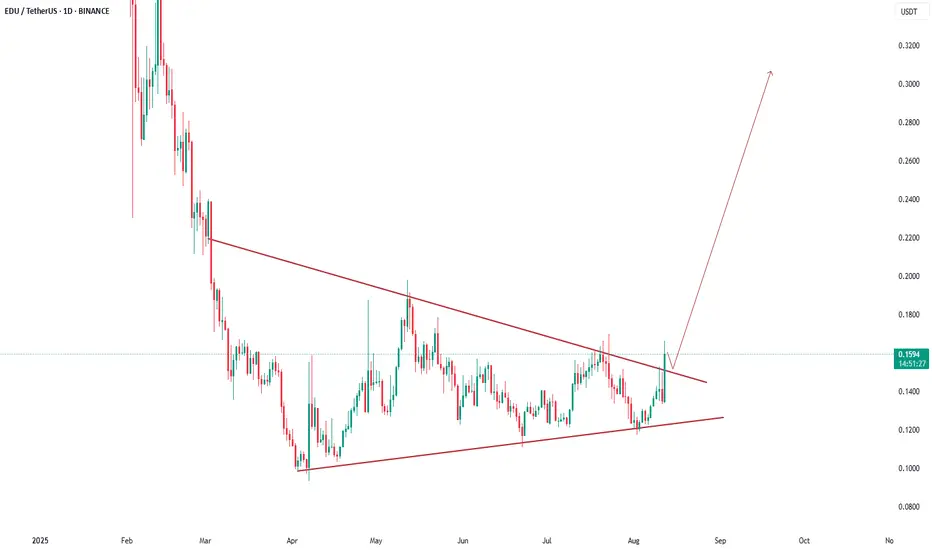
EDU/USDT Breakout from Symmetrical Triangle — Potential Bullish The daily chart for EDU/USDT on Binance shows a breakout above a long-term symmetrical triangle pattern after months of consolidation. Price has surged by over 18% today, supported by strong volume, signaling bullish momentum. If the breakout holds, the chart projection suggests a potential rally toward the $0.30 zone. Traders may watch for retests of the breakout line as possible support before continuation.
This is general information only and not financial advice. For personal guidance, please talk to a licensed professional.
ETHUSD | Technical Analysis 10/08/2025Hi,
ETH can create new all time high from 4195 to 4365+ (200% supply zone)
Disclaimer: This is only for educational purpose.
Thanks

Eth tp hit and now going for short with low slLast chart tp hitted perfectly
NOW looking for shorts again and this is nothing those are catch the full runnnn
Must share this more coming
#ETH Bullish Idea And Possible MoveAll signs point to Ethereum’s crash risk being behind us for now. Get ready—once the volume picks up, ETH is set to pump hard!
I’m using a unique approach beyond just the usual TA and PA, so don’t overthink it. Just follow the trend and watch those candlesticks light up!
Disclaimer: This isn’t financial advice or a trade call—just sharing my excitement!
ETH Long Setup: Key Support Zone at $2,453.72The $2,453.72 zone on CRYPTOCAP:ETH looks promising for our next potential long setup.
It’s a key support level and holds significant liquidity—definitely a zone worth watching.
This is not financial advice. Always trade at your own risk.

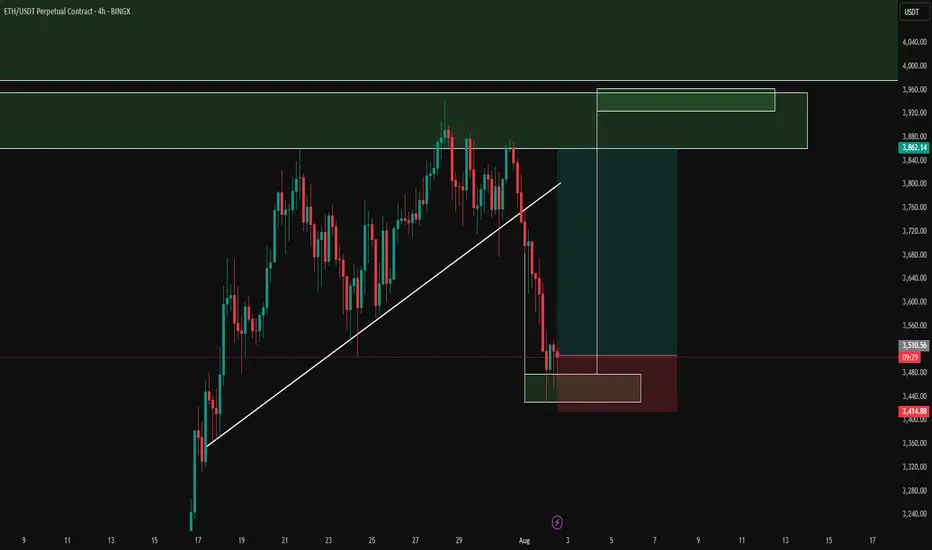
Intraday Long Setup | July 1st 2025 | Valid Until Daily ClosePrice retraced to a strong pivot zone.
Structure remains bullish with potential for continuation after pullback.
Tight risk control.
Watch for price reaction within the red zone. Entry only if confirmation appears
The setup expires at end of the daily candle close.
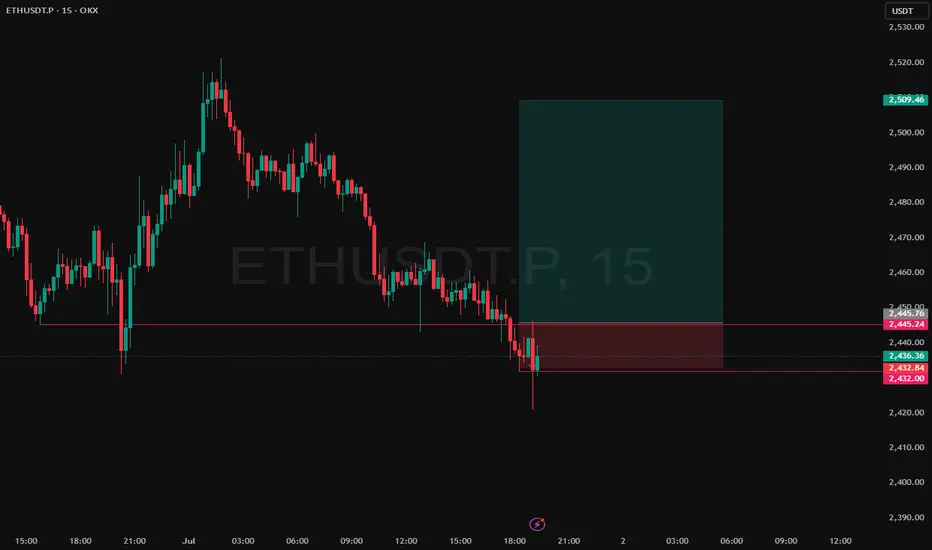
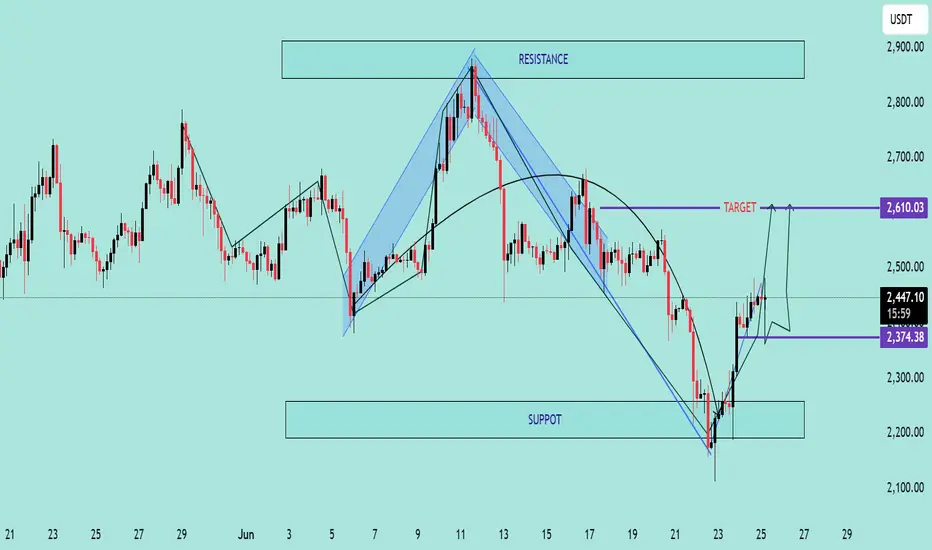
ETH/USDT Bullish Reversal AnalysisETH/USDT Bullish Reversal Analysis 🚀📈
🔍 Chart Overview:
Ethereum (ETH) has shown a strong bullish reversal from the support zone near $2,200, forming a V-shaped recovery pattern. The price is currently trading around $2,450, with upward momentum targeting the next key resistance level.
📌 Key Technical Highlights:
✅ Support Zone:
Clearly respected at $2,200 – $2,300 range
Multiple candle wicks suggest strong buyer interest
✅ Resistance Zone:
Major resistance expected around $2,900
Historical rejection indicates potential selling pressure
✅ Target Level:
Short-term target marked at $2,610 🟣
If momentum sustains, price could push towards this zone before facing resistance
📈 Bullish Momentum:
Strong breakout from downtrend channel
Formation of higher highs and higher lows
Price action respecting upward trend structure
🛠 Pattern Structure:
Reversal pattern after corrective phase
Bullish engulfing candles suggest continuation
📊 Forecast Path:
Two potential scenarios are outlined:
📈 A clean push to the $2,610 target, followed by consolidation
🔄 A short pullback to $2,374 before continuation to the target
⚠️ Conclusion:
ETH/USDT is showing bullish signs with potential to reach $2,610. Watch for consolidation or pullbacks as buying opportunities, but be cautious of heavy resistance above $2,900. Ideal for short- to mid-term bullish setups.
🔔 Recommendation:
Monitor price action around $2,374–$2,450 zone for potential entries with tight risk
Ethereum Accumulation Zones Huge Dip Incoming- Ethereum is currently trading at 2262, down more than 22%
- Ethereum has two important areas to look at, and some important zones like 2110 & the OTEs 1694-1880$
- From an accumulation perspective, I would like to wait for ETH to purge either below the Inefficient gap or start going sideways at the buying zones
- To confirm this bias, we also need to make sure we consider taking a look at USDT D as well once it tops out, ETHs bottom will be near
- Manage risk properly and try to only trade in Spot

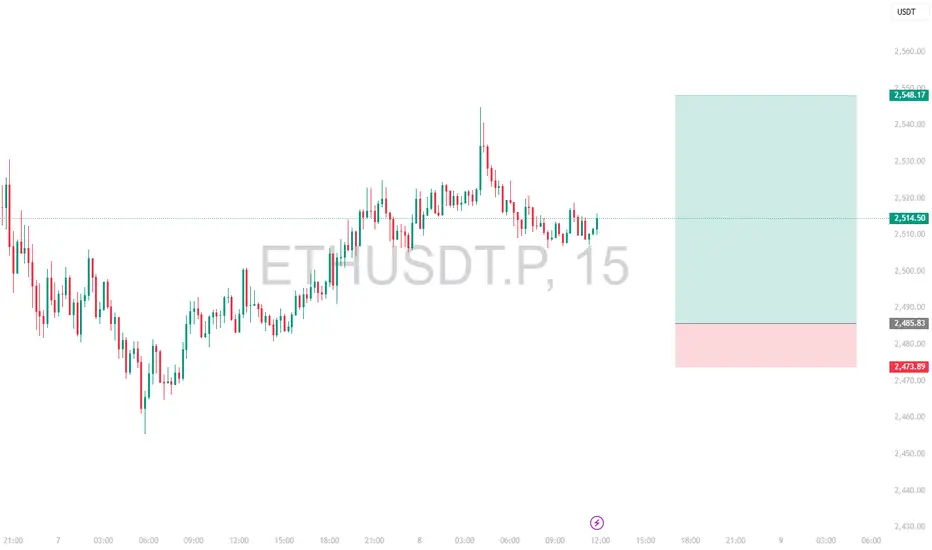
Intraday Long Setup | June 20th 2025 | Valid Until Daily ClosePrice retraced to a strong pivot zone.
Structure remains bullish with potential for continuation after pullback.
Tight risk control.
Watch for price reaction within the red zone. Entry only if confirmation appears
The setup expires at end of the daily candle close.
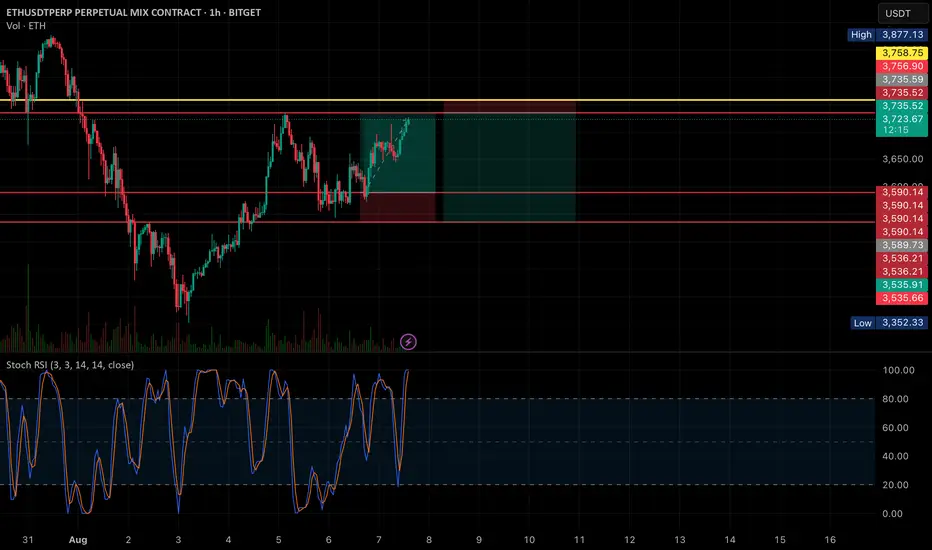
"Bearish Reversal Opportunity Following Supply Zone Rejection"1. Double Top Formation (Resistance Level Identified)
The chart displays a clear double top structure at the 2,760–2,800 USDT level.
This level has acted as a strong supply zone (highlighted in red), where price previously reversed, indicating heavy selling interest.
Current price action has retested this resistance zone and shown signs of rejection.
2. Liquidity Sweeps & False Breakouts
On the left side of the chart, an aggressive downward wick (marked with a blue arrow) suggests a liquidity sweep below a key low before strong bullish momentum returned.
This type of price action indicates smart money involvement, designed to remove weak hands before pushing price higher.
3. Accumulation Phases (Sideways Consolidation)
Multiple accumulation ranges are highlighted with blue rectangles.
These ranges show horizontal consolidation, where price builds up energy before breakout.
The most recent breakout led to a vertical rally toward the resistance zone, signaling an end of the accumulation and a start of distribution.
4. Double Bottom Support Structure
Identified near the 2,480 level, marked by red circles.
This level has historically acted as demand/support, evidenced by multiple bounces from this price zone.
Now highlighted with a grey zone, it is projected to act as the next key support area.
5. Bearish Projection
A large black arrow suggests a forecasted bearish move from the current high (~2,800) back to the support zone (~2,480).
This aligns with the idea of a mean reversion or pullback after a strong bullish impulse.
---
Conclusion & Trade Idea:
🔻 Bias: Bearish (Short-term)
The chart presents a classic reversal pattern with a double top at a well-defined supply zone.
Entry could be considered after confirmation of rejection from this level.
🧠 Trade Plan Suggestion:
Entry: Short near 2,780–2,800 after bearish confirmation (e.g., bearish engulfing candle or break of structure).
Target: 2,480 (support zone).
Stop Loss: Above 2,820 (recent high).
Risk-Reward: Approximately 1:2.5 or better depending on execution.

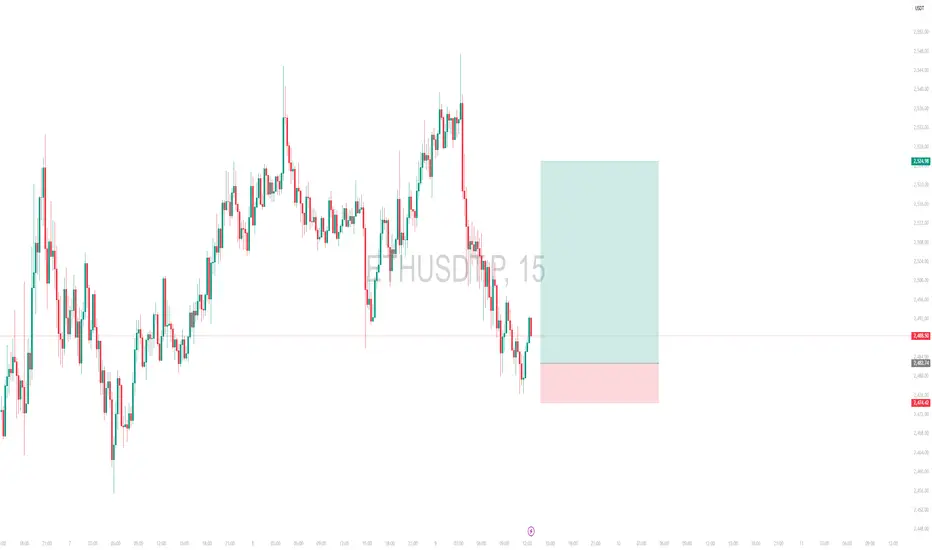
Intraday Long Setup | June 9th 2025 | Valid Until Daily ClosePrice is retracing to a strong pivot zone.
Structure remains bullish with potential for continuation after pullback.
Tight risk control.
Watch for price reaction within the red zone. Entry only if confirmation appears
The setup expires at end of the daily candle close.
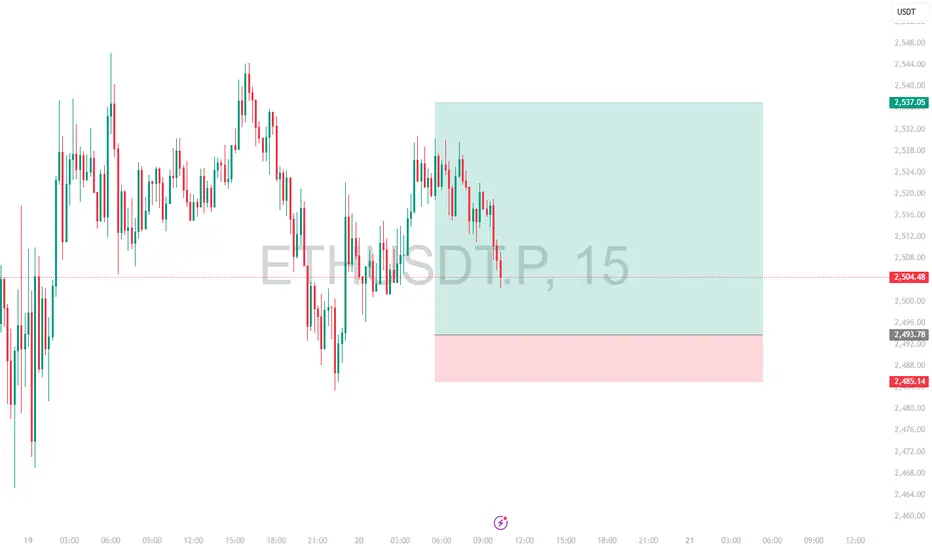
Intraday Long Setup | June 8th 2025 | Valid Until Daily ClosePrice is retracing to a strong pivot zone (marked by the red box).
Structure remains bullish with potential for continuation after pullback.
The green box represents a high-probability long opportunity with tight risk control.
Watch for price reaction within the red zone. Entry only if confirmation (e.g., bullish engulfing, strong wick rejections) appears.
The setup expires at end of the daily candle close.
Intraday Long Setup | June 4th 2025 | Valid Until Daily ClosePrice is retracing to a strong pivot zone (marked by the red box).
Structure remains bullish with potential for continuation after pullback.
The green box represents a high-probability long opportunity with tight risk control.
Watch for price reaction within the red zone. Entry only if confirmation (e.g., bullish engulfing, strong wick rejections) appears.
The setup expires at end of the daily candle close.
