#ETH one final hope?
One last hope for a bounce back.
If the price fails to break and hold above $3050, then we may see a downside move. The direction is still not clear.
Disclaimer:
This idea is provided for educational and informational purposes only.
It does not constitute financial advice, investment recommendations, or trade signals.
The creator and Systematic Traders Club are not responsible for any financial losses resulting from the use of this indicator.
Trading and investing involve risk. Always do your own analysis and use proper risk management.
Ethtrading

ETHUSD – Pure Price Action Analysis ETHUSD – Pure Price Action Analysis (Buy | Sell | TP | SL | No-Trade Zone)
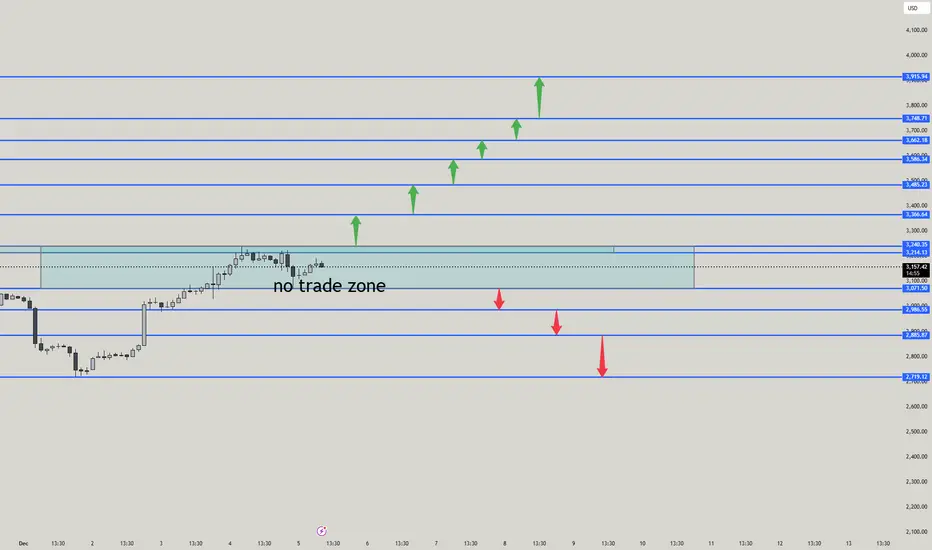
🚫 NO-TRADE ZONE (Ranging / Indecision Area)
The shaded box between $3,140 – $3,245 is your no-trade zone.
Reason:
Market is consolidating
No strong direction
Liquidity building
Smart money accumulation area
👉 Inside this box = avoid entries.
Wait for breakout + retest.
✅ BUY SETUP (Breakout → Retest → Long)
Buy Entry Levels
1️⃣ Buy above $3,245 (clean breakout & retest)
2️⃣ Safer buy above $3,290 (strong momentum zone)
Buy-Side Targets (TP)
🎯 TP1 → $3,366
🎯 TP2 → $3,428
🎯 TP3 → $3,502
🎯 TP4 → $3,602
🎯 TP5 → $3,748
🎯 TP6 → $3,915 (high probability supply zone)
STOP LOSS for Buy
🛑 SL → Below breakout candle
Safer → Below $3,200
❌ SELL SETUP (Breakdown → Retest → Short)
Sell Entry Levels
1️⃣ Sell below $3,100
2️⃣ Aggressive sells at each retest shown by red arrows.
Sell-Side Targets (TP)
🎯 TP1 → $2,986
🎯 TP2 → $2,885
🎯 TP3 → $2,719 (major demand zone)
STOP LOSS for Sell
🛑 SL → Above the retest candle
Safer → Above $3,140
🔥 BEST HEADING FOR THIS ANALYSIS
ETHUSD – Breakout Trading Plan | Buy–Sell Zones | TP–SL | No-Trade Zone
📌 SUMMARY (Very Clear)
🚫 No-Trade Zone:
$3,140 – $3,245
✅ Buy only if price breaks → retests → holds above $3,245
TP → 3,366 / 3,428 / 3,502 / 3,602 / 3,748 / 3,915
SL → Below 3,200
❌ Sell only if price breaks → retests → fails below $3,100
TP → 2,986 / 2,885 / 2,719
SL → Above 3,140
ETH - 1 Hour chart - LongPrice touched the trendline multiple times at points 1, 2, 3 and 4 and got rejected each time, showing that sellers were active on every move up. After this, the price took strong support from the green demand zone and bounced. Once the bounce came, price broke a small resistance and returned for a clean retest. The long entry was taken on this retest around 3505–3515, with the stop loss placed below the support zone near 3460–3470. The next major resistance around 3660–3670 was kept as the target. The idea behind the trade is simple: support held well, breakout happened, and the retest gave a low-risk buying opportunity.
Disclaimer: This analysis is for educational purposes only and not financial advice. Always do your own research before trading or investing.*

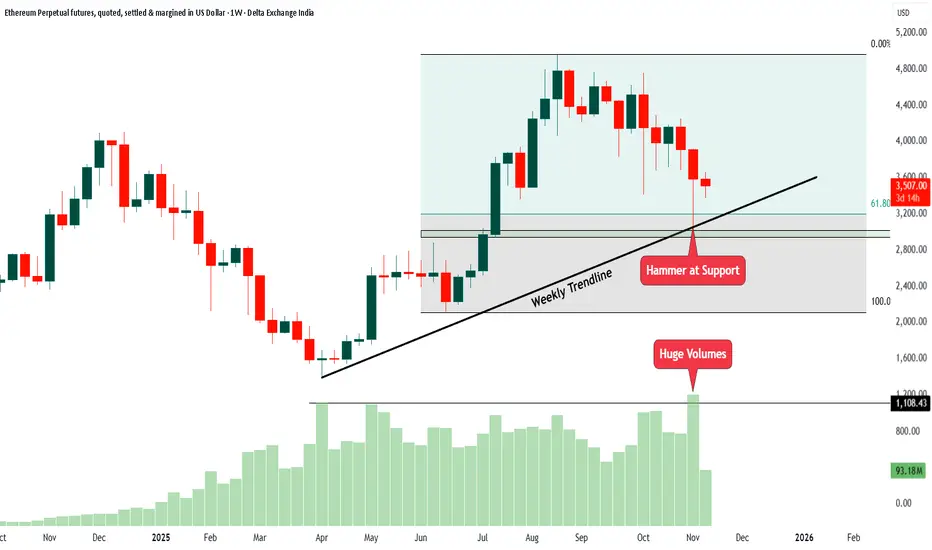
ETH Weekly Chart Analysis1. The price has been respecting a weekly trendline for many months. This trendline acts like a support line where buyers usually come in.
2. Recently, the price fell towards this same trendline and created a hammer candle. A hammer at support often shows that sellers pushed the price down, but buyers stepped in strongly and pulled it back up. This is usually a sign of buying interest.
3. The hammer candle formed exactly near the support zone and the Fibonacci 61.8 percent area. This area often works as a strong reversal point.
4. When the hammer candle formed, the volume was very high. Huge volume at support means big players were actively buying at lower levels.
5. The price is still inside a wide range between recent highs and lows. It has not broken out yet, but the support reaction is positive.
In simple words, the chart is showing a strong bounce setup from support with a hammer candle and high volume. This is a sign that buyers may try to take control again as long as the price stays above the trendline and support area.
ETHUSD | Technical Analysis 25/08/2025Hi,
ETH can form inverted head and should and go upside upto 5100+. Time period can be 4 to 5 days.
Disclaimer: This is only for educational purpose.
Thanks

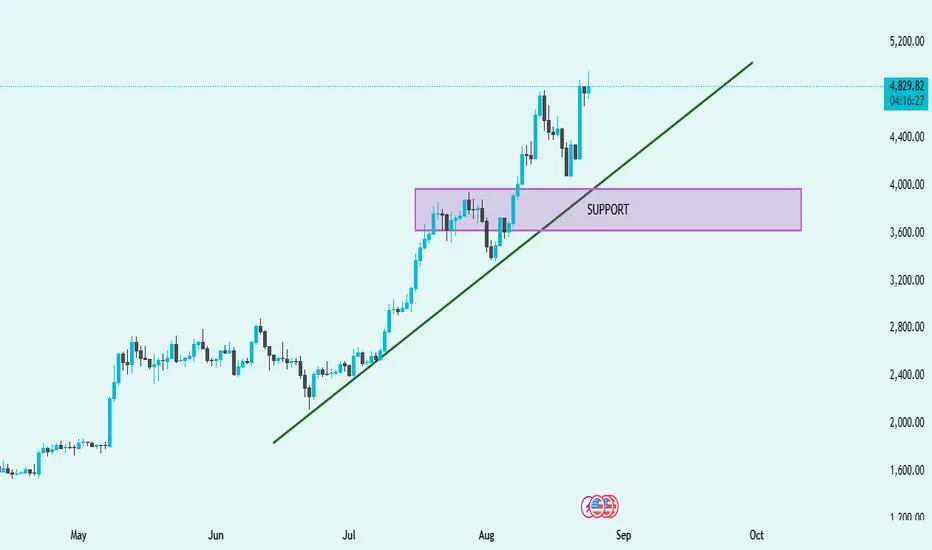
ETH/USD Technical Analysis – Strong Uptrend with Key Support📈 ETH/USD Technical Analysis – Strong Uptrend with Key Support
Trend Direction ➡️
The chart shows a clear bullish trend supported by an upward sloping trendline (green). Price action is consistently forming higher highs and higher lows, confirming strong upward momentum.
Support Zone 🟪
The highlighted support area (3,600 – 4,000) has been tested successfully. Price bounced strongly from this zone, showing buyers are actively defending this level.
Breakout & Momentum 🚀
After retesting support, ETH broke above the recent consolidation and is now trading around 4,843, pushing towards new highs. This signals bullish continuation if volume supports the move.
Trendline Confirmation 📐
The trendline has acted as a dynamic support multiple times. As long as ETH trades above it, the bullish trend remains intact.
Outlook 🔮
If ETH stays above 4,800, the next potential target could be 5,200+.
If price breaks below the trendline and the 3,600 support zone, bearish correction may begin.
✅ Summary: ETH is in a strong bullish trend 🚀, supported by both the trendline and key support zone. Short-term outlook remains bullish as long as 4,800 holds.
ETH - Potential Bullish Signs (Weekly) ETH forming some potential bullish signs on the weekly chart. These can take a few months to play out. We would like to see a bullish cross on the 21SMA and 50SMA. We would like to see the continuation on the stochastic RSI cross. We would like to see a break over the white trendline in the 3100 range. Lets see if the bullish hammer candle is in play with that long wick that was bought up in this past weekends sell off, closing Sunday. I would keep a tight stop loss around the 200SMA (Yellow).

Ethereum Next Target 3055 USD, Triangle Pattern BreakoutEthereum has formed a Triangle Pattern and breakout above it. It is also expected to Breakout of the Falling Channel, with the Next Target being the 0.5 Fibonacci Retracement level at 3,055 USD.
Support me, I want to help People "Make Profit" all over the "World". Thankyou.


My Planning in ETHUSDThe only thing you need to remember is that in trading, incurring losses is quite common, even if you are correct in your analysis

#Ethereum/USD downtrend movement potential with risk:reward 1.9#Ethereum/USD downtrend movement potential with risk:reward 1.9
Symbol :Ethereum / US dollar
Time frame :30 minutes
Analysis : Breakout from the support line and rallying on a down side.
Moving average 20 is below Moving average 40 and Macd is below zero.So, we can expect a down trend movement with risk:reward =1.9
Its a SELL call . SELL at 1825 with Stop-loss 1880 and the Target 1718 .
HOPE our analysis is adding value to your trading Journey.
NOTE: Published Ideas are for ‘’EDUCATIONAL PURPOSE ONLY’’ trade at your own risk.
NOTE: RESPECT The risk. SL should not be more than 2% of the capital.
Happy Trading

ETHEREUM/USDT 4HOUR UPDATE!!Hello dear traders, we here new so we ask you to support our ideas with your LIKE and COMMENT, also be free to ask any question in the comments, and we will try to answer for all, thank you, guys.
ETH/USDT UPDATE!
ETH/USDT is now trying to break the $1420-$1460 resistance area. If eth is able to break this resistance, we will see a move towards the key $1750 resistance area. If eth gets rejected from here, we will see another test of $1250.
Remember:-This is not a piece of financial advice. All investment made by me is at my own risk and I am held responsible for my own profit and losses. So, do your own research before investing in this trade.
Thanks for your time, we hope our work is good for you, and you are satisfied, we wish you a good day and big profits.
THANK YOU.

#Ethereum Trading Plan 24-25 Jan 2022In this chart of Ethereum I have marked 4 price levels which have been determined based on a proprietary calculation that I have developed. The zone between the top-most and bottom-most price levels is a strict "No Trade Zone".
If Ethereum's price crosses the top-most price level, we will be looking for long opportunities and if Ethereum's price crosses the bottom-most price level, we will be looking for short opportunities.
Entry criteria:
Bullish case: Enter as soon as a 5-minute candle CLOSES above the top-most price level.
Bearish case: Enter as soon as a 5-minute candle CLOSES below the bottom-most price level.
Stop Loss criteria:
Risk: 2% of capital of per trade.
Bullish case: Just below the second price level from the top.
Bearish case: Just above the second price level from the bottom.
Take profit criteria :
I personally follow a system wherein I do nothing until 1:1 RR is achieved. But post 1:1 RR is achieved, I adjust stop loss to cost. I then exit 1/3rd of entered quantity based on 5 minute candle close below ( bullish case) or above ( bearish case) 15 EMA . I exit 1/3rd of entered quantity at fixed take-profit level of 1:3 RR. And I exit the final 1/3rd of entered quantity based on a system of setting stop losses that are dynamically adjusted to the nearest retracement after a Day High Breakout (in bullish case) or Day Low Breakout (in bearish case).
I have also experimented with systems wherein you can set take-profit at a fixed level of 1:3 RR or alternatively after 1:1 is achieved book full quantity vased on 5 minute candle close below ( bullish case) or above ( bearish case) 15 EMA . Both of these alternative systems have also been profitable.
Please note the given zones are valid only until the end of the day. Any open positions must be closed by 05:25 AM IST which is around when the day is about to end in the cryptocurrency markets.
Also please note: according to the rules of my system, I don't take more than 3 trades per day on any asset.
P.S. Give the prevailing sentiment - I am biased towards the downside today.
